Sobha Approaching Key Fib Support — Bounce On the Cards?This is the daily timeframe chart of Sobha Ltd.
The stock is currently holding a strong support zone near the 1400–1430
range.
If this support level is sustained, Sobha may continue to trade within a range-bound structure.
A potential bullish move could emerge towards the 1650–1700 resistance zo
Next report date
—
Report period
—
EPS estimate
—
Revenue estimate
—
13.90 INR
946.86 M INR
40.35 B INR
44.43 M
About Sobha Limited
Sector
Industry
CEO
Jagadish Nangineni
Website
Headquarters
Bangalore
Founded
1995
ISIN
INE671H01015
FIGI
BBG000K8GFS8
IPO date
Nov 23, 2006
IPO offer price
14.32 USD
Sobha Ltd. engages in the construction, development, and management of real estate. It operates through the Real Estate, and Contractual and Manufacturing segments. The Real Estate segment is comprised of the development, sale, management and operation of all or any part of townships, housing projects, also includes leasing of self owned commercial premises. The Contractual and Manufacturing segment includes the development of commercial premises and other related activities. The company was founded by Puthan Naduvakkat Chenthamaraksha Menon in 1995 and is headquartered in Bangalore, India.
Related stocks

Is Sobha now in bullish zone?Sobha check it on daily and weekly TF. Don't you think now it's in bullish zone?
My targets are 1800 and 2000 in coming days and weeks. Stay tuned
Disclaimer: this is not a buy/sell recommendation.

SOBHA (NSE) (W)- Early Institutional ParticipationsPrice Action
The stock has formed a rounded bottom pattern following a prolonged downtrend, signaling a potential reversal. After testing resistance, the price has retraced slightly and is now showing signs of strength as it consolidates above key support. The current price action suggests the stoc

SOBHA IN Long🌎 Sobha is a vertically integrated luxury real estate developer in India.
The company controls the entire value chain, including structural manufacturing, joinery, and finishing, ensuring quality and timeliness.
The company is expected to reduce its dividend payout from 32% to 6.5%, freeing up mor

Sobha Ltd – Falling Channel Breakout WatchSobha Ltd – Falling Channel Breakout Watch
NSE:SOBHA
📈 Pattern & Setup:
Sobha Ltd has been consolidating within a falling channel for several months and is now attempting to break above the upper trendline resistance near 1,550–1,560 levels. The structure shows a clear transition from distrib

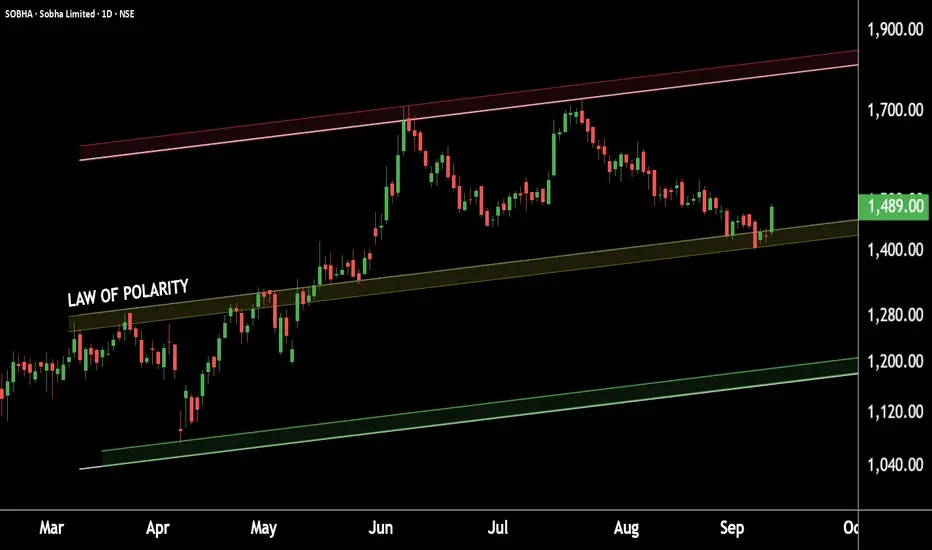
SOBHA Limited: Building Momentum from the Base!This is the daily chart of SOBHA Ltd.
The stock is currently taking strong support at Law of polarity near at the 1400–1450 zone.
If this level sustains, we may witness higher prices in SOBHA Limited.
Thank You !!
SOBHA - LONGNSE:SOBHA Year with effect of Mars and in numerology also 2025 is the year for Mars- reflect the good momentum in realty sector. Also weekly chart showing buyers at location.

Review and plan for 16th October 2024 Nifty future and banknifty future analysis and intraday plan in kannada.
Positional trading ideas included.
This video is for information/education purpose only. you are 100% responsible for any actions you take by reading/viewing this post.
please consult your financial advisor before taking a

SOBHA LTD S/R Support and Resistance Levels:
Support Levels: These are price points (green line/shade) where a downward trend may be halted due to a concentration of buying interest. Imagine them as a safety net where buyers step in, preventing further decline.
Resistance Levels: Conversely, resistance levels (re

SOBHA LTD GIVES BRAKEOUT ON DAILY CHARTNSE:SOBHA
SOBHA LTD Brake out on Daily chart .
Buy Near 2100-2150
Sl 1930
Target 2520
Time duration 1 month
Risk Reward Ratio ---- 1 : 1.68
Profit on capital Ratio ---- 17%+

See all ideas
Summarizing what the indicators are suggesting.
Neutral
SellBuy
Strong sellStrong buy
Strong sellSellNeutralBuyStrong buy
Neutral
SellBuy
Strong sellStrong buy
Strong sellSellNeutralBuyStrong buy
Neutral
SellBuy
Strong sellStrong buy
Strong sellSellNeutralBuyStrong buy
An aggregate view of professional's ratings.
Neutral
SellBuy
Strong sellStrong buy
Strong sellSellNeutralBuyStrong buy
Neutral
SellBuy
Strong sellStrong buy
Strong sellSellNeutralBuyStrong buy
Neutral
SellBuy
Strong sellStrong buy
Strong sellSellNeutralBuyStrong buy
Displays a symbol's price movements over previous years to identify recurring trends.
MOREALTY
Motilal Oswal Nifty Realty ETF Units Exchange Traded FundWeight
3.09%
Market value
685.25 K
USD
Explore more ETFs
Frequently Asked Questions
The current price of SOBHA is 1,534.60 INR — it has increased by 0.42% in the past 24 hours. Watch Sobha Limited stock price performance more closely on the chart.
Depending on the exchange, the stock ticker may vary. For instance, on NSE exchange Sobha Limited stocks are traded under the ticker SOBHA.
SOBHA stock has fallen by −2.50% compared to the previous week, the month change is a −8.56% fall, over the last year Sobha Limited has showed a −9.62% decrease.
We've gathered analysts' opinions on Sobha Limited future price: according to them, SOBHA price has a max estimate of 2,459.00 INR and a min estimate of 1,475.00 INR. Watch SOBHA chart and read a more detailed Sobha Limited stock forecast: see what analysts think of Sobha Limited and suggest that you do with its stocks.
SOBHA reached its all-time high on Jun 13, 2024 with the price of 2,161.20 INR, and its all-time low was 59.40 INR and was reached on Jan 14, 2009. View more price dynamics on SOBHA chart.
See other stocks reaching their highest and lowest prices.
See other stocks reaching their highest and lowest prices.
SOBHA stock is 2.15% volatile and has beta coefficient of 1.48. Track Sobha Limited stock price on the chart and check out the list of the most volatile stocks — is Sobha Limited there?
Today Sobha Limited has the market capitalization of 165.98 B, it has increased by 1.69% over the last week.
Yes, you can track Sobha Limited financials in yearly and quarterly reports right on TradingView.
Sobha Limited is going to release the next earnings report on Feb 6, 2026. Keep track of upcoming events with our Earnings Calendar.
Sobha Limited revenue for the last quarter amounts to 14.08 B INR, despite the estimated figure of 10.73 B INR. In the next quarter, revenue is expected to reach 13.07 B INR.
SOBHA net income for the last quarter is 725.27 M INR, while the quarter before that showed 136.18 M INR of net income which accounts for 432.58% change. Track more Sobha Limited financial stats to get the full picture.
Yes, SOBHA dividends are paid annually. The last dividend per share was 3.00 INR. As of today, Dividend Yield (TTM)% is 0.19%. Tracking Sobha Limited dividends might help you take more informed decisions.
Sobha Limited dividend yield was 0.25% in 2024, and payout ratio reached 32.34%. The year before the numbers were 0.21% and 59.51% correspondingly. See high-dividend stocks and find more opportunities for your portfolio.
As of Dec 4, 2025, the company has 28.43 K employees. See our rating of the largest employees — is Sobha Limited on this list?
EBITDA measures a company's operating performance, its growth signifies an improvement in the efficiency of a company. Sobha Limited EBITDA is 2.81 B INR, and current EBITDA margin is 8.07%. See more stats in Sobha Limited financial statements.
Like other stocks, SOBHA shares are traded on stock exchanges, e.g. Nasdaq, Nyse, Euronext, and the easiest way to buy them is through an online stock broker. To do this, you need to open an account and follow a broker's procedures, then start trading. You can trade Sobha Limited stock right from TradingView charts — choose your broker and connect to your account.
Investing in stocks requires a comprehensive research: you should carefully study all the available data, e.g. company's financials, related news, and its technical analysis. So Sobha Limited technincal analysis shows the sell today, and its 1 week rating is buy. Since market conditions are prone to changes, it's worth looking a bit further into the future — according to the 1 month rating Sobha Limited stock shows the buy signal. See more of Sobha Limited technicals for a more comprehensive analysis.
If you're still not sure, try looking for inspiration in our curated watchlists.
If you're still not sure, try looking for inspiration in our curated watchlists.