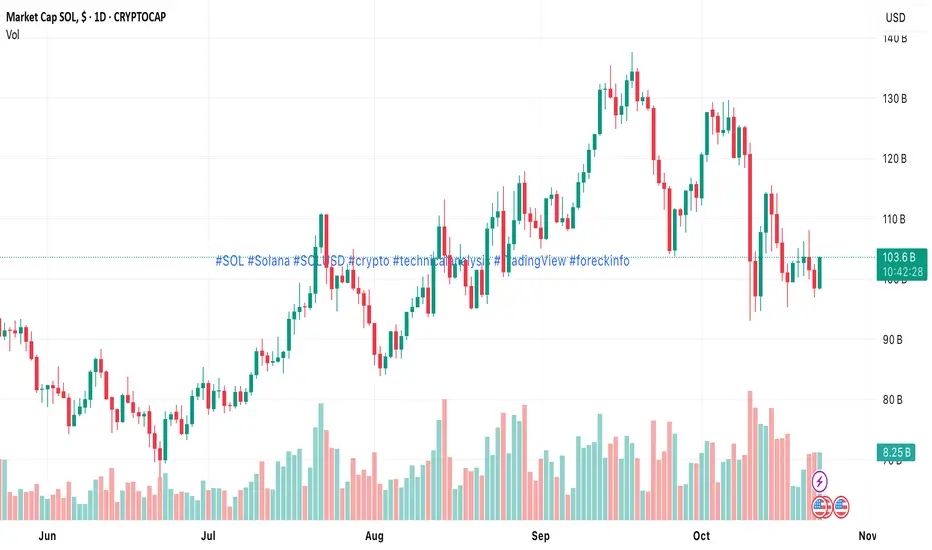
Hi, this is $SOLCould this be the next 100% pump on CRYPTOCAP:SOL ??
What we are witnessing is people selling entire portfolios at a loss.
Panic is in and it seems like it started a potential flame for a new bull rally.
Thanks for reading this very brief perspective.
Comment, Like & Share.
Trade ideas
SOL/USD — Technical Breakdown as Downtrend StrengthensSOL/USD has broken below its long-term ascending channel and has been forming a new three-month downtrend, confirming a major structural shift in market sentiment.
The pair is currently testing the 156.25 level (Murray ). A confirmed breakdown below this support would open the way toward:
• 125.00 (Murray )
• 109.38 (Murray )
For buyers, the key battleground remains the 187.50–183.80 resistance zone (Murray , 50% Fibonacci). Only a sustained breakout above the middle Bollinger Band and this resistance cluster would signal a meaningful bullish reversal and a potential move back toward:
• 218.75 (Murray )
• 250.00 (Murray )
At the moment, this bullish scenario is considered low probability.
Adding to the bearish picture:
On the weekly chart, SOL/USD is showing the formation of a double-top pattern, which points to a deeper decline toward 93.75 (Murray , W1).
⸻
Technical Indicators
• Bollinger Bands: sloping downward — trend pressure remains bearish.
• MACD: stable in the negative zone — no signs of reversal.
• Stochastic: pointing downward — momentum aligns with sellers.
Overall, indicators continue to confirm downside momentum.
⸻
Key Support & Resistance Levels
Resistance: 187.50 • 218.75 • 250.00
Support: 156.25 • 125.00 • 109.38
⸻
Trading Scenarios (Weekly)
Main Scenario — SELL STOP
• Entry: 153.00
• Take Profit: 125.00 → 109.38
• Stop Loss: 167.00
Bias: Bearish continuation below 156.25
Horizon: 5–7 days
Alternative Scenario — BUY STOP
• Entry: 189.60
• Take Profit: 218.75 → 250.00
• Stop Loss: 168.00
Bias: Bullish breakout above major resistance
⸻
SOL/USD remains under heavy pressure after breaking its long-term bullish structure. Unless buyers reclaim 187.50, the path of least resistance remains downward toward 125 and 109.38, with a weekly double-top pattern hinting at an extended decline toward 93.75.

SOL/USD — Solana Tests Key Support as Bulls Lose MomentumSolana (SOL/USD) continues to trade within a long-term ascending channel, though the pair is now hovering near the lower boundary of that structure. Market sentiment remains cautious after Fed Chair Jerome Powell’s comments on Wednesday, suggesting the central bank may keep rates unchanged in December, dampening risk appetite and limiting upside momentum. As a result, SOL/USD remains stuck near the middle Bollinger Band, unable to trigger a breakout.
The key bearish zone lies between 187.50–183.80 (Murray level , 50% Fibonacci retracement). A confirmed breakdown below this range would push the pair out of the channel, targeting 165.70 (38.2% Fib retracement) and 140.62 (Murray level , 23.6% Fib retracement).
On the upside, a rebound from the channel’s base followed by a breakout above 218.75 (Murray level ) would open the path toward 250.00 (Murray level ) and 265.62 (Murray level ).
⸻
Technical Setup
• Bollinger Bands are trending downward, indicating a potential continuation of bearish pressure.
• Stochastic Oscillator also points lower, reflecting weakening short-term momentum.
• On the weekly chart, price action is attempting to break below the middle Bollinger Band — a move that could confirm a deeper correction if sustained.
Resistance levels: 218.75 — 250.00 — 265.62
Support levels: 183.80 — 165.70 — 140.62
⸻
Trading Plan
Primary Scenario (Sell Stop)
• Entry: 183.75
• Take Profit: 165.70 / 140.62
• Stop Loss: 197.00
• Bias: Bearish below 183.80
• Timeframe: Weekly
Alternative Scenario (Buy Stop)
• Entry: 218.80
• Take Profit: 250.00 / 265.62
• Stop Loss: 200.00
• Bias: Bullish above 218.75
💬 Solana remains under pressure near the lower edge of its ascending channel. A breakdown below 183.80 would confirm bearish control, while a recovery above 218.75 could signal a return to bullish momentum.

SOL/USD — Price Tests Key Support in Long-Term UptrendSOL/USD continues to trade within a long-term ascending channel, but in the past two weeks, the pair has been testing its lower boundary, showing early signs of potential breakdown. A confirmed move below the 187.50–183.80 zone (Murray , 50.0% Fibonacci retracement) could accelerate the decline toward 165.70 (38.2% Fib) and 140.62 (Murray , 23.6% Fib).
For bulls, the key level to watch is 203.12 (Murray , 61.8% Fib) — a breakout above it would indicate renewed bullish strength, opening the path to 234.38 (Murray ), 250.00 (Murray ), and potentially 265.62 (Murray ), the upper boundary of the channel.
⸻
Technical Analysis
• Bollinger Bands: Pointing downward — confirming bearish momentum.
• MACD: Stable in the negative zone — selling pressure remains dominant.
• Stochastic: Flattening after recovery — showing a pause in momentum.
On the weekly chart, price action is attempting to break below the midline of the Bollinger Bands, which would confirm a medium-term correction phase if realized.
⸻
Trading Plan
📉 Sell Setup
• Entry: 183.75
• Targets: 165.70 → 140.62
• Stop-Loss: 197.00
• Time Horizon: 5–7 days
📈 Buy Setup (Breakout Scenario)
• Entry: 203.15
• Targets: 234.38 → 250.00 → 265.62
• Stop-Loss: 187.00
⸻
Key Levels
Support: 183.80 · 165.70 · 140.62
Resistance: 203.12 · 234.38 · 250.00 · 265.62
⸻
💬 Solana is at a critical point within its long-term uptrend. A daily close below 183.80 could confirm a deeper correction, while a breakout above 203.12 would revive bullish sentiment and signal a return toward the upper channel levels.
SOL/USD — SEC Delay and Trade Tensions Pressure SolanaSOL/USD slid lower this week after briefly rebounding to 211.30, as global and regulatory uncertainty continues to weigh on sentiment. The rally was initially driven by the CME Group’s launch of options linked to SOL and XRP futures, drawing major liquidity providers like Galaxy, Wintermute, Cumberland, DRW, and SuperState. However, renewed U.S.–China trade tensions — following China’s new export restrictions on rare earth metals and U.S. President Donald Trump’s proposed 100% import tariffs — triggered risk aversion across crypto markets.
The broader macro backdrop remains bearish, with the “Fear & Greed” index at 28, while traders await a decision from the U.S. SEC on pending spot Solana ETF applications from Fidelity, Franklin Templeton, CoinShares, Bitwise, Grayscale, Canary Capital, and VanEck. The review has been postponed due to the ongoing government shutdown, adding further uncertainty.
⸻
Technical Outlook
SOL/USD continues to trade within a long-term ascending channel, now moving toward its lower boundary.
• A confirmed break below 183.80 (Murray , 50% Fibonacci) would signal an exit from the channel and open the path to 165.70 (38.2% Fib) and 140.62 (Murray ).
• Conversely, a breakout above 218.75 (Murray ), aligned with the midline of the Bollinger Bands, could fuel a recovery toward 234.38 (Murray ) and 250.00 (Murray ).
Indicators:
• Bollinger Bands: sloping downward, confirming bearish momentum.
• MACD: expanding in the negative zone.
• Stochastic: flattening, indicating possible short-term consolidation before continuation.
⸻
Trading Setups
🔴 Short Setup
Entry: 183.70
TP1: 165.70 TP2: 140.62
SL: 197.00
🟢 Long Setup (Breakout Play)
Entry: 219.00
TP1: 234.38 TP2: 250.00
SL: 208.00
⸻
Key Levels
Support: 183.80 • 165.70 • 140.62
Resistance: 218.75 • 234.38 • 250.00
⸻
💬 Solana faces dual pressure from global trade tensions and regulatory delays. A break below 183.80 could deepen the correction toward 165.70, while a move above 218.75 would revive bullish momentum toward 250.00.

Solana Price Prediction SOL Defends $200 as DEX Volumes Beat ETHSolana (SOL) is holding $200 amid buyer defense of key trendline support, showcasing resilience as its DEX volumes surpass Ethereum's. Trading near $203 after stabilizing from $180–$185 lows, SOL benefits from surging DeFi activity, with daily DEX volume at $5.23 billion—16.3% of all blockchain activity—eclipsing Ethereum's $4.44 billion. This dominance, driven by low fees and memecoin frenzy, marks 10 consecutive months of Solana leading, with $124 billion in July trades 42% higher than ETH. On-chain metrics show TVL up 27.3% monthly and 83% YTD developer growth to $15.3 billion, signaling ecosystem strength. This article analyzes SOL's price action, DEX lead, and forecast. Position for SOL's potential rebound.
SOL's Trendline Defense and DEX Supremacy
SOL's buyers are defending the ascending trendline at $180–$185, rebounding to $200.55 after a dip to $178, with RSI at 58 signaling bullish momentum. The daily chart shows a falling wedge breakout potential, with MACD crossover (+0.12) targeting $215–$220 short-term. Fibonacci support at $170 holds, resistance at $205–$210. DEX volumes flipped Ethereum again, with Raydium capturing 49.2% share and $333 billion Q1 volume, fueled by Pump.fun (34.5% Q4 share).
On-chain: 33 million to 44 million daily transactions and 72 million to 106 million active users reflect DeFi revival, with liquid staking +$2.1B, lending +$440M, and DEX +$985M since September. Memecoin share fell to under 30%, stablecoins at 58%, indicating maturation. Sentiment is 71% bullish, correlating 0.7 with ETH, but $200 tests as support—break below risks $170, above signals $230.
Price Prediction: $200 Hold or $400 Surge?
Short-term: SOL could reclaim $215–$220 if $200 holds, with ETF speculation (90% approval odds) adding fuel. Analysts forecast $400 max by 2025, or $201 by mid-October, driven by ecosystem growth. Bull case: DeFi snowball effect pushes $500, bear case: $180 retest on delays. TVL and developer surge support $200 as floor.
Trading Signals: RSI and MACD
Based on recent trends:
SOL ($203): RSI at 58 (bullish). Bullish MACD (+0.12)—target $220 (8% upside). Fibonacci support at $180, resistance at $205.
ETH ($4,500): RSI at 58. Bullish MACD (+0.12)—target $5,200 (15% upside). Support at $4,200, resistance at $4,760.
Overall: RSI 58 signals longs at supports for 8–15% gains. Risks: delays (5–7% dip); hedge with USDC.
Conclusion: SOL's DEX Lead Signals Strength
SOL defending $200 as DEX volumes beat Ethereum underscores DeFi dominance, with RSI 58 and bullish MACD targeting $220. Buy the dip for ecosystem-driven upside—watch TVL for confirmation.
What’s your SOL target? Comment below!
#SolanaPrice #SOLPrediction #DEXVolume #Solana #TradingSignals
SOL/USD — Solana Consolidates in Sideways Range Before Next MoveThe SOL/USD pair continues to trade within a long-term upward channel, but since the start of October, momentum has slowed, pushing price action into a sideways range between 234.38 and 218.75 (Murray – ). The market has failed to break out of this corridor so far.
A break above 234.38 would confirm bullish continuation toward 250.00, 265.62 (Murray , upper channel boundary), and 281.25 (Murray ). Conversely, a drop below 218.75 — the midline of the Bollinger Bands — could trigger a deeper pullback to 183.80 (50% Fibonacci retracement) and potentially push SOL out of its current range.
⸻
Technical View
Indicators remain mixed:
• Bollinger Bands are flat, reflecting consolidation.
• The MACD histogram has turned positive, signaling fading bearish pressure.
• Stochastic is turning lower from the overbought zone, hinting at short-term cooling.
On the weekly chart, however, the broader bullish trend remains intact, confirming that Solana is still positioned within its long-term uptrend channel.
⸻
Support and Resistance Levels
• Resistance: 234.38, 250.00, 265.62, 281.25
• Support: 218.75, 183.80
⸻
Trading Scenarios
Bullish Scenario:
Long positions may be considered above 234.38, with targets at 250.00, 265.62, and 281.25, and a stop-loss at 223.00.
Implementation horizon: 5–7 days.
Bearish Scenario:
Short positions could be opened below 218.75, with a target at 183.80 and a stop-loss at 237.00.
⸻
Outlook:
Solana remains in a consolidation phase within its ascending structure. A breakout above 234.38 could signal the start of a new bullish impulse, while failure to hold 218.75 would open the door for a deeper retracement toward 183.80.
SOL/USD — Solana Consolidates Before Potential BreakoutAfter forming a local top in September within the red resistance box and printing a clear M-pattern, Solana (SOL) experienced a strong pullback. The price briefly dropped below both the 50-day EMA and the psychological $200 level. However, buyers quickly stepped in, pushing SOL back above the 50 EMA — a key signal that the token has reentered its broader bullish trend.
Currently, SOL is consolidating tightly between $225–$235. The heatmap reveals liquidity building just below this range — a short dip could sweep that area before continuation higher. Above the current price, liquidity clusters are even denser, suggesting that once momentum returns, Solana could accelerate to test upper resistance zones.
⸻
Momentum and Indicators
The MACD continues to show bullish momentum, while the RSI holds steady above the 50 line — both confirming an intact bullish structure. As long as SOL trades above the 50 EMA, the broader setup remains positive. A brief dip would likely act as a healthy correction within trend, offering fresh long opportunities.
⸻
4H Chart Structure
On the 4-hour chart, Solana maintains strong technical posture. Liquidation maps show a neutral delta, meaning long and short positions are balanced. The MACD stays flat but constructive, with no visible bearish divergence. The RSI remains above 50, reflecting ongoing buying pressure.
The 50 EMA acts as dynamic trend support, guiding price upward. Structurally, an ascending triangle is forming — a classically bullish continuation pattern. A breakout above the upper trendline would likely trigger a move toward the red resistance box near the recent high.
If Bitcoin enters a correction phase and drags the market lower, traders should watch the green support zone closely for potential rebounds.
⸻
Outlook
Overall, Solana’s technical setup remains strong. The combination of a rising EMA structure, constructive momentum indicators, and the ascending triangle formation all point toward a potential continuation of the uptrend.
The key catalyst remains Bitcoin’s strength — as long as BTC holds, SOL could soon resume its rally toward new highs.
SOL/USD — Bulls Eye $250 as Uptrend Channel HoldsSOL/USD is holding within a long-term ascending channel. After dipping to 190.95 (5-week low), the price rebounded and is now testing the mid-Bollinger line at 224.70. A breakout here could open the path to 250.00 and 265.62 (channel top).
If price consolidates below 203.12 (Murray , Fib 61.8%), downside risks extend to 183.80 and 171.88, potentially breaking the range.
Technical Indicators
• 📊 Bollinger Bands: pointing downward, limiting upside.
• 📉 MACD: histogram near flip into positive.
• 🔄 Stochastic: turning down from overbought.
Weekly chart still confirms the dominant bullish trend.
Key Levels
• Resistance: 224.70, 250.00, 265.62
• Support: 203.12, 183.80, 171.88
Trading Plan
📈 Long above 224.70 → Targets: 250.00 / 265.62, SL 209.30
📉 Alternative: Long on pullback from 203.12 → Targets: 250.00 / 265.62, SL 190.00

SOL/USD – Testing Key Support, Bulls Need 227.50 BreakSolana (SOL/USD) remains within a long-term uptrend channel, but after testing the upper boundary near 250.00 last week, the pair failed to hold gains and entered a correction. Price is now close to the 203.12 Murray / 61.8% Fib support zone.
• Break below 203.12 → opens downside to 183.80 / 171.88
• Break above 227.50 (mid Bollinger band) → resumes bullish move toward 250.00 / 265.62
Fed’s rate cut and Ripple ETF launch fueled the last spike, but uncertainty remains as technicals send mixed signals.
⸻
🔎 Technical Setup
• Resistance: 227.50, 250.00, 265.62
• Support: 203.12, 183.80, 171.88
• Indicators:
• Bollinger Bands turning upward
• MACD close to negative zone
• Stochastic rebounding from oversold
Weekly chart trend remains bullish, limiting deeper correction to the 183.80 area.
⸻
🎯 Trading Scenarios
Base Scenario (Sell)
• ⏱ Timeframe: Weekly
• Entry: 202.74
• TP: 183.80, 171.88
• SL: 216.80
Alternative Scenario (Buy Stop)
• Entry: 227.55
• TP: 250.00, 265.62
• SL: 212.00
⸻
📌 Key Levels
171.88 – 183.80 – 203.12 – 227.50 – 250.00 – 265.62

SOL/USD: Q4 Outlook – ETF Approval, Firedancer, and InstitutionaSolana has reclaimed momentum after a volatile summer. Institutional flows, ETF anticipation, and core upgrades (Firedancer, Alpenglow) now set the stage for a potential parabolic rally into year-end.
• Institutional Treasury Flows: Forward Industries plans a $4B raise to accumulate SOL, supported by Galaxy Digital, Jump Crypto, and Multicoin. Current holdings: 6.8M SOL ($1.6B).
• ETF Catalyst: Fidelity, VanEck, and Grayscale filings are live with DTCC. Prediction markets assign a 99% probability of approval by October. Ethereum’s ETF precedent suggests delayed but massive inflows.
• Tech Upgrades:
• Firedancer (Jump Crypto): New validator client, early tests ~600,000 TPS.
• Alpenglow: Reworks consensus, near real-time finality by year-end.
• On-chain Growth:
• TVL at record $12B (DeFiLlama) – 2nd only to Ethereum.
• Messari data: Solana dApps generate >2x revenue vs. fees paid.
• Expanding into DePIN & RWAs: Hivemapper (12M km mapped), Helium (5G rollout w/ AT&T), $600M+ tokenized assets (BlackRock, Apollo).
• Consumer Adoption: Solana Mobile’s “Seeker” hit 150K preorders in 50+ countries.
Macro backdrop supports risk assets: Fed signals two more cuts in 2025, boosting liquidity.
⸻
🔎 Technical View
• Current price: $250–260 range.
• Structure: Bullish “cup-and-handle” (Ali Martinez) projects upside > $1,300 (~5x current levels).
• Key resistance zones: $310 / $365 / $435 / $500. Break above $500 unlocks long-term extension targets.
• Supports: $245 / $217 / $189. Holding $245–250 keeps bullish momentum intact.
⸻
🎯 Bullish Targets
• $310 → $365 → $435
• $500 (psychological breakout)
• Extension: $1,000 → $1,300 (measured move from technical pattern)
⚠️ Bearish Risk Levels
• Breakdown below $245 → retest $217, then $189.
• Loss of $189 = invalidation of bullish thesis.
OrionChain 24: Galaxy Digital and $536M in SolanaIn the fast-paced crypto market of September 2025, institutional moves are reshaping narratives, with Galaxy Digital's aggressive Solana accumulation signaling a "Solana season." The firm acquired 2.31 million SOL tokens worth nearly $536 million over the past 24 hours, transferred from major exchanges. This follows Galaxy's leadership in a $1.65 billion private placement for Forward Industries, transitioning to a Solana-focused digital asset treasury. SOL surged to $237.90, entering the top 5 cryptos with a $126.4 billion market cap, surpassing BNB. From OrionChain 24, a leading analytics platform specializing in whale tracking and AI signals, we overview the purchase, SOL levels ($200–$400), and whale signals via MACD and RSI. Data as of September 16, 2025—position for continued momentum.
OrionChain 24 equips traders with real-time whale alerts; sign up for our demo to track these flows.
Galaxy Digital's $536M SOL Purchase: Strategic Bet on Solana
Galaxy Digital scooped up 2.31 million SOL (~$536 million) in a 24-hour spree, fueling speculation of deeper ties to Forward Industries' Solana treasury pivot. This aligns with a broader trend: Solana's speed (58M monthly users, $15.3B TVL) and potential spot ETFs (90% approval odds by late 2025) drive adoption.
On-chain: Transfers to Galaxy wallets, with Forward's shares up 135% in five days. OrionChain AI detects 71% bullish sentiment: whale inflows +15%, positioning SOL for 20–30% Q4 upside amid ETF hype.
SOL Levels: $200–$400 Range in 2025
SOL at $237.90 (up 19% weekly) broke $220 for the first time in eight months, liquidating $17M in shorts. Base range: $200 support (50% Fibonacci from April trend) to $400 resistance (161.8% extension), with $300 midpoint on ETF approvals.
Support ($200–$220): 20-day EMA alignment; hold here signals rebound to $250.
Resistance ($300–$400): 52-week high projection; breakout above $240 targets $350 on institutional flows.
OrionChain forecasts: $200 floor (risk-off), $400 ceiling (Solana season full steam), correlating 0.8 with BTC.
Whale Signals: MACD and RSI from OrionChain 24
OrionChain tracks whale activity in SOL, using MACD for momentum and RSI for overbought/oversold, based on the August rally.
MACD: Bullish crossover (histogram +0.18), line above signal—whale buys accelerating; entry on pullbacks for 10–15% to $260. Galaxy's $536M adds conviction, with volume spikes +25%.
RSI (14-day): 62 (strong bullish, not overbought <70); divergence from price lows signals $250 near-term. Whale metric: Accumulation score 75/100, inflows $700M+ in 48 hours.
Signals: Long SOL above $240 (RSI >60), stop at $220; target $300 on MACD expansion. Risks: ETF delays (5–7% dip); hedge with USDC.
Conclusion: Ride the Solana Wave with OrionChain 24
Galaxy Digital's $536M SOL buy cements institutional faith, propelling SOL toward $200–$400 with MACD/RSI flashing bullish. OrionChain's whale signals guide your trades in this season of Solana.
Ready to accumulate? Join OrionChain 24 for alerts and demo access. What's your SOL target? Comment below!
#Solana #GalaxyDigital #SOL #WhaleSignals #OrionChain24

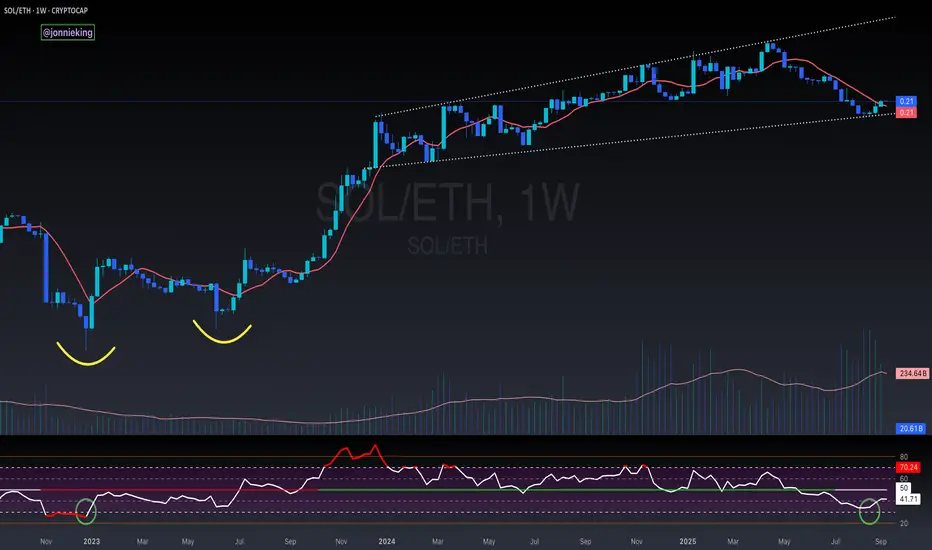
$SOL / $ETH REVERSAL * ALT SEASON *🚨 The CRYPTOCAP:SOL / CRYPTOCAP:ETH REVERSAL has officially been confirmed.
✅ 3 White Solders
✅ Weekly close above 9WMA
✅ Broadening Wedge
Money is moving down risk, which brings outsized returns.
BitChatCoin: Revolutionizing Privacy Your Key to a Free FutureForget a world where your messages are scanned by algorithms and your personal data becomes corporate prey. Imagine instead a world where your words are a secret whisper, reaching only those you trust. A world where communication is invulnerable, free from censorship, and belongs solely to you. This is not a utopia, but a reality being built by BitChatCoin (BITCHAT TOKEN) – the utility token of the revolutionary Bitchat Messenger, the world’s first Bluetooth-based messenger delivering decentralized, ultra-private communication. Built on the lightning-fast Solana blockchain, BitChatCoin is your key to an ecosystem where privacy, freedom, and financial gain converge into a powerful stream of opportunities.
Bitchat Messenger: Connection That Knows No Boundaries
Bitchat Messenger is not just an app; it’s a breakthrough. Forget about servers storing your chats or the risks of leaks. Thanks to Bluetooth technology, devices connect directly, creating a network resilient to hackers, internet outages, and any form of censorship. Your messages remain yours alone – no trace in the cloud, no chance of interception. BitChatCoin fuels this ecosystem: it unlocks premium features, enables instant P2P payments on Solana, and rewards activity, whether through staking or contributing to the community.
This isn’t just a messenger – it’s a manifesto of digital freedom. Funds from token sales are invested in enhancing Bluetooth technologies, launching payment systems, asset transfers, and creating premium privacy tools. Early investors gain unique privileges: enhanced rewards, exclusive access to features, and a chance to be part of an ecosystem where privacy turns into capital.
Tokenomics: Sparks of Genius in the Fire of Deflation
BitChatCoin is not just a token; it’s a meticulously crafted mechanism designed for growth and sustainability. The total supply is 1.5 billion BICHAT tokens, distributed with surgical precision:
10% – private sale for strategic partners laying the foundation;
30% – burned to fuel deflation and increase token value;
20% – public sale for the community;
28% – staking rewards to incentivize long-term holders;
7% – partnership funds for global scaling;
5% – team pool, reserved with a vesting period;
27% – product development, from messenger to metaverse;
39% – marketing, merchant onboarding, and strategic alliances;
12% – operational expenses for seamless functionality;
6% – legal support for global compliance.
The burning of 30% of tokens and a focus on staking create a deflationary model, poised to propel BICHAT’s price into orbit like a rocket.
Roadmap: The Path to a Digital Eden
BitChatCoin is not a spontaneous idea but a strategic journey mapped out by quarters. In Q1 2025, the token was launched, laying the groundwork for innovation. Q2 was dedicated to technology development, Q3 to creating a business model where users are the true owners of the platform, and Q4 to legal validation for global reach. In Q1 2026, blockchain integration, smart contract deployment, and key messenger features will kick off. The ultimate goal? To build a metaverse where art, culture, and communication thrive in a decentralized, private environment – an oasis of freedom in the desert of digital control.
Act Now: Seize the Future with BitChatCoin!
You stand at the threshold of a historic opportunity. The token sale is in full swing – from August 15 to September 28, priced at 0.001 BICHAT per 1 SOL, with a minimum entry of just 1 SOL. With a soft cap of $5 million and a hard cap of $55 million, this window of opportunity will close in mere weeks!
You can purchase BitChatCoin right now through the liquidity pool on Raydium: Create your position here and join the revolution . The Raydium link is verified and active, ensuring secure and instant access to token purchases. You can also visit the official BitChatCoin website for more details – the link is confirmed and clickable.
Don’t wait for others to claim your slice of the pie. BitChatCoin is not just an investment; it’s your pass to a world where privacy is power, and power is profit. Head to the official website or directly to the Raydium pool, buy BICHAT, and become a pioneer of the new era of communication. Your portfolio could soar like a rocket, and you could join the elite shaping the future. Act now, or regret it forever!
SOL/USD — Market Awaits Fed Clarity, Bulls Hold Key Support
Current Setup
SOL corrected from yearly highs at 209.80 but remains within a mid-term uptrend. The token holds above the critical support zone 200.00–202.40 (Murray , Fib 61.8%), keeping the bullish case alive.
On-chain and ecosystem activity remain supportive: Solana hit a record 107,540 TPS, while Pump.fun captured 73% of the meme coin market with weekly revenue of $13.48M. Broader crypto sentiment, however, is under pressure as markets await Fed Chair Powell’s speech at Jackson Hole.
Key Levels
• Resistance: 202.40 / 225.00 / 250.00
• Support: 175.00 / 150.00 / 125.00
Trading Scenarios
Primary Scenario
• Recommendation: BUY STOP
• Entry: 209.00
• Take Profit: 225.00, 250.00
• Stop Loss: 200.00
• Timeframe: 5–7 days
Alternative Scenario
• Recommendation: SELL STOP
• Entry: 173.00
• Take Profit: 150.00, 125.00
• Stop Loss: 190.00
• Timeframe: 5–7 days
⸻

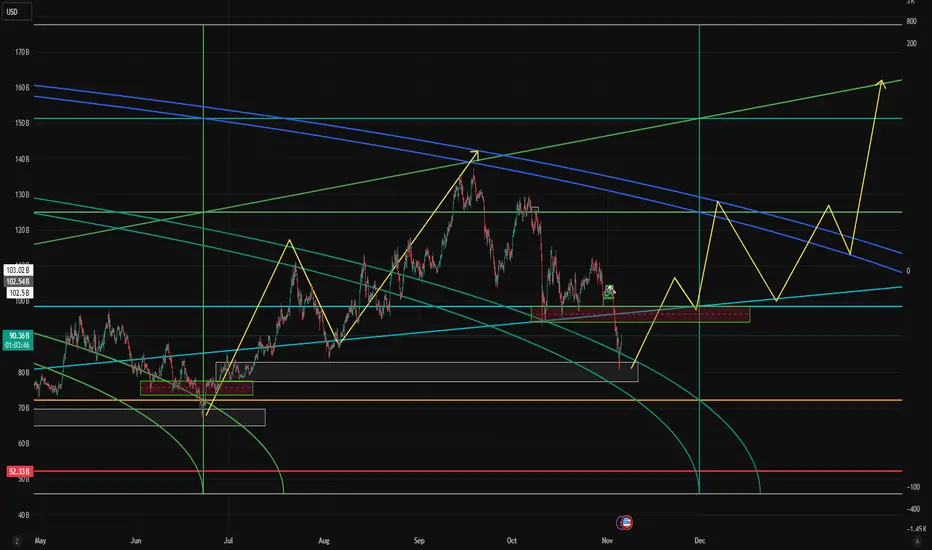
Market Cap SOL, $ - Quote | Chart & Forecast SummaryKey Indicators On Trade Set Up In General
1. Push Set Up
2. Range Set Up
3. Break & Retest Set Up
Notes On Session
# Market Cap SOL, $ - Quote
- Double Formation
* (A+)) - *Crossing | Subdivision 1
* (EMA Settings)) - *100
- Lower Band Feature | Completed Survey
* 201 bars, 1,407d | Date Range Method - *(Uptrend Argument))
- Triple Formation
* (P1)) / (P2)) & (P3)) | Subdivision 2
* Weekly Time Frame | Trend Settings Condition | Subdivision 3
- (Hypothesis On Entry Bias)) | Logarithmic Settings
* Stop Loss Feature Varies Regarding To Main Entry And Can Occur Unevenly
- Position On A 1.5RR
* Stop Loss At 60B | USD
* Entry At 90B | USD
* Take Profit At 132B | USD
* (Uptrend Argument)) & No Pattern Confirmation
- Continuation Pattern | Not Valid
- Reversal Pattern | Not Valid
* Ongoing Entry & (Neutral Area))
Active Sessions On Relevant Range & Elemented Probabilities;
European-Session(Upwards) - East Coast-Session(Downwards) - Asian-Session(Ranging)
Conclusion | Trade Plan Execution & Risk Management On Demand;
Overall Consensus | Buy

5 Crypto Investment Firms Investing in these altcoins Expect coins backed by real utility, visible treasuries, and regulated investment products to capture the bulk of the next wave.
Read More: www.cointrust.com

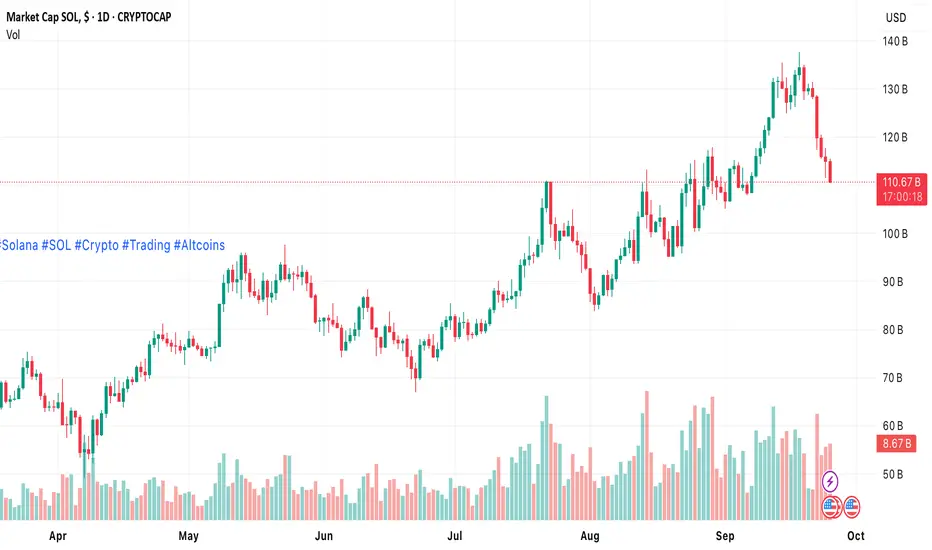
SOLANA MARKETCAP LOOKS COOKEDIs that a Head and Shoulder's top?
Is #crypto about to endure a Iron dome penetration event?

W$J Meme Index – Live Market Cap Tracker for DegensThe W$J Meme Index is a market-cap–weighted chart of the top 14 meme coins in circulation. Built by degenerates, for degenerates. This is your daily source of truth when the timeline is pure hopium.
No fluff. No TA wizardry. Just raw, unfiltered meme market data for the financially unwell.
Coins included: DOGE, SHIB, PEPE, WIF, BONK, FLOKI, BOME, MEME, MYRO, TOSHI, SPX6900, MOG, GIGA, POPCAT.
Tag it. Trade it. Cry with it.

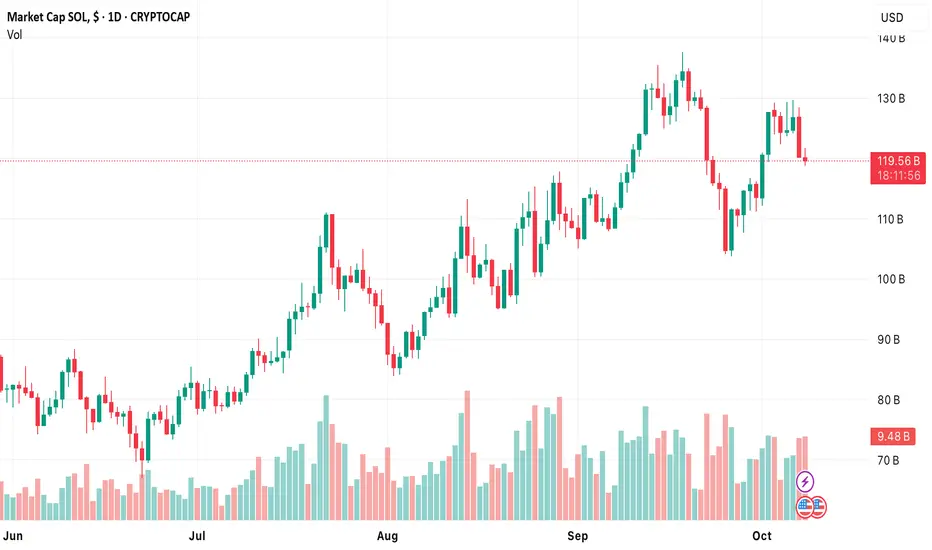
"SOL Market Cap Breakdown Setup| Bearish Retest Targeting 83.3B"SOL Market Cap is showing signs of a potential breakdown after a series of lower highs and a bearish retest of previous support. Price is currently retesting the breakdown level. If confirmed, the next support zone is near 83.3B.
This is a technical analysis-based observation, not financial advice. Always manage risk and confirm with your own strategy before making any decisions.

$SOL / $BTC Inverse Head and Shoulders BREAKOUT!!CRYPTOCAP:SOL / CRYPTOCAP:BTC Inverse Head and Shoulders reversal pattern confirmed 🥳
PA has also reclaimed the 50DMA
Bullish Divergence on RSI
So many signs indicators aligning across the market.
IS IT REALLY TIME !!?!?

SOL Market Cap – Bearish Rejection Expected from Resistance ZoneSolana's market cap is approaching a **major resistance zone** near $77.8B, aligning with an ascending trendline. The market is showing signs of exhaustion as price nears this confluence of **horizontal and trendline resistance**.
A bearish reaction is expected from this zone, potentially forming a **lower high** and offering a short opportunity toward the demand zone around $69.6B.
🔻 **Bearish Setup Highlights:
- Resistance Zone: $75.5B – $77.8B
- Entry Idea: On bearish rejection or confirmation near resistance
- Target: $69.6B support zone
- Stop Loss: Above $77.8B (invalidate setup)
A clean retest and rejection can offer a **high-probability short**, with the risk/reward skewed favorably.

$SOL ?!Here we have CRYPTOCAP:SOL America’s top pick over CRYPTOCAP:ETH .
I smell a bullish reversal and it seems like this time could be a lot different maybe because of volume and volatility… who knows ?
