#SOLANA Breakout Now This idea is for those who own solana coin
This is not advice to buy. The currency has great negative news, so it may affect the price in the future and change everything
Please support the idea by pressing the like button and writing your opinion in the comment box
Good luck 🌹
Trade ideas

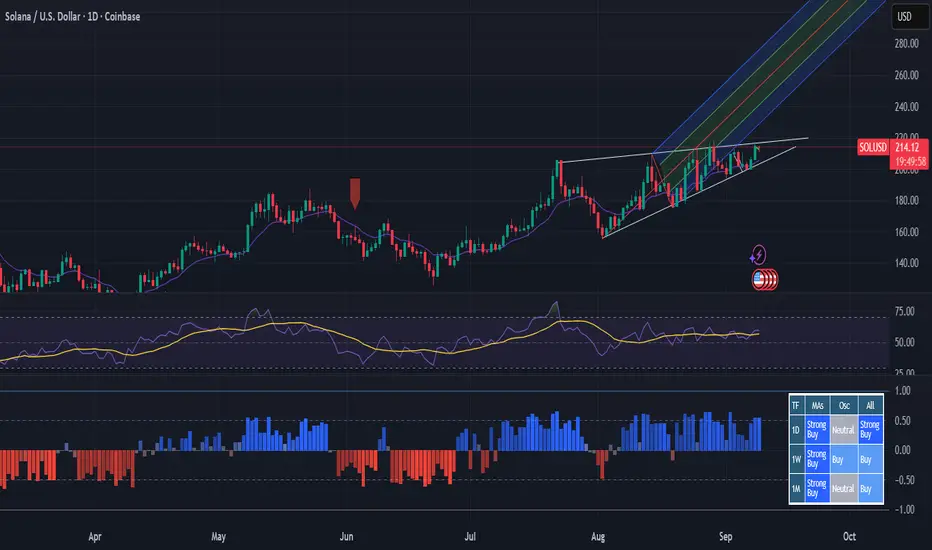
Price is moving within an ascending channel (the rainbow-coloredCurrent Price: $214.14
Trend Direction: COINBASE:SOLUSD
Strong uptrend since mid-July, with a consistent pattern of higher highs and higher lows.
Price is moving within an ascending channel (the rainbow-colored lines on your chart).
This shows healthy bullish structure on a larger timeframe.
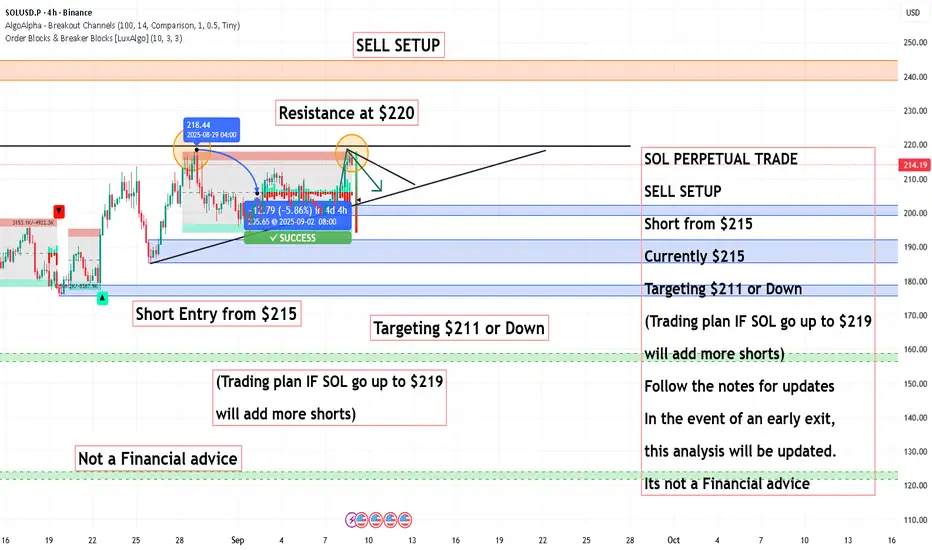
SOL PERPETUAL TRADE SELL SETUP Short from $215SOL PERPETUAL TRADE
SELL SETUP
Short from $215
Currently $215
Targeting $211 or Down
(Trading plan IF SOL go up to $219
will add more shorts)
Follow the notes for updates
In the event of an early exit,
this analysis will be updated.
Its not a Financial advice
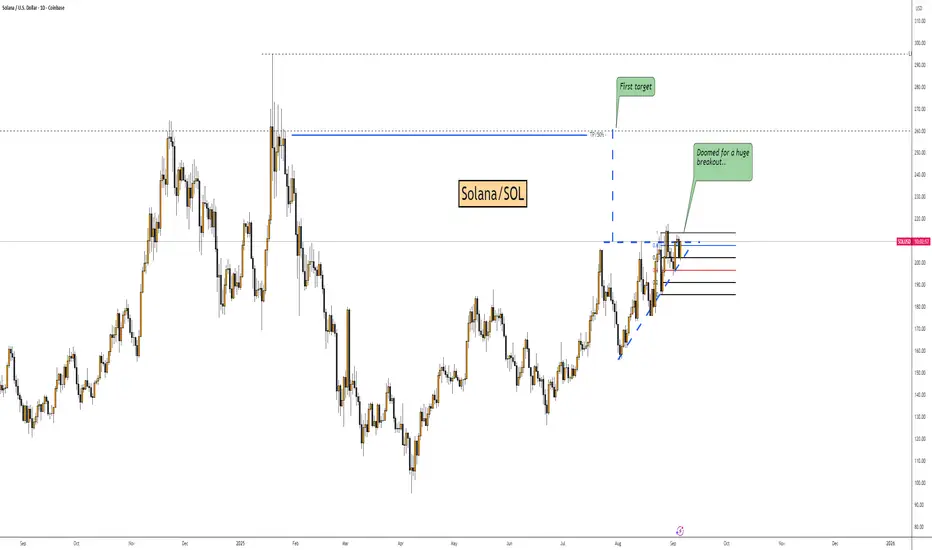
Solana - The future is clear!🎯Solana ( CRYPTO:SOLUSD ) breaks out soon:
🔎Analysis summary:
Solana is currently trading at the exact same level as it was about four years ago. In the meantime we witnessed crazy corrections and parabolic rallies, leading to another all time high retest. Quite likely therefore that Solana will break the previous all time high in the near future.
📝Levels to watch:
$250
SwingTraderPhil
SwingTrading.Simplified. | Investing.Simplified. | #LONGTERMVISION

Solana is Bullish with 2 other coinsThe price action shows a clear breakout from a symmetric triangle. If this momentum continues, the price of Solana could turn the resistance of $220 into a local support level and then benefit from the post-rate-cut bullish rally.
Read More:
www.cointrust.com

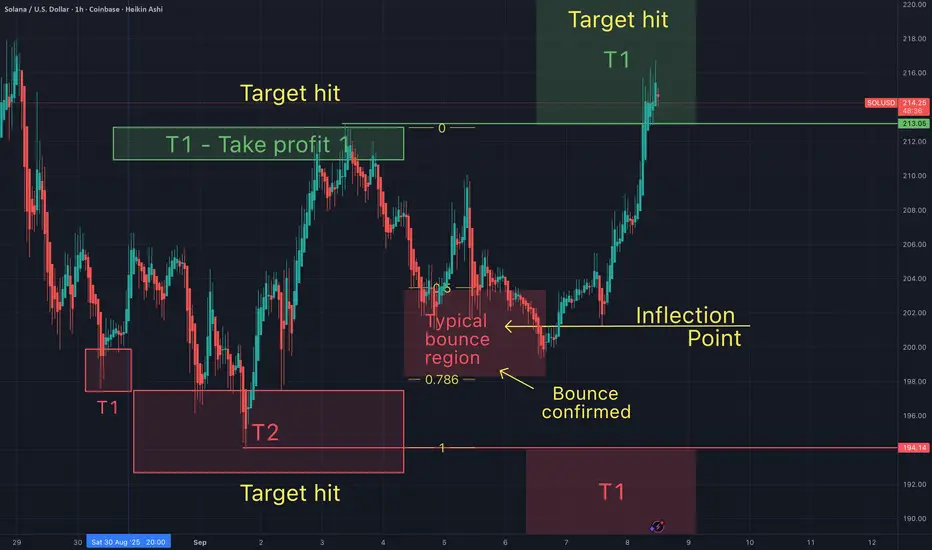
You will ask yourself how did he know Sol would bounce & hit T1?In my previous chart I suggested that Sol was approaching an inflection point, in a typical bounce region. That anticipated bounce would lead Sol to climb up to T1 above the preivous local high. That has now been confirmed.
What do you think Sol will do from here? I 'd ike to here your thoughts?
Solana's Price Coils in Rare Bullish FormationSolana's Price Coils in Rare Bullish Formation, Hinting at a Potential Rally to $230
Solana (SOL) has captured the attention of the cryptocurrency market, with its price charting a course that suggests a significant upward movement may be on the horizon. After a robust gain over the past month and a powerful rebound from its recent lows, the high-performance blockchain's native token is trading within a classic technical pattern known as a symmetrical triangle. A decisive breakout from this formation could propel SOL towards a price target of $230 in the coming days, a move supported by strengthening on-chain metrics, resurgent NFT market activity, and bullish sentiment in the derivatives market.
The digital asset has shown considerable strength, rallying to intraday highs well above the $200 mark before stabilizing. This price point not only marks a significant recovery but also positions SOL tantalizingly close to the upper boundary of its consolidation pattern. This technical setup, combined with strong fundamental tailwinds, is creating a compelling narrative for a potential bullish continuation.
The Anatomy of a Bullish Setup: The Symmetrical Triangle
At the heart of the current bullish thesis for Solana is the formation of a symmetrical triangle on its price chart, a pattern that has been developing over recent weeks. In technical analysis, a symmetrical triangle is characterized by two converging trendlines—one descending line connecting a series of lower highs and one ascending line connecting a series of higher lows. This pattern visually represents a period of consolidation and indecision in the market, where the trading range tightens and volatility contracts. It signifies a temporary equilibrium between buyers and sellers, often preceding a significant price move or "breakout."
While a symmetrical triangle is technically a continuation pattern—suggesting the price will likely resume the trend it was in prior to the triangle's formation—it can break in either direction. However, for Solana, which has been in a broader uptrend, a breakout to the upside is the more anticipated outcome. Analysts are closely watching for a decisive close above the triangle's upper trendline, ideally accompanied by a spike in trading volume, which would serve as confirmation of the breakout.
Multiple analyses converge on a significant price target should this breakout occur. The height of the triangle at its widest point, projected upward from the breakout point, suggests a potential rally that could take SOL to the $230 mark. Other technical strategists have identified targets in a similar range, with some pointing to the $230-$235 area and others looking at a near-term pivot range that could open the path toward higher targets.
Strengthening this possibility are key momentum indicators. The Moving Average Convergence Divergence (MACD), a popular trend-following indicator, has shown its primary line crossing above its signal line, a classic sign of a strengthening uptrend and building bullish momentum.
The Road to Recovery: A Powerful Rebound Ignites Momentum
Solana's current consolidation does not exist in a vacuum. It follows a period of impressive recovery that has renewed investor confidence. After dipping to a notable low in the preceding month, SOL has mounted a formidable comeback of over 30%. This rebound demonstrates strong buying pressure at lower price levels and has established a solid foundation for the current market structure.
Over the past month alone, SOL has registered a double-digit percentage increase in value, a period during which the symmetrical triangle began to take shape. This price action suggests that the recent consolidation is a healthy pause, allowing the market to digest recent gains before a potential next leg up. The series of higher lows established since late August is particularly constructive, indicating that buyers remain active and are stepping in to defend key support levels.
The cryptocurrency is currently consolidating above a critical support level in the high $190s. This price zone is considered highly significant by on-chain analysts, as a massive volume of tokens has historically been traded at this level, creating a strong foundation of support that bulls are actively defending.
Beyond the Charts: Fundamental Tailwinds Gathering Strength
While the technical picture is compelling, a confluence of fundamental factors is adding significant weight to the bullish case for Solana.
The NFT Ecosystem Reawakens
A notable catalyst has been a sharp resurgence in activity within Solana's non-fungible token (NFT) ecosystem. In a recent notable 24-hour window, sales volume for Solana-based NFTs experienced a dramatic spike, more than doubling from the previous day's figures and reaching well into the millions of dollars. This surge propelled Solana to become the second-largest NFT market globally by daily sales volume, trailing only Ethereum.
This spike was largely driven by the explosive popularity of certain new collections, which saw their daily sales volumes skyrocket by orders of magnitude. Other collections also posted significant gains. While the broader NFT market has seen fluctuations, Solana's performance showcases a notable relative strength and a growing appeal for its high-speed, low-cost architecture among NFT creators and collectors. This renewed retail and speculative interest in Solana's NFT scene could be a powerful driver of market momentum.
Bullish Bets in the Derivatives Market
Sentiment among professional traders, especially in the derivatives market, has shifted decisively toward a bullish outlook. Open interest in SOL futures, which represents the total value of all outstanding futures contracts, has seen a substantial increase over the past month, climbing by several billion dollars. This indicates a high degree of speculative interest and suggests a growing number of traders are positioning for a future price increase.
Furthermore, SOL's weighted funding rate has remained consistently positive for an extended period. The funding rate is a mechanism used by perpetual futures exchanges to keep the contract price in line with the spot price. A positive funding rate indicates that traders holding long positions are paying a premium to those holding short positions, a clear sign that the prevailing sentiment is bullish and traders expect the price to continue rising.
The Institutional Stamp of Approval
A steady drumbeat of institutional adoption continues to provide a strong fundamental floor for Solana's valuation. The launch and subsequent inflows into Solana-focused Exchange-Traded Funds (ETFs) in North America have signaled growing confidence from traditional finance. These products have seen millions of dollars in inflows on strong trading days.
This trend extends to corporate treasuries. The listing of Solana-focused companies on major stock exchanges, holding significant amounts of SOL tokens, brings considerable Wall Street exposure to the asset. This institutional demand, coupled with whale accumulation, where large holders have been observed adding to their positions, provides a powerful source of buying pressure.
The Alpenglow Upgrade
Adding to the long-term bullish case is the anticipated Alpenglow network upgrade. Approved by an overwhelming majority of validators, this upgrade is set to slash transaction finality times significantly, bringing them down to a fraction of a second. This enhancement would provide Solana with Web2-level settlement speeds, dramatically increasing its competitiveness in high-frequency applications like decentralized finance (DeFi) and gaming, and potentially driving a new wave of developer and user adoption.
Navigating the Hurdles: Resistance and Risks on the Horizon
Despite the overwhelmingly bullish confluence of factors, investors should remain aware of the potential risks and key resistance levels that lie ahead. The symmetrical triangle, until a breakout is confirmed, remains a pattern of indecision. A break below the lower support trendline could invalidate the bullish thesis and trigger a move to the downside, with potential targets at lower support levels.
Even with an upward breakout, the path to $230 is not without obstacles. Solana faces immediate resistance in the zone just above its current trading range, an area that has been tested multiple times. A more significant band of resistance is anticipated in the range between $210 and $250, where sellers may look to take profits.
Furthermore, some on-chain metrics suggest that while momentum is building, some long-term holders may be taking the opportunity to distribute their holdings, which could create selling pressure. The broader cryptocurrency market remains subject to volatility, and a downturn in major assets like Bitcoin or Ethereum could negatively impact altcoins like Solana, regardless of their individual technical and fundamental strength.
Conclusion
Solana currently presents one of the most compelling risk-reward setups in the cryptocurrency market. The formation of a rare symmetrical triangle on its price chart, following a powerful rebound, has laid the technical groundwork for a potential rally toward $230. This bullish structure is not merely a product of chart patterns; it is underpinned by a potent combination of fundamental drivers. A re-energized NFT ecosystem, overwhelmingly positive sentiment in the derivatives market, growing institutional adoption, and a landmark network upgrade on the horizon all contribute to a powerful narrative of growth and expansion.
While traders and investors must remain vigilant of key resistance levels and the inherent risks of the crypto market, the evidence suggests that Solana is coiling for a potentially explosive move. A confirmed breakout in the coming days could validate the bullish setup and send SOL on the next major leg of its upward journey, solidifying its position as a leading blockchain platform for the future of decentralized applications.

Ascending triangle - Solana momentum building Solana is on the rise again, forming an ascending triangle and a golden cross. This could be a good opportunity to accumulate before the next big push upwards. Furthermore, XRP, ETH, and BTC have all surged higher, but Solana has remained relatively stable along its trend line. It’s only a matter of time before Solana reaches a new all-time high, and with increased industrial accumulation, it is very likely to be the next altcoin to push higher. This is not financial advice. The technical indicators also support this, as increased trading volume and strong support above 190 indicate that Solana has proven to be resilient and is on an upward trajectory. Additionally, the Sol/BT and Sol/ETH ratios are now in favor of Solana, suggesting that capital is rotating into Solana.

SOL.usd eyes on $216: Double Golden fibs may cause Dip or TopSOL has been coming up nicely after a correction.
Approaching a Double Golden zone $216.14-216.68
Look for a Dip-to-Fib or Break-n-Retest to go long.
.
See "Related Publications" for other PRECISE cyrpto plots ----->>>>>>
.

SOLANA HIGH PROBABILITY SETUP SOON!!!🚨 SOLUSD HIGH PROBABILITY BUY SETUP 🚨
* Here We Can See Clearly The Next Potential Move For SOLANA Coming Hours/Days.
* Keep Your Eyes Close On Your Trading Positions.
* Happy PIP Hunting Traders.
FXKILLA.

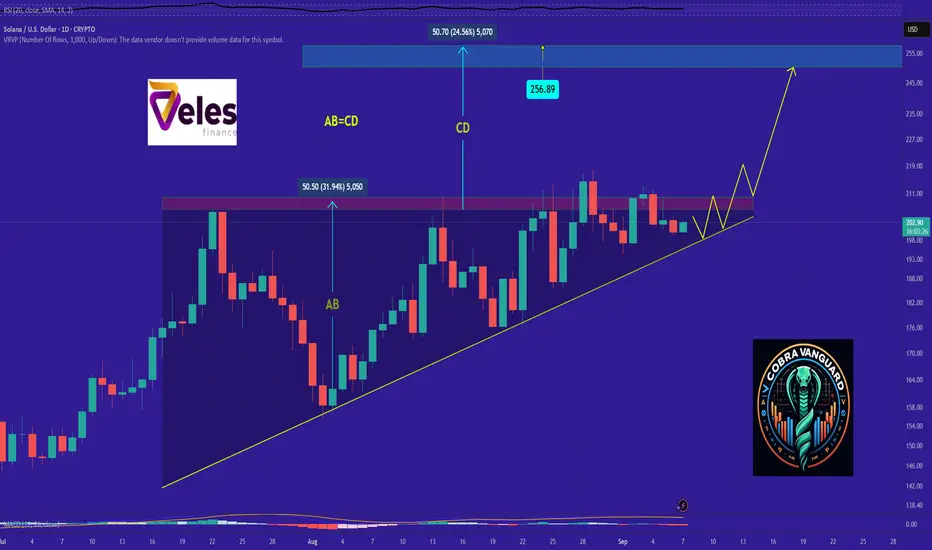
SOL analysis.Give me some energy !!!The price on the daily timeframe is within an ascending triangle, which can be promising. If the price breaks this pattern with bullish candles, it could easily rise by the distance of AB=CD .
Best regards CobraVanguard.💚
From $207 to $218: Solana Bullish Setup AheadOn the 1H chart of SOLUSD, the broader price structure is showing strength, favoring your bullish bias. Solana has been making higher swing lows, which is a strong sign of accumulation and sustained buying pressure. Each dip into support zones has been met with aggressive rebounds, suggesting buyers are still in control.
Currently, SOL is trading around $207–$208, after bouncing from the $202 area. This bounce was significant because it shows how well the $202 level is being defended. The price is now pushing toward the $213–$218 resistance band, which has acted as a supply zone multiple times before. A successful break above this band would likely confirm a continuation of the bullish momentum, potentially opening up higher targets in the coming sessions.
The immediate supports are clear. The most important one is $202.84, and below that, $195.91 and $190.14 form the next layers of demand. As long as SOLUSD holds above $202, the bullish structure remains intact. On the upside, the key resistance levels are $213.47 and $218.01. These areas are crucial profit-taking zones, and $218 is the major level to watch, as it has capped multiple rallies before.
🟢 Bullish Trade Setup (SOLUSD 1H)
• Entry Zone: $207–$208 (current trading area)
• Stop Loss: Below $202.84
• Target 1: $213.47
• Target 2: $218.01
For managing the trade, the best approach is partial profit booking. Closing around 30–40% of the position at $213.47 locks in early gains and reduces exposure. Once that level is reached, the stop-loss can be adjusted to breakeven at $207, removing risk from the trade. If the move continues toward $218, a trailing stop strategy should be applied, placing stops just below the most recent higher low on the 1H chart. If a breakout occurs above $218, the path toward $225 and beyond could open up, but for now, $218 remains the major bullish target.
In summary, SOLUSD is trading in a bullish structure with strong support at $202 and profit targets at $213 and $218. The setup provides a favorable risk-to-reward scenario, with partial profit booking and trailing stops ensuring profits are protected while leaving room for upside continuation.

SOL 4H – Golden Pocket Retest, Will $217 Hold as Next ResistanceSolana is consolidating near $201 after rejecting from the $217 zone. Price is now approaching the $197–192 demand zone, which aligns with the Fib 0.5–0.618 retracement and the 200 EMA ($194) — a strong confluence for a potential bounce.
The Stoch RSI is oversold, suggesting momentum could shift bullish if buyers step in at these levels. A clean hold above the $196–192 support box could send SOL back toward $217 resistance, with an eventual breakout opening the path toward $225–230.
However, a breakdown below $192 risks deeper retracement into the $186 zone (Fib 0.786) before bulls can regroup.
📌 Key Levels to Watch:
Support: $197–192 (golden pocket), $186 (0.786 Fib)
Resistance: $217, $225–230 extension
⚡ Follow for more chart breakdowns & trade setups.

SOLUSD HIGH PROBABILITY SETUP SOON!!!🚨 SOLANA HIGH PROBABILITY BUY SETUP 🚨
* Here We Can See Clearly The Next Potential Move For SOLUSD Coming Hours/Days.
* Keep Your Eyes Close On Your Trading Positions.
* Happy PIP Hunting Traders.
FXKILLA.

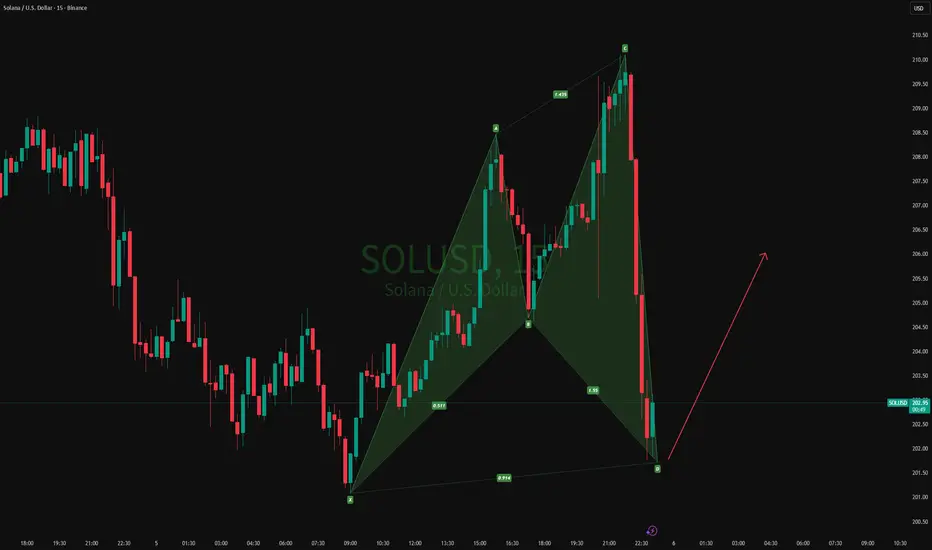
05-09-2025 SOLUSDAs shown in the figure: 15m Bullish Bat
The market is not always chaotic and disorderly, and there is a precise geometric beauty hidden in price fluctuations. The harmonic form long strategy is a powerful tool for accurately identifying potential market reversal points based on the Fibonacci ratio. When the form forms perfectly at the key support level, it often indicates the depletion of bearish momentum and the initiation of bullish trends.
Okay, here is a brief analysis of Solana (SOLUSD). **FundamentaOkay, here is a brief analysis of Solana (SOLUSD).
**Fundamental Analysis:**
Solana (SOL) is a high-performance public blockchain known for its high throughput and low transaction costs. Its core value stems from its rapidly growing ecosystem, particularly active in DeFi, NFTs, and meme coins. Key bullish factors include its technical advantages (such as parallel processing) and continuously improving network stability (reducing downtime). However, historical network outages, concerns about centralization, and threats from competing chains (like Ethereum L2s) remain potential risks.
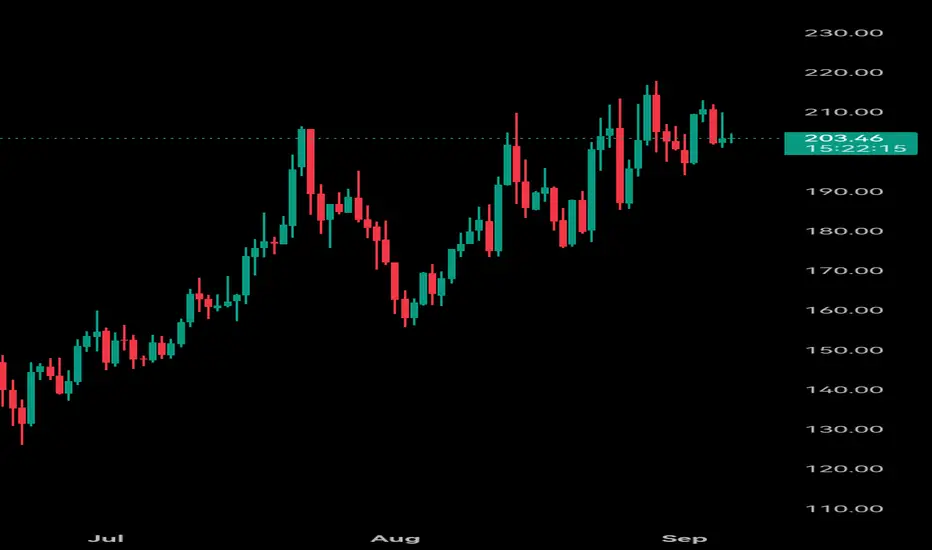
**Technical Analysis:**
SOL exhibits high price volatility. While correlated with Bitcoin's movements, it often shows greater elasticity. Key technical levels to watch include the ability to break through the all-time high (around $260), with crucial support near $120 (a confluence zone of previous highs and trendlines). Trading volume and ecosystem Total Value Locked (TVL) data are key indicators for assessing momentum.
**Summary and Outlook:**
Solana's long-term value depends on continued ecological innovation and enhanced network reliability. If it maintains its technical edge and further decentralizes, it could solidify its position as a top-tier blockchain. Short-term prices are significantly influenced by market sentiment and Bitcoin's performance, warranting caution due to high volatility.
***
*Disclaimer: The above content is market analysis and does not constitute investment advice. Cryptocurrency investments are extremely high risk; please make decisions cautiously.*
SOLUSD ShortThe Crab harmonic pattern signals a robust downward movement for SOLUSD, beginning at 209 USD and targeting likely TP 1 and TP 2 .

SOL 8H – Supply Zone Test at 215, Breakout or Retrace?Solana is once again pressing into the supply zone below 215 resistance. A breakout above this level could open the door toward higher continuation, while rejection here points back to the 0.5–0.618 retracement zone (186–179).
The demand zone near 170 remains the final strong support if deeper retracement occurs. With price hovering at a decision point, traders should watch closely for confirmation of either a breakout continuation or a retrace to reload.

SOL BUY SETUP ,Long from $203SOL BUY SETUP
Currently $203
Bought From $203
Stop loss $177
(Trading plan If SOL go down ,
to $197 will add more longs)
Expecting target $208 OR ABOVE
In the event of an early exit,
this analysis will be updated.
Its not a Financial advice

You will ask yourself "how did he know Sol would do that"?On Aug 30th I suggested that Sol was approaching my ideal buy zone at T2. I anticipated a bounce to my take profit target soon after. That played out perfectly.
Question remains...will T2 remain support? What do you think? I'd love to hear your thoughts.
May the trends be with you.

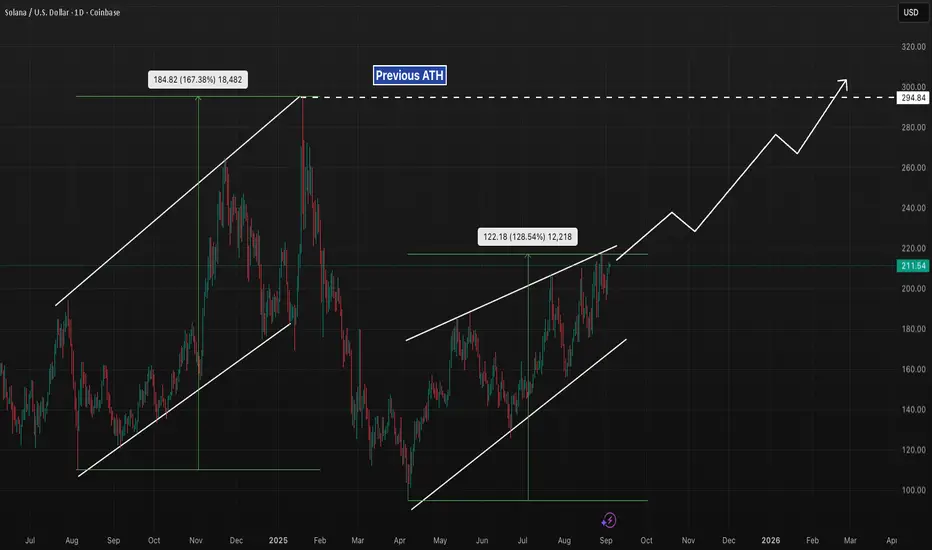
SOL 1D – Channel Breakout Targeting $295 ATH Zone?Solana has repeated a very similar channel structure to late 2024 — a steady grind higher inside an ascending channel followed by an explosive breakout. The current channel has already delivered a +128% measured move, echoing the prior +167% surge.
Key levels:
Channel top breakout → could extend toward $280–300.
$295 ATH resistance remains the key upside magnet.
Channel support → if lost, risk of retrace toward $180–170.
This symmetry suggests SOL could be setting up for another leg higher, with the $295 zone acting as the next major target.
$SOL Rotation IncomingNow that the CRYPTOCAP:ETH hype has calmed,
it’s almost time for CRYPTOCAP:SOL
to rip the haters face off...
once again🎃
