Trade ideas

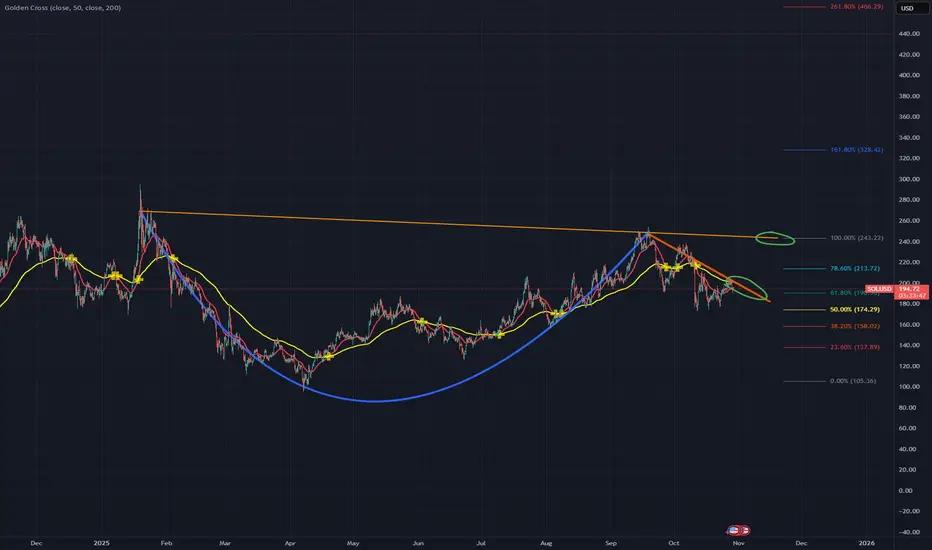
Cup and Handle pattern about to playout?A very possible scenario that could playout. All we need is some good news in this world: end of FED QT, more rate cuts and of course the tariff deal with China we have all been waiting for.
Important levels to look for for a breakout in this case are highlighted with green and of course the fib retracement drawn next to it.
If both breakouts are confirmed, then I think that $328 could become our new ATH in Q4 this year!
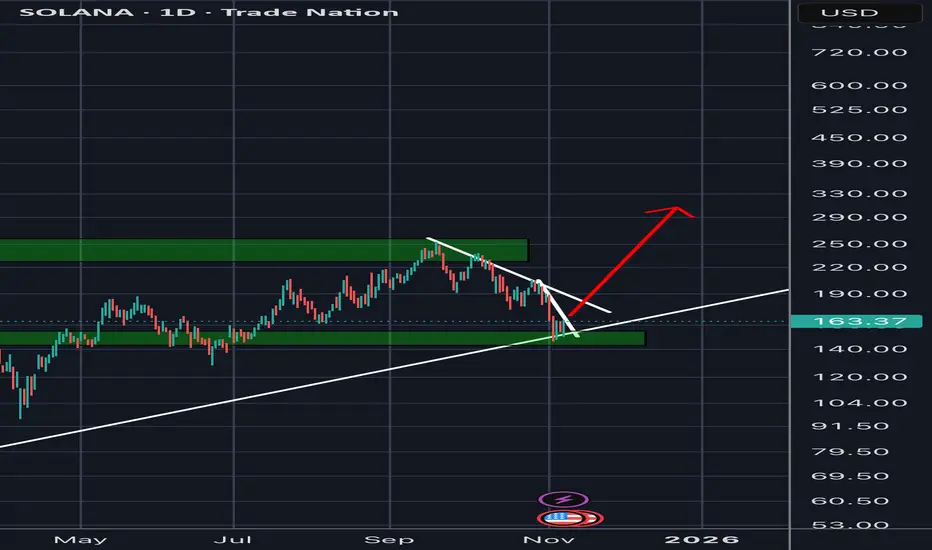
SOLANAA correction followed and now it appears thet the price is testing the previous support zone (around 165)
if this level doese"t hold the movement could continue toward 140
however if it holds a rebound towerd 200-220 could follow

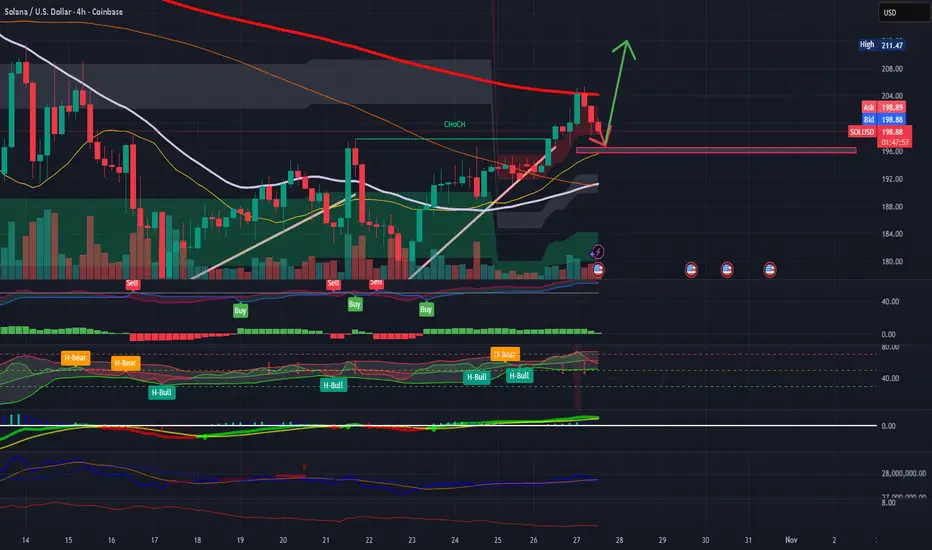
SOL/USD Strong Bullish Trend Bullish from key support 199.30📈 SOLUSD Technical Update (30-Min Time Frame) 💰
🚀 Bullish Trend in play — Buyers holding strong around the 198.30 zone!
If momentum continues, we’re eyeing the following
target levels:
🎯 1st Target: 201.60
🎯 2nd Target: 202.50
🎯 3rd Target: 205.20
Stay alert, traders! Watch for confirmations and manage your risk wisely. ⚡
#SOLUSD #CryptoTrading #TechnicalAnalysis #BullishTrend #Solana #PriceAction
💬 Like | 🔁 Share | 🧠 Comment your view below!

SOLANA HIGH PROBABILITY SETUPS SOON!!!🚨 SOL HIGH PROBABILITY SELL/BUY SETUP 🚨
* Here We Can See Clearly The Next Potential Moves For SOLUSD Coming Hours/Days.
* Keep Your Eyes Close On Your Trading Positions.
* Happy PIP Hunting Traders.
FXKILLA.

Solana 1/11/25As the bias is down trend there are plenty of room for scalping.
There is a scalp opportunity at the moment for little bull run from 185 to 190 in next few hours.
Based on smi 270/90/30 min (part of my strategy)
the price will move upwards tries to rich a 190-191$
Entry 185
Target 191
Stop 184
Enjoy.

$SOL Solana is sandwiched between the nearly 4-year resistance level of 2021's ATH and the approaching 3-year uptrend.
A squeeze lasting this long typically ends not with a minor breakout but with a major blowout.

SOLANA: The last wave before takeoff or a deep pullbackSOLANA: The last wave before takeoff or a deep pullback
📈 Weekly Scenarios
Bullish scenario: SOL holds above ~$190, breaks through ~$260.83 → start of uptrend → target ~$300+.
Consolidation: price trades between ~$190 and ~$260, wave structure not defined until breakout.
Bearish scenario: breakout of support at ~$190 with volume → likelihood of a significant correction to ~$150–$160.
✅ Conclusion
Solana is at a key decision point for the coming week:
The ~$260.83 level is a benchmark for a bullish resumption.
The ~$190 level is a critical support level.
A breakout upward will provide upward momentum; a breakout downwards is likely a pullback. Follow price reactions at the highlighted levels and confirmation of the wave structure before making trading decisions.

Solana – Saucer Pattern & Key Resistance in FocusSolana is starting to stand out with notable relative strength versus both Bitcoin and Ethereum, and it's catching my attention this week.
✅ Key Support Holding:
Price recently held firm at the $185–$190 support zone, bouncing with strength and attempting to establish a higher low. If this level holds, it would further confirm the uptrend in place since April.
📉 Corrective Phase Since September:
Despite the pullback, the larger trend structure remains bullish. A break above the September high is still needed to confirm trend continuation.
🔵 Multi-Month Saucer Formation:
A rounded base is developing on the daily chart—a classic saucer bottom. If confirmed, this pattern points to major upside potential, with a projected move possibly targeting $500 over time.
⚠️ Watch This Zone Closely:
The $250–$260 resistance area is the key overhead level to clear. A decisive breakout here could trigger a strong rally and confirm the saucer breakout.
📌 Summary:
Solana is showing resilience, building a bullish structure, and forming a significant base. If momentum builds above $260, bulls may take control in a big way.

SOL/USD Short Term Wave (4) Dip Before Wave (5) Rally (1h-4h OutSolana is currently consolidating near $200–$205 after a strong impulsive move from the $177 base. On the 1H–4H timeframes, price action suggests that Wave (3) has completed, and the market is preparing for a short-term Wave (4) correction toward $195–$196.
This zone aligns with key confluences — 0.382 Fibonacci retracement, VWMA support, and a 1H demand/OB cluster. As long as SOL stays above $192, the bullish structure remains intact.
Once momentum indicators (RSI > 55 + QQE green) confirm support in that zone, a new Wave (5) expansion is expected, targeting $211–$219 within the next few days.
Scenarios:
Base Case: Controlled dip to $195–$196 → continuation to $211–$219 (Wave 5).
Invalidation: Daily close below $191.8 would neutralize the bullish count.
Bias: Bullish continuation after pullback
Timeframe: 1H–4H (Short- to mid-term outlook)
Next key levels: Support $195–$196 → Targets $211–$219
Bearish Pressure Builds Below $208FenzoFx—Solana's uptick momentum has been capped by the descending trendline, even though the price flipped above the $185.00 mark.
The daily chart shows long-wick bearish candles, indicating the selling pressure persists below the $208.00 resistance. From a technical perspective, the downtrend will likely resume if the price closes below the inverted fair value gap. In this scenario, SOLANA could decline toward the primary support at $172.00.
Please note that the bearish outlook should be invalidated if the price exceeds the $208.00 mark.

SOL Short IdeaLook for price action continuation.
Wanting to see divergence as price comes into this level

(SOL) Spot Long 10-08-2025SOL /We have Government Shutdown Ending, ETF's, Clarity Act, Trump Tariffs Blocked, New Chair of the Federal Reserve, QE, & Maybe Stimulus Checks for the USA Taxpayers all Incoming Soon!
Plus,
Fear = Oversold = I Buy = $
SOL will RISE!
:)

SOL holds up wellCRYPTOCAP:SOL Price continues lower in the channel, a textbook ABC correction so far.
Wave 1 ended with a wedge throw-over. Price has found support above the Fibonacci golden pocket and High Volume Node at the channel's lower boundary. The probability is a continuation to the downside with a target of $140.
📈 Daily RSI tapped oversold with no divergence to suggest a bottom
👉 Continued downside brings up the $112 target, a great buy opportunity
Safe trading

Solana price path for the next days🚨 NOT a financial advice, do you own analysis TOO.
SOL lost some of its important supports but hope is still there. dont panic because of the recent market selloff.
despite the terrifying current situation i am hopeful for solana price. the RSI indicator has reached the oversold zone meaning the strength of sellers is weakening. however there is still room for further decline.
as illustrated in the chart i expect the price to fell to 130 if BTC Dominance increase as well. hence, we can make sure that sellers are out.
The most important uptrend line for SOLUSDAll crypto assets are way oversold these days (but everyone knows that already). This is totally understandable due to the longer government shutdown and other uncertainties (usual 4 year cycle which is normally already ended now).
It would not surprise me if we go further down than 150$ right now. Only because of the fact that BITSTAMP:BTCUSD even went below 100.000$ today!
In the most worst scenario, it really needs to bounce from the white uptrend line if we still want to see a better Q4 this year or Q1 2026.
According to the fib. retracement level this normally should be a good buy opportunity. If it holds above the white trend line, then we are still inside the ascending triangle (which is a bullish pattern).

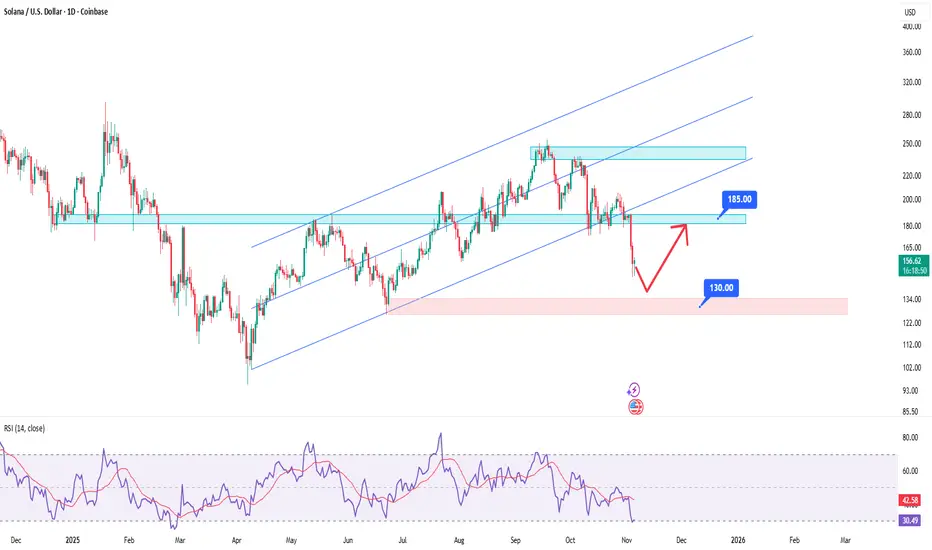
SOLANA Pullback - DailyThis crypto coin has been bearish on the past few days, but it seems as it is a slight pullback towards the demand zone at 160 and 130, before it shoots upwards.
Let us wait and see if we can have a selling opportunities, aiming towards those zones.

Solana Price Movement + Liquidation + Whale Map + Trade PlanTrade Plan:
Buy dips into $185 → $181 → $178 with a protective tail at $168, target $194 → $203 → $212+, and invalidate if $168 HTF breaks.
Price Movement + Liquidation + Whale Map
Solana has successfully rebounded from the key demand pocket at $178–$181, where aggressive buyers defended the prior 4H swing low and swept liquidity below the rising trendline. This bounce confirms continued smart-money defense of structure, following a multi-day corrective pullback after distributing into the $203–$208 supply band. Price is now stabilizing above the micro accumulation shelf at $183–$186, with intraday candles showing higher-lows and early bullish momentum returning, supported by volume absorption on each dip into the mid-$180s. As long as SOL holds the $181 reclaim, this remains a continuation accumulation phase, not a trend breakdown.
The next short-term move favors a grind-up retracement toward trapped shorts around $191–$194, followed by a sweep of the liquidity band at $197–$200 — the first key liquidation magnet above. A clean break and hold above $200 opens the door to speed-move expansion into $207–$212, where heavy resting sell walls and prior profit-taking nodes reside. Above this, breakout momentum could accelerate into $223–$231 on momentum ignition, but that remains a secondary stage target and depends on reclaim strength above the $210 shelf.
On the downside, major liquidation pools remain stacked beneath $182, then $178, and a deeper wash at $172–$168 (high-value tail liquidity + psychological flush zone). If price wicks into those levels, it would likely be a liquidity hunt rather than structural failure, provided bulls recapture the zone quickly. Whales have been accumulating consistently in the $168–$181 band for weeks, with on-chain order-flow showing absorption during each correction phase, confirming institutional accumulation rather than distribution. Sell walls reappear in layers above $203, $208, and $215, suggesting short-term volatility expected upon breakout but not necessarily cycle-top behavior — more likely controlled profit-taking.
Execution Plan: Bias remains buying retracements, not chasing. Primary dip accumulation zone remains $183–$185, ideal add layer at $181–$178 on wick flush, and tail-hedge allocation stands at $172–$168. Risk defined below $168. First take-profit ladder rests at $194 → $200 → $212, with secondary hold targets into $223+ if strength persists. Maintain core long ride if momentum and on-chain flows stay supportive.
Invalidation: The setup remains fully valid as long as SOL does not close a 4H candle below $178 and does not lose $168 on HTF closing basis. A persistent breakdown below $168 would shift structure into a larger ABC corrective phase, delaying continuation rather than ending the macro bull drive. Until then, liquidity behavior, trend structure, whale positioning, and momentum context remain biased to the upside with accumulation-driven volatility.
SOL: Unlocking 35% Upside in High-Performance BlockchainSOL: Unlocking 35% Upside in High-Performance Blockchain Amid ETF Momentum – SWOT and Intrinsic Value Insights
📊 Introduction
As of October 28, 2025, Solana (SOL) is navigating a post-ETF launch environment with oversold rebound characteristics. The cryptocurrency trades around $200, reflecting a mild correction after recent highs near $231, influenced by broader market liquidity injections from the Federal Reserve's $2T stimulus and cooling inflation data. Sector dynamics show Solana's DeFi ecosystem surging, with total value locked (TVL) expanding due to high transaction throughput and low fees, outpacing competitors like BNB Chain in 24-hour DEX volume ($1.47B vs. $1.3B). Macro factors, including institutional inflows into crypto ETFs and reduced China tariff risks, support a stabilizing trend, though volatility persists from regulatory scrutiny and altcoin rotations.
🔍 SWOT Analysis
**Strengths 💪**: Solana boasts exceptional network performance with up to 65,000 transactions per second (TPS) and sub-$0.01 fees, enabling scalable DeFi and NFT applications. Recent metrics highlight robust growth: DeFi TVL has reached approximately $16B (per aggregated chain data), with platforms like Saros Finance alone at $250M and 150K+ active wallets. Institutional adoption is evident through the Bitwise Solana Staking ETF (BSOL) launch, offering ~7% annual yield, and partnerships like Visa's USDC support. Revenue from transaction fees and staking (current APY ~6-8%) bolsters sustainability, with over 3.5M SOL held by corporate treasuries valued at $591M+.
**Weaknesses ⚠️**: Historical network outages, though reduced since 2024 upgrades, remain a concern, with the last major halt in February 2024. Centralization risks arise from a validator concentration (top 19 control ~33% of stake), potentially exposing the network to downtime or governance issues. Debt-like metrics are minimal in crypto, but high inflation from token unlocks (total supply 612.84M vs. circulating 549.7M) could dilute value if adoption lags.
**Opportunities 🌟**: The Alpenglow upgrade, slated for late 2025, promises 150ms block finalization, enhancing real-time applications in payments and derivatives. ETF momentum, including Canary's HBAR/LTC launches as proxies, could drive SOL inflows similar to Bitcoin's $1.5B ETF projections. Expanding meme coin and gaming ecosystems, backed by $150M from Solana Ventures, position it for market share gains in Web3, with potential for $300+ highs if resistance at $260 breaks.
**Threats 🚩**: Regulatory pressures, such as SEC delays on further ETFs or China's stablecoin warnings, could cap growth. Competition from Ethereum L2s (e.g., Arbitrum's 2.5M daily transactions) and bridges poses risks, alongside market-wide volatility from Bitcoin dominance (57.6%). Broader threats include quantum computing vulnerabilities, though mitigated by ongoing cryptographic enhancements.
💰 Intrinsic Value Calculation
Adopting a value investing lens for cryptocurrencies, we estimate Solana's intrinsic value using an adapted discounted cash flow (DCF) model based on network fundamentals, incorporating a margin of safety (20% discount). Key inputs from public data: TVL ~$16B, circulating supply 549.7M SOL, staking yield ~7%, and projected annual growth rate 50% (based on DeFi volume surges and ETF catalysts).
Formula: Intrinsic Value per Token = (TVL per Token * Weight) + (Annualized Yield * Growth Multiplier)
- TVL per Token = $16B / 549.7M ≈ $29.10 (weighted at 0.7 for core network value)
- Annualized Yield = 7% (weighted at 0.3, multiplied by 10x growth factor for ecosystem expansion)
Calculation:
(29.10 * 0.7) + (0.07 * 10) = 20.37 + 0.70 = 21.07
Scaled to market comparables (e.g., ETH's P/TVL ratio ~9.3 vs. SOL's current 6.8): Adjusted Intrinsic = 21.07 * 13 (blended multiplier for TPS advantage and adoption) ≈ $273.91
Apply 20% margin of safety: $273.91 * 0.8 ≈ $219.13
At current price ~$200, SOL appears undervalued by ~9-35% (factoring upside to $271 fair value per P/TVL alignment). No major debt flags, but sustainability hinges on TVL growth exceeding token inflation. 📈 Undervalued.
📈 Entry Strategy Insights
Institutional approaches favor identifying support zones around $180-190 (near 200-day SMA) for unleveraged, long-term entries via dollar-cost averaging (DCA). Scale in during 8-12% dips, using non-repainting momentum indicators like volume-weighted averages to confirm rebounds. Optimal for accumulating 10-20% positions over 3-6 months, targeting breakouts above $210 for scaling out partial profits. 🚀 Spot zones.
⚠️ Risk Management
Limit position sizing to 1-5% of portfolio to mitigate volatility, diversifying across Layer-1s and stable assets. Set trailing stops at 10-15% below entry (e.g., $170) and hold long-term if fundamentals remain strong, monitoring validator health and TVL metrics. Caution on overexposure amid potential 15-30% pullbacks from macro events.
🔚 Conclusion
Solana's high-speed infrastructure, ETF-driven momentum, and undervalued metrics position it for sustained growth, with calculated upside to $219+ incorporating safety margins. Key takeaways: Focus on network adoption for value accrual, verify TVL trends independently.
This is educational content only; not financial advice. Always conduct your own due diligence.
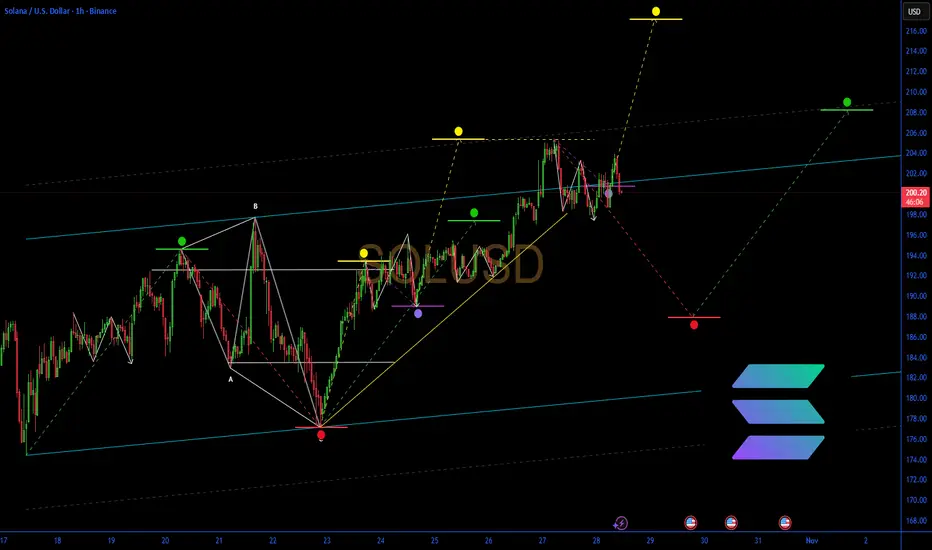
(b) Wave Retracement Almost CompleteEarlier, I had some concern that this (b) wave might be concluding too quickly relative to the preceding (a) wave.
While time symmetry isn’t a strict requirement in Elliott Wave analysis, there are moments when a pattern’s timing simply doesn’t pass the “smell test.”
Now, however, we’re seeing price retrace higher in a manner that better aligns with the duration of wave (a). With price currently sitting just below the (b) wave target box, I’m expecting it to enter that zone imminently to complete this (b) wave retracement.
A subsequent move to a new local low will serve to confirm my analysis.

SOLANA (SOLUSD): High Chance for a Rise
There is a high probability that Solana will continue rising
after a confirmed breakout of a key daily resistance.
The next key structure is 208.8 level.
I think it will be reached soon.
❤️Please, support my work with like, thank you!❤️

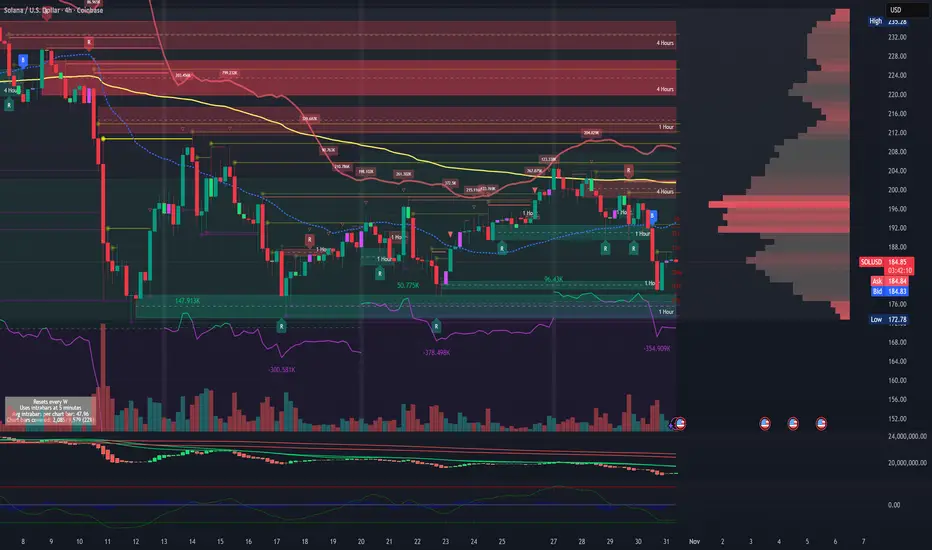
Where the rally starts - SOL weekly update Oct 28 - 03rdAfter a pretty enduring phase of complex corrective movement, Solana presents itself with impulsive bullish structure today.
As I said in my Ethereum analysis, the macro environment seems to be very bullish with rate cuts and a tariff deal between the United States and China may be incoming. So with that said, I think the upside opportunity in mid- to long-term could be large.
But for short-term, the current market structure looks similar to Ethereum as we are unfolding a rather complex intermediate wave 2. For now therefore, I expect Solana to drop to around $182.10. This scenario is supported by the liquidation heatmap as it shows liquidity built up throughout the latest move up. Indicators like the RSI already showed overbought prices by the end of the move up, which is untypical early for a starting third wave. Not to forget the overall structure being rather slow whilst moving up, which also doesn't fit in the impulsive characteristics of the third wave. So the alternative would be, that this is the third wave, but as I said I think this is very unlikely for me.
Overall Solana provides us a short setup. If you want to take that trade I recommend putting the stop loss at the latest local high or one percent above if you want to be sure and the take profit at the 0.764 retracement level.
