SOL/USD – Oversold Pullback🟠 Bounce setup near $224
Solana trades at $226, slipping under SMA200 ($230.9) with RSI at 29, signaling oversold. Support sits at $224, resistance near $237 — potential for a short-term relief bounce.
📖 Keywords: #SOLUSD #Solana #CryptoReversal #AltcoinSetup
Trade ideas

Solana’s Battle With Historic ResistanceAnalysis of SOL/USDT on the daily chart:
🔎 Technical Overview
Current Trend: Solana has rallied strongly from around $120 to $240 but is now facing heavy resistance at the long-term descending trendline (blue line). Price is currently correcting.
50-Day SMA: Located around $142, acting as a key support zone.
Key Resistance: $260–265 (descending trendline + horizontal resistance).
Key Support: $210–212 (horizontal support + close to SMA50 area).
📉 Short-Term Outlook (1–3 weeks)
Bearish case: If price loses $212, a drop toward $185–190 is likely.
Stop Loss: Below $210.
Bullish case / Short-term target: If price stabilizes above $240, next upside target is $260 (retest of trendline).
📈 Long-Term Outlook (3–6 months)
Bullish breakout scenario: A strong breakout above $265 would confirm a trend reversal, opening room for a larger rally.
Long-term targets:
First target: $300
Second target: $350
Stop Loss (long-term): Below $185 (falling back into the previous bearish channel).
✅ Summary:
Short-term: Risk of correction remains; $210 support is crucial.
Long-term: A confirmed breakout above $265 could trigger a new bullish phase with potential toward $300–350.

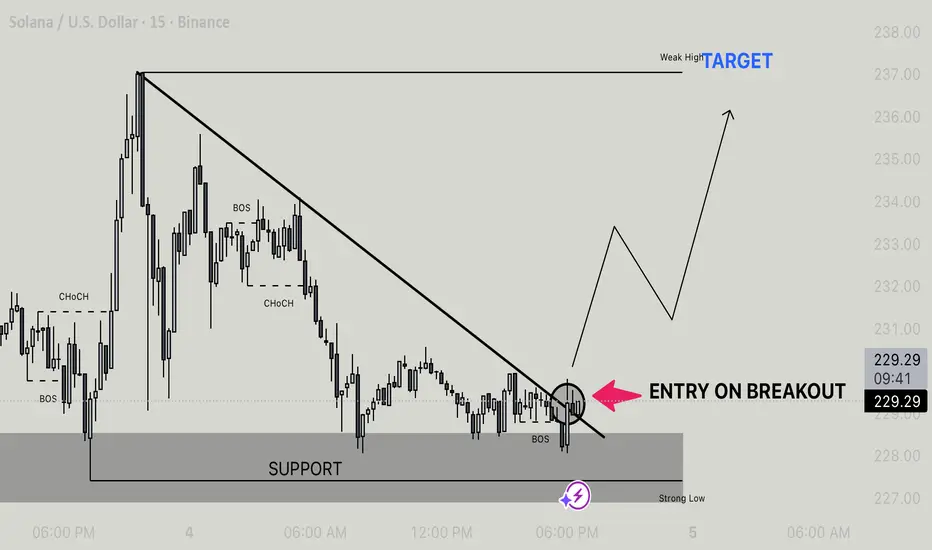
Sol/Usdt - Bullish Breakout Setup From Support Price has been consolidating around the support zone after a strong bearish move. We can observe multiple BOS (Break of Structure) and a clear descending trendline acting as resistance.
• Currently, price is testing the support zone and forming a potential trendline breakout setup.
• Entry confirmation will be on a clean breakout above the descending trendline (marked area).
• Once the breakout occurs, price is expected to retest and then push higher towards the weak high liquidity area, with the next target around 236–238.
Plan:
• Entry: On breakout + retest confirmation.
• Target: 236–238 (weak high).
• Invalidation: A strong break below the support zone would invalidate this bullish setup.
SOLUSD sell at Market PriceHi everyone.
I think we can sell our Solana at this level.
I'll partial exit at first tp that I mentioned, and I think it will has potential to go lower.
Let's see what happens.
Good luck.
Dear traders, please support my ideas with your likes and comments to motivate me to publish more signals and analysis for you.
Best Regards
Navid Nazarian

SOL we keep Pushing 100K so fari'm so happy to annouce that my trade on solana was so successful that i have put my house into it ; and we keep pushing ; let's go hit the 280 dolars and we will never be broke again

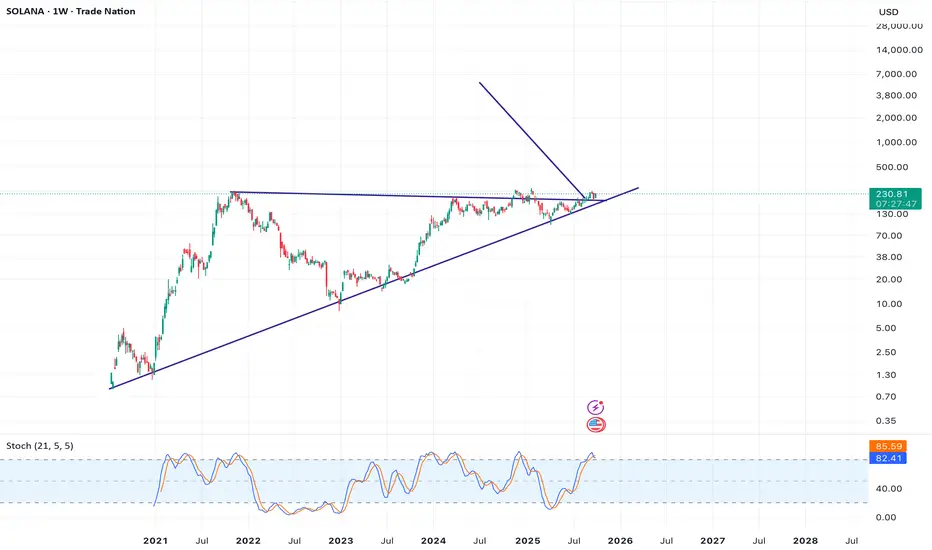
Solana ready for take offSolana is ready for take off. As long as it stays above the trend line, it will be targeting 5500 dollar. Weekly trend has been confirmed for many times. So it seems really powerful.
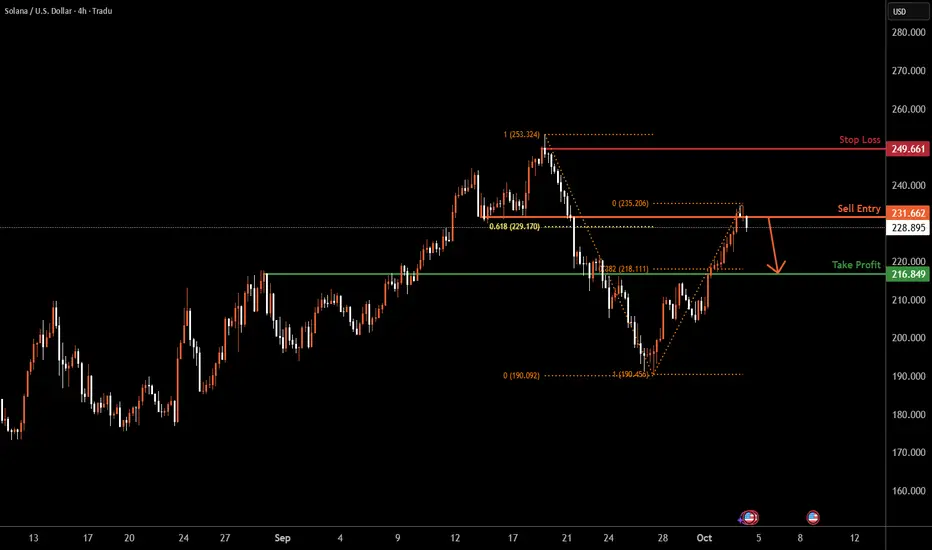
SOLUSD H4 | Bearish Reversal SetupSOL/USD is reacting off the sell entry, which is a pullback resistance that is slightly above the 61.8% Fibonacci retracement and could drop from this levle to the take profit.
Sell entry is at 231.66, which is a pullback resistance that is slightly above the 61.8% Fibonacci retracement.
Stop loss is at 249.66, which is a swing high resistance.
Take profit is at 216.84, which is an overlap support that aligns with the 38.2% Fibonacci retracement.
High Risk Investment Warning
Trading Forex/CFDs on margin carries a high level of risk and may not be suitable for all investors. Leverage can work against you.
Stratos Markets Limited (tradu.com ):
CFDs are complex instruments and come with a high risk of losing money rapidly due to leverage. 65% of retail investor accounts lose money when trading CFDs with this provider. You should consider whether you understand how CFDs work and whether you can afford to take the high risk of losing your money.
Stratos Europe Ltd (tradu.com ):
CFDs are complex instruments and come with a high risk of losing money rapidly due to leverage. 66% of retail investor accounts lose money when trading CFDs with this provider. You should consider whether you understand how CFDs work and whether you can afford to take the high risk of losing your money.
Stratos Global LLC (tradu.com ):
Losses can exceed deposits.
Please be advised that the information presented on TradingView is provided to Tradu (‘Company’, ‘we’) by a third-party provider (‘TFA Global Pte Ltd’). Please be reminded that you are solely responsible for the trading decisions on your account. There is a very high degree of risk involved in trading. Any information and/or content is intended entirely for research, educational and informational purposes only and does not constitute investment or consultation advice or investment strategy. The information is not tailored to the investment needs of any specific person and therefore does not involve a consideration of any of the investment objectives, financial situation or needs of any viewer that may receive it. Kindly also note that past performance is not a reliable indicator of future results. Actual results may differ materially from those anticipated in forward-looking or past performance statements. We assume no liability as to the accuracy or completeness of any of the information and/or content provided herein and the Company cannot be held responsible for any omission, mistake nor for any loss or damage including without limitation to any loss of profit which may arise from reliance on any information supplied by TFA Global Pte Ltd.
The speaker(s) is neither an employee, agent nor representative of Tradu and is therefore acting independently. The opinions given are their own, constitute general market commentary, and do not constitute the opinion or advice of Tradu or any form of personal or investment advice. Tradu neither endorses nor guarantees offerings of third-party speakers, nor is Tradu responsible for the content, veracity or opinions of third-party speakers, presenters or participants.
SOLUSD Long Idea: Bullish Retest of Flipped Support LevelHello TradingView Community,
This post outlines a potential long trade setup for the Solana / U.S. Dollar (SOLUSD) pair, based on the 15-minute timeframe.
Technical Analysis:
The chart shows a significant horizontal price level at approximately $231.43. This level acted as a strong resistance zone, capping the price on previous attempts to move higher.
Recently, we have witnessed a decisive breakout above this resistance, which is a strong bullish signal indicating that buyers are taking control. The trading idea is based on the classic "resistance-turned-support" principle. The price is currently retesting this broken level from above. A successful hold and bounce from this area would confirm it as new support and could serve as a launchpad for the next leg up.
Trade Setup:
The long position tool on the chart visualizes a potential trade plan for this bullish scenario:
Entry: Approximately $231.43 (at the retest of the new support).
Stop Loss: $218.13 (placed below the support structure to invalidate the idea if the level fails to hold).
Take Profit: $267.45 (targeting a potential new higher high).
This setup provides a structured plan with a favorable risk-to-reward ratio for a potential continuation of the bullish momentum.
Disclaimer: This analysis is for educational and discussion purposes only and should not be considered financial advice. Trading cryptocurrencies involves significant risk. Please conduct your own due diligence and manage your risk appropriately.

Bull flag / bullish rectangleWhen BTCUSD will come out of the (bullish) descending channel pattern (I think it wil) then SOLUSD will play it out this way too. Let’s go!
BTC, ETH, SOL Support, Resistance, and Discovery Zones From HereHere's the 'heat map' for Bitcoin, ETH and Solana's prices from here.
Despite the big liquidation target zone and buy limit order concentration in the $106k zone in Green...
Price pushed higher the last few days as 'Uptober' took hold and the US Government shut down, effectively silencing any negative economic news releases.
Plus we can see that 2 more rate cuts are virtually guaranteed in October and December.
So, very likely that Bitcoin rallies to new ATH later in October into November.
However, I'm seeing sell block pressure just above on Bitcoin in the $121k - $124k range, and also on the TOTAL market cap.
What's interesting is that I'm not seeing any sell block pressure on TOTAL2 or TOTAL3, indicating that Alts are more likely to push higher from here, as BTC retraces.
What do you think?

Solana (SOL) Pushes Higher, Faces Resistance at 230Solana (SOL) Pushes Higher, Faces Resistance at 230
Solana (SOL) is demonstrating strong bullish momentum on the 4-hour chart, having rallied impressively from below the "200 to 205 Key Support" and is now trading at 226.30 within a well-defined ascending channel.
The price is currently consolidating near the "230" level and is approaching the "235 to 240 flip zone," which represents the next significant resistance area.
A potential pullback from current levels would find immediate support at the "220 Immediate Support," aligning with the lower trendline of the ascending channel.
Sustaining price action above the "220 Immediate Support" is crucial for the continuation of the bullish trend towards the "250 Key Resistance (Sell Order Block)."
Disclaimer:
The information provided in this chart is for educational and informational purposes only and should not be considered as investment advice. Trading and investing involve substantial risk and are not suitable for every investor. You should carefully consider your financial situation and consult with a financial advisor before making any investment decisions. The creator of this chart does not guarantee any specific outcome or profit and is not responsible for any losses incurred as a result of using this information. Past performance is not indicative of future results. Use this information at your own risk. This chart has been created for my own improvement in Trading and Investment Analysis. Please do your own analysis before any investments.

SOLUSD Three Drives PatternNot sure if those ratios fit. Someone should check that.
I also wonder where the target is supposed to be on the Three Drives pattern.
Either way. Here it is.
Why Gen X Struggles with Crypto?Why does Gen X struggle with crypto?
Because they’re used to the stock market system, where ownership is recorded by a central registry and trades that are tied to a specific exchange.
In their world, you typically should buy through Nasdaq in this example and expect to sell through Nasdaq. But with Bitcoin or other cryptocurrencies, the blockchain itself is the registry, which means you can buy on one platform and sell on another freely. That shift—from centralized exchanges to decentralized settlement—is what makes crypto hard to grasp.
Mirco Bitcoin Futures and Options
Ticker: MBT
Minimum fluctuation:
$5.00 per bitcoin = $0.50 per contract
Disclaimer:
• What presented here is not a recommendation, please consult your licensed broker.
• Our mission is to create lateral thinking skills for every investor and trader, knowing when to take a calculated risk with market uncertainty and a bolder risk when opportunity arises.
CME Real-time Market Data help identify trading set-ups in real-time and express my market views. If you have futures in your trading portfolio, you can check out on CME Group data plans available that suit your trading needs www.tradingview.com

$SOLUSD Potential PlayIf it breaks pass $230
will take entry at $231
Will take profit at $250
have a stop loss at $214
if not take a bearish position back down to $214 and lower
This is just a regular technical analysis.
THIS IS NOT FINANCIAL ADVICE, BE ADVISED THIS IS NOT FINANCIAL ADVICE THIS IS SIMPLY WHAT I AM SEEING. I AM TRADING ON A PAPER TRADING ACCOUNT. MY ACTUAL MONEY ACCOUNT I TRADE OPTIONS AND AM DOING ALRIGHT THE NEWS IS REALLY TEARING ME APART BUT WITH STOCKS I AM LEARNING THAT ITS VOLUME AND TIME THAT MATTER. NO ONE CAN TELL YOU ITS GOING DOWN TOMORROW BUT IF THE CABAL DOESNT WANT IT DOWN FOR A MONTH OR A YEAR OR 5 YEARS IT WON'T GO DOWN AND YOU WILL BE STUCK IN THAT POSITION. SO, PATIENCE IS KEY.

$SOL for Long Monthly ChartThis target will complete in next 1000 Days. Long target for SOL.
Cup & Handle Pattern on Monthly.
Short term
target is 900$
Target 2 is 1200$
Let's go.

Solana's Comeback: Can it Break $222 and Eye $230?Solana's Comeback: Can it Break $222 and Eye $230?
Solana (SOL) is currently in a critical phase of recovery on the 4-hour timeframe after undergoing a significant correction from its peak around the 250 "Key Resistance (Sell Order Block)." Following a breakdown from a previous ascending channel and the 235-240 "flip zone," SOL found significant support near the 190 level.
From that low, we've observed the formation of a new, albeit tighter, ascending trendline, suggesting renewed buying interest and a series of higher lows. SOL is now encountering immediate resistance in the 215-222 range.
A decisive break above this 215-222 key resistance would be a bullish indicator, potentially targeting the 230 level and then the more substantial 235-240 "flip zone." Conversely, maintaining the integrity of the current ascending trendline and holding above the 200 to 205 "Immediate Sup-port" is crucial for this recovery to continue. A breakdown from these levels could see SOL retesting the "Next Support near 190." The overall structure indicates a battle between buyers attempting to regain momentum and sellers looking to defend higher price levels.
Disclaimer:
The information provided in this chart is for educational and informational purposes only and should not be considered as investment advice. Trading and investing involve substantial risk and are not suitable for every investor. You should carefully consider your financial situation and consult with a financial advisor before making any investment decisions. The creator of this chart does not guarantee any specific outcome or profit and is not responsible for any losses incurred as a result of using this information. Past performance is not indicative of future results. Use this information at your own risk. This chart has been created for my own improvement in Trading and Investment Analysis. Please do your own analysis before any investments.

Time to leave the tiny ascending channel!We’re leaving the tiny ascending channel here. Continueing our journey inside the .. much bigger ascending channel. Very very very bullish!

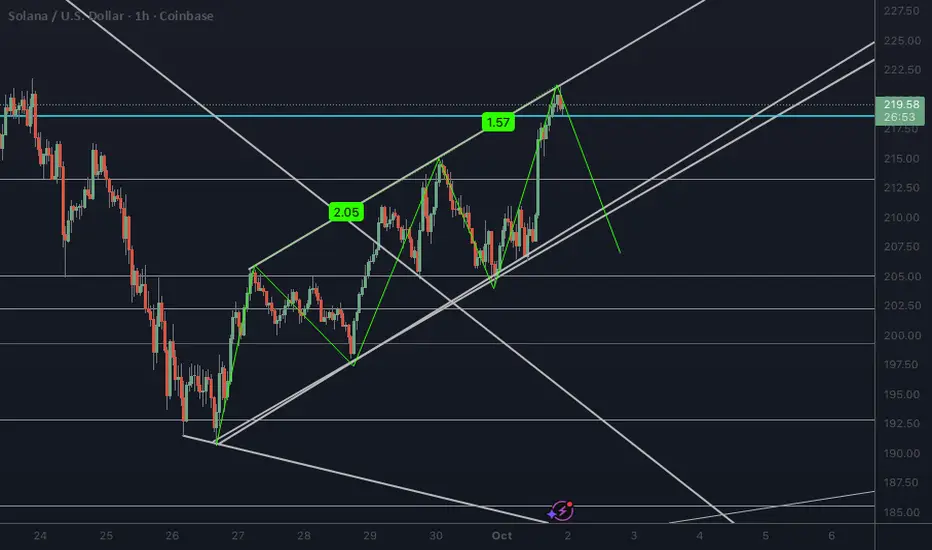
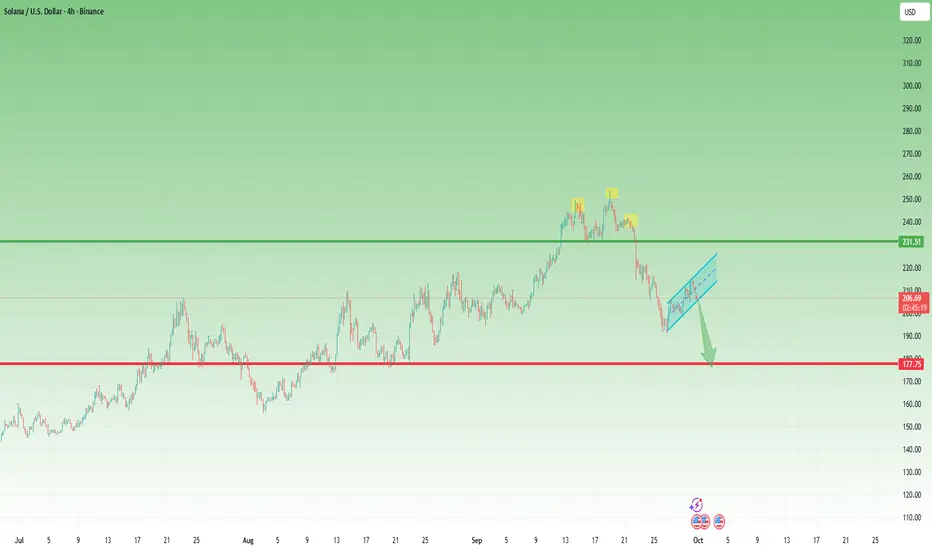
Solana: From 254 Highs Back to the 200 Line – What’s Next?At the end of August, I wrote that as long as 190 remained intact, Solana had room to rise toward 250, and I suggested a buy around the 200 level. That trade worked beautifully, with price reaching as high as 254.
From there, Solana started to roll over. At first, it looked like a normal correction, but the picture changed after a weak bounce attempt. Price broke decisively below 230, and the recent low was set right back at 190.
Currently, Solana is recovering once again. However, the structure of this bounce looks corrective in nature, forming what appears to be a bearish flag.
🔑 Key levels to watch:
• A break below the flag’s support – and more importantly below 200 – would likely trigger another leg down.
• In that case, the market could head toward a 175–180 major support zone, which is the next critical area for buyers to defend.
Until then, the bias remains cautious: Solana must prove it can break free from the corrective structure before bulls can regain control. 🚀
SOLUSD Based on the H4 chart analysis, we could see the price rising towards the sell entry which lines up with the 38.2% Fibonacci retracement and could reverse from this level to the take profit.
Sell entry is at 216.43, which is an overlap resistance that lines up with the 38.2% Fibonacci retracement.
Stop loss is at 230.50, which is a pullback resistance that lines up with the 61.8% Fibonacci retracement.
Take profit is at 194.30, which is a pullback support.
High Risk Investment Warning
Trading Forex/CFDs on margin carries a high level of risk and may not be suitable for all investors. Leverage can work against you.
Stratos Markets Limited (tradu.com ):
CFDs are complex instruments and come with a high risk of losing money rapidly due to leverage. 65% of retail investor accounts lose money when trading CFDs with this provider. You should consider whether you understand how CFDs work and whether you can afford to take the high risk of losing your money.
Stratos Europe Ltd (tradu.com ):
CFDs are complex instruments and come with a high risk of losing money rapidly due to leverage. 66% of retail investor accounts lose money when trading CFDs with this provider. You should consider whether you understand how CFDs work and whether you can afford to take the high risk of losing your money.
Stratos Global LLC (tradu.com ):
Losses can exceed deposits.
Please be advised that the information presented on TradingView is provided to Tradu (‘Company’, ‘we’) by a third-party provider (‘TFA Global Pte Ltd’). Please be reminded that you are solely responsible for the trading decisions on your account. There is a very high degree of risk involved in trading. Any information and/or content is intended entirely for research, educational and informational purposes only and does not constitute investment or consultation advice or investment strategy. The information is not tailored to the investment needs of any specific person and therefore does not involve a consideration of any of the investment objectives, financial situation or needs of any viewer that may receive it. Kindly also note that past performance is not a reliable indicator of future results. Actual results may differ materially from those anticipated in forward-looking or past performance statements. We assume no liability as to the accuracy or completeness of any of the information and/or content provided herein and the Company cannot be held responsible for any omission, mistake nor for any loss or damage including without limitation to any loss of profit which may arise from reliance on any information supplied by TFA Global Pte Ltd.
The speaker(s) is neither an employee, agent nor representative of Tradu and is therefore acting independently. The opinions given are their own, constitute general market commentary, and do not constitute the opinion or advice of Tradu or any form of personal or investment advice. Tradu neither endorses nor guarantees offerings of third-party speakers, nor is Tradu responsible for the content, veracity or opinions of third-party speakers, presenters or participants.

Descending channel followed by cup and handle?After the bull flag we had a descending channel pattern. I’m thinking that we are about to form a cup and handle pattern here. All three patterns are bullish.
SOL call another BUYvery simple set up , waiting at key zones to enter the market, the retracement is abvious and we have to take advantage of the next bullrun


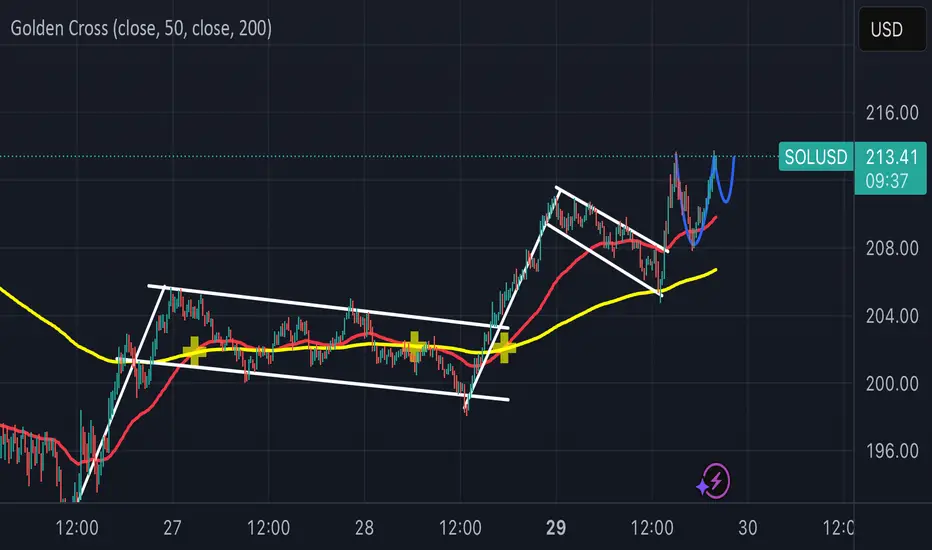
Solana Chart Fibonacci Analysis 092725Trading Idea
1) Find a FIBO slingshot
2) Check FIBO 61.80% level
3) Entry Point > 200/61.80%
Chart time frame:B
A) 15 min(1W-3M)
B) 1 hr(3M-6M)
C) 4 hr(6M-1year)
D) 1 day(1-3years)
Stock progress:A
A) Keep rising over 61.80% resistance
B) 61.80% resistance
C) 61.80% support
D) Hit the bottom
E) Hit the top
Stocks rise as they rise from support and fall from resistance. Our goal is to find a low support point and enter. It can be referred to as buying at the pullback point. The pullback point can be found with a Fibonacci extension of 61.80%. This is a step to find an entry-level position. 1) Find a triangle (Fibonacci Speed Fan Line) that connects the high (resistance) and low (support) points of the stock in progress, where it is continuously expressed as a Slingshot, 2) and create a Fibonacci extension level for the first rising wave from the start point of the slingshot pattern.
When the current price goes over the 61.80% level, that can be a good entry point, especially if the SMA 100 and 200 curves are gathered together at 61.80%, it is a very good entry point.
As a great help, TradingView provides these Fibonacci speed fan lines and extension levels with ease. So if you use the Fibonacci fan line, the extension level, and the SMA 100/200 curve well, you can find an entry point for the stock market. At least you have to enter at this low point to avoid trading failure, and if you are skilled at entering this low point, with the fibonacci6180 technique, your reading skill of to chart will be greatly improved.
If you want to do day trading, please set the time frame to 5 minutes or 15 minutes, and you will see many of the low points of rising stocks.
If you prefer long-term range trading, you can set the time frame to 1 hr or 1 day
