Solana $SOL retrace to around $85 then pump to $1400 in 2027Two legged measured move wave pattern suggests that solana CRYPTOCAP:SOL will retrace to around $85 then pump to $1400 in 2027.
Trade ideas

Solana Weekly Forecast and ScenariosWeekly Forecast and Scenarios
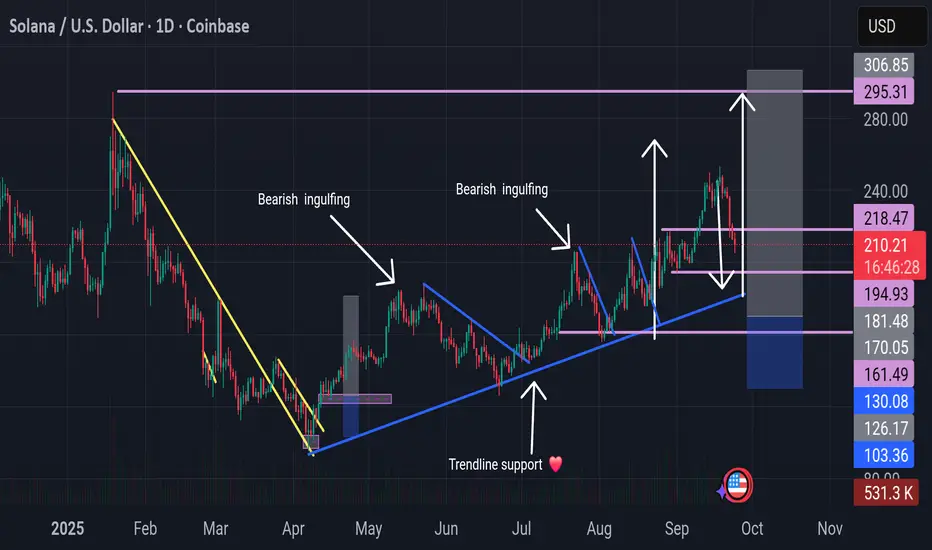
Bullish scenario: SOL holds support near $200–$210 and breaks through the $245–$250 zone, leading to a directional move toward $270 and beyond (even to $300).
Consolidation: The price may fluctuate within the $200–$245 range, awaiting volume and news, without a clear trend.
Bearish scenario: A breakout from the support range (below ~$188–$200) could lead to a pullback to lower levels of $170–$180.
SOl buy NOW to the moon After a downword trend , solana has swiped up liquidity and is ready for thenext bull run , let's see some new all time high =s

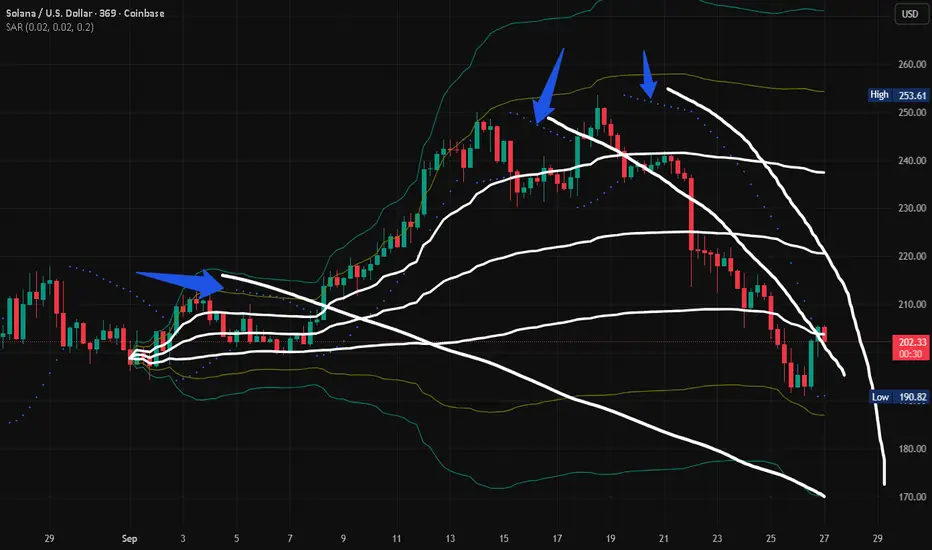
looks like $150 by the end of the monthwill it follow the dots direction straight down? or is it an epic v bottom?
looks like it followed the previous down parabolic sars
Solana macro retracement complete , full on bear marketEyeing 40-70 dollar solana post macro C wave correction. the ending diagonal on the retracement gives me reason to believe we are in full bear , and we have been for a while. Looking for critiques and alternate wave counts are welcome to test my thesis. I would love higher prices ,but I have to protect my positions if i'm seeing bearish counts.

Solana: Target Zone in FocusSOL has dropped more than 20% from last Thursday’s high. In light of this, we now believe that last week’s high—reached on Thursday—marked the top of wave i in orange, and that price is currently undergoing a wave ii corrective phase. This correction should play out as a downward, three-part move labeled - - in green, ultimately targeting our orange zone between $155.80 and $113.20. We expect the low of this wave ii to occur within that Target Zone, which should set the stage for a bullish reversal. The following wave iii in orange is projected to push SOL to new all-time highs, breaking through resistance at $295.31.
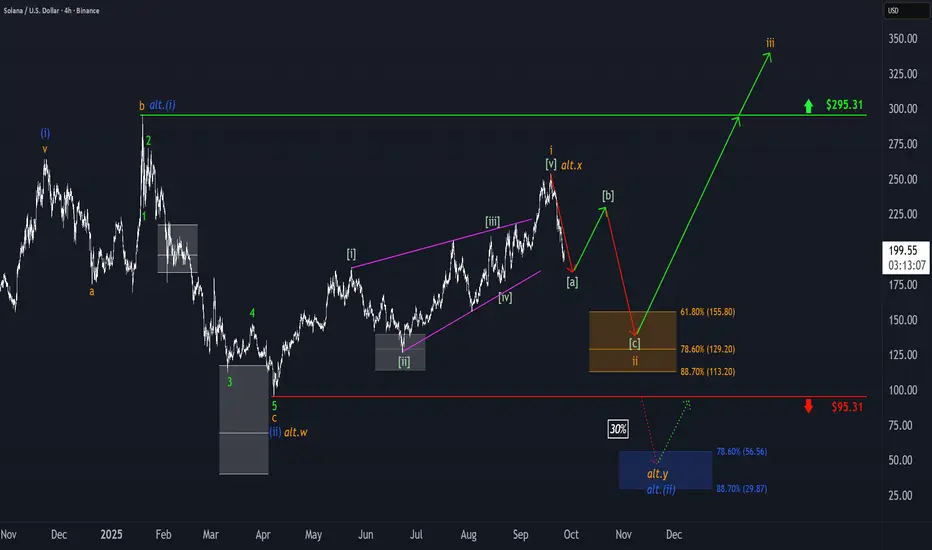
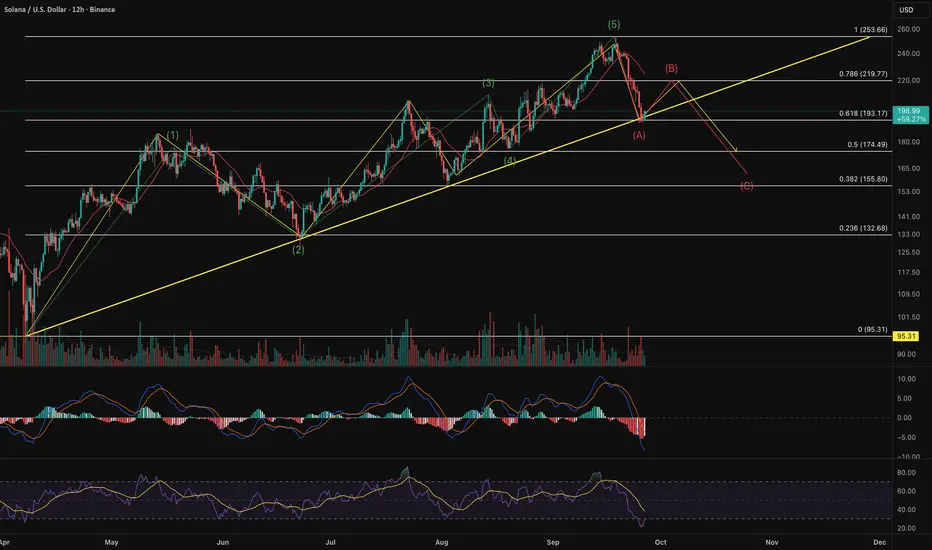
SOL on A‑B‑C correctionWave B usually retraces 38‑62 % of wave A. A 38.2 % retracement from the wave‑A low (≈ US$193.17) yields a bounce to roughly US$216.28, while a 61.8 % retracement projects a rally toward US$230.55. The earlier peak around US$219.77 (78.6 % fib of the full range) provides a realistic target range (≈ US$216–231).
In zigzag corrections, wave C often equals wave A in length or extends by a Fibonacci multiple. Assuming wave B tops near US$219.77–230.55, a drop equal to the US$60.49 length of wave A would target US$159–170. The 38.2 % Fibonacci retracement of the entire move (≈ US$155.80) and the 50 % level (≈ US$174.49) mark likely support zones.
(generated by AI)
Solana's oversold RSI. Major upward move ahead.Solana Fibonacci .618 retracement resets RSI to oversold, which signals a major move ahead.
A major move would also coincide with the upcoming major ETF approval on October 10.

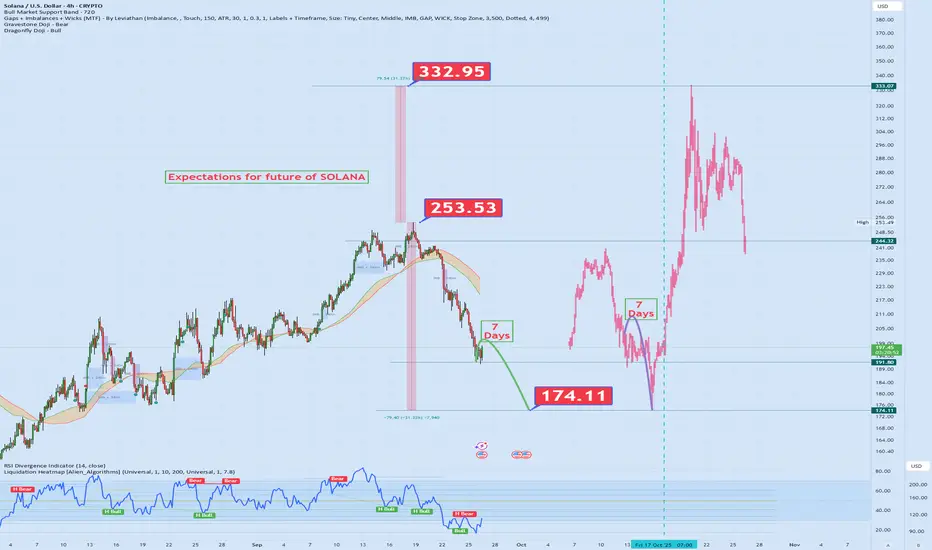
SOLANA Technical Analysis & My ProjectionI've combined past price action with future possibilities on the SOL chart. Here are the key highlights:
🚀 Peak Level: 332.95 📉 Correction Zone: 253.53 🛑 Support Area: 174.11
📍 Supported by RSI and moving averages, the red line represents my personal expectation. It points to a potential recovery and a new bullish trend. 💥
🔁 I’ve mapped out scenario-based planning using historical price behavior—now my eyes are on that red trajectory! 💡 Technical analysis + intuition = strategic positioning!
📌 What do you think? Will this scenario play out? Drop your thoughts below! 👇
Solana coin up another 60% Whats next In this video I recap our previous video calling for a pullback into $150 with a target of $240 which has now been fulfilled .
The question is whats next from $240, we are top heavy and despite market structure still bullish I anticipate a move up to fill the single prints at $245/250 before a healthy pull back into $200 zone .
I also recap Bitcoin and the ETH /BTC pair
Take the trades level by level and plan ahead . Enjoy

SOL RSI Reset & SupportsWe are experiencing a painful but necessary pullback to reset our RSI and start with a fresh sleeve. I would like to outline the critical supports we have on the daily chart.
1. 100 day MA - 194 USD
2. 200 day MA - 180 USD
3. 0.382 fib level - 164 USD
From looking at the RSI I would deem the 194 level as most likely, however breaking that support would lead to a further downtrend. DYOR and let me know your thoughts

SOLUSDT ShortedWe saw a free fall for SOLUSDT, which can touch around 210-20,5, taking a short position with a risk of 10$ and RR of 1:4. Risk Management is more important than trading RM first trading next

Sol continue bearishour previous set up has made some good profits , and the selleer are continuing the trend, let's set an new take profits by the next key zone , don't hold on your solana if you have any

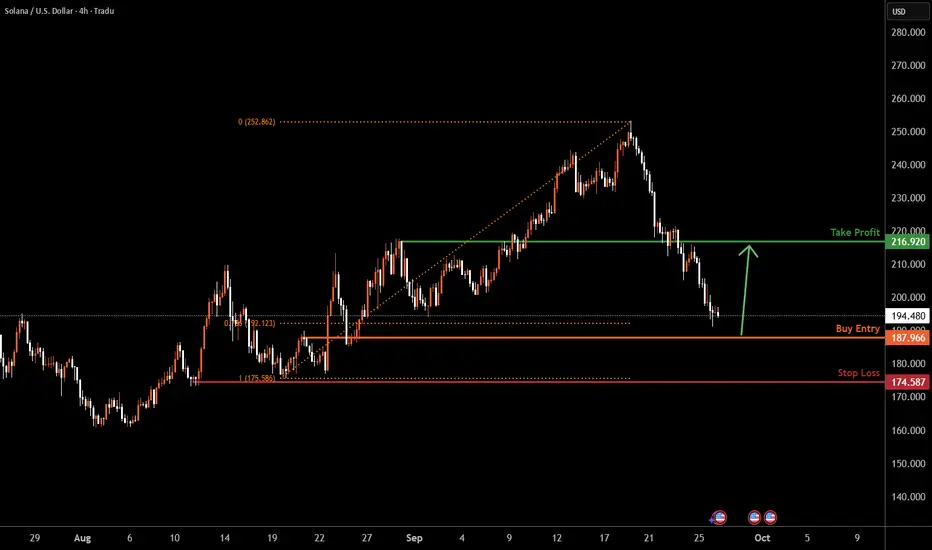
SOLUSD H4 | Could we see a bullish reversal?Based on the H4 chart analysis, we could see the price fall to the buy entry which is an overlap support that is slightly below the 78.6% Fibonacci retracement and could bounce from this levle to the upside.
Buy entry is at 187.96, which is an overlap support that is slightly below the 78.6% Fibonacci retracement.
Stop loss is at 174.58, which is a pullback support.
Take profit is at 216.92, which is a pullback resistance.
High Risk Investment Warning
Trading Forex/CFDs on margin carries a high level of risk and may not be suitable for all investors. Leverage can work against you.
Stratos Markets Limited (tradu.com ):
CFDs are complex instruments and come with a high risk of losing money rapidly due to leverage. 65% of retail investor accounts lose money when trading CFDs with this provider. You should consider whether you understand how CFDs work and whether you can afford to take the high risk of losing your money.
Stratos Europe Ltd (tradu.com ):
CFDs are complex instruments and come with a high risk of losing money rapidly due to leverage. 66% of retail investor accounts lose money when trading CFDs with this provider. You should consider whether you understand how CFDs work and whether you can afford to take the high risk of losing your money.
Stratos Global LLC (tradu.com ):
Losses can exceed deposits.
Please be advised that the information presented on TradingView is provided to Tradu (‘Company’, ‘we’) by a third-party provider (‘TFA Global Pte Ltd’). Please be reminded that you are solely responsible for the trading decisions on your account. There is a very high degree of risk involved in trading. Any information and/or content is intended entirely for research, educational and informational purposes only and does not constitute investment or consultation advice or investment strategy. The information is not tailored to the investment needs of any specific person and therefore does not involve a consideration of any of the investment objectives, financial situation or needs of any viewer that may receive it. Kindly also note that past performance is not a reliable indicator of future results. Actual results may differ materially from those anticipated in forward-looking or past performance statements. We assume no liability as to the accuracy or completeness of any of the information and/or content provided herein and the Company cannot be held responsible for any omission, mistake nor for any loss or damage including without limitation to any loss of profit which may arise from reliance on any information supplied by TFA Global Pte Ltd.
The speaker(s) is neither an employee, agent nor representative of Tradu and is therefore acting independently. The opinions given are their own, constitute general market commentary, and do not constitute the opinion or advice of Tradu or any form of personal or investment advice. Tradu neither endorses nor guarantees offerings of third-party speakers, nor is Tradu responsible for the content, veracity or opinions of third-party speakers, presenters or participants.
Solana Wave Analysis – 25 September 2025
- Solana broke support area
- Likely to fall to support level 187.20
Solana cryptocurrency recently broke the support area between the key support level 210.00 (former resistance from August), support trendlines of the 2 up channels from July and August and the 50% Fibonacci correction of the upward impulse from August.
The breakout of this ssupport area accelerated the active short-term ABC corrective wave iv from the middle of September.
Given the strong bearish sentiment seen across the cryptocurrency markets today, Solana cryptocurrency can be expected to fall to the next support level 187.20.

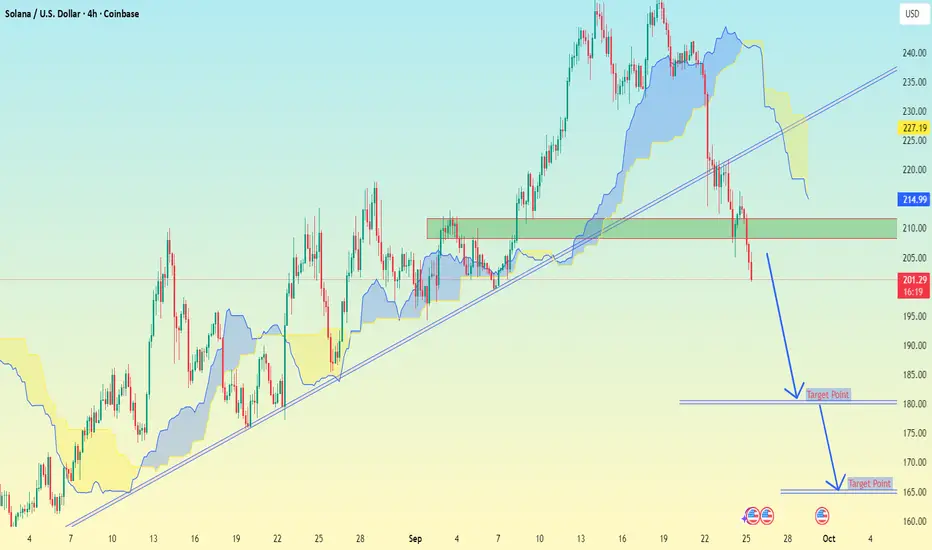
Solana (SOL/USDT) on the 4H timeframe.Solana (SOL/USDT) on the 4H timeframe.
From My setup:
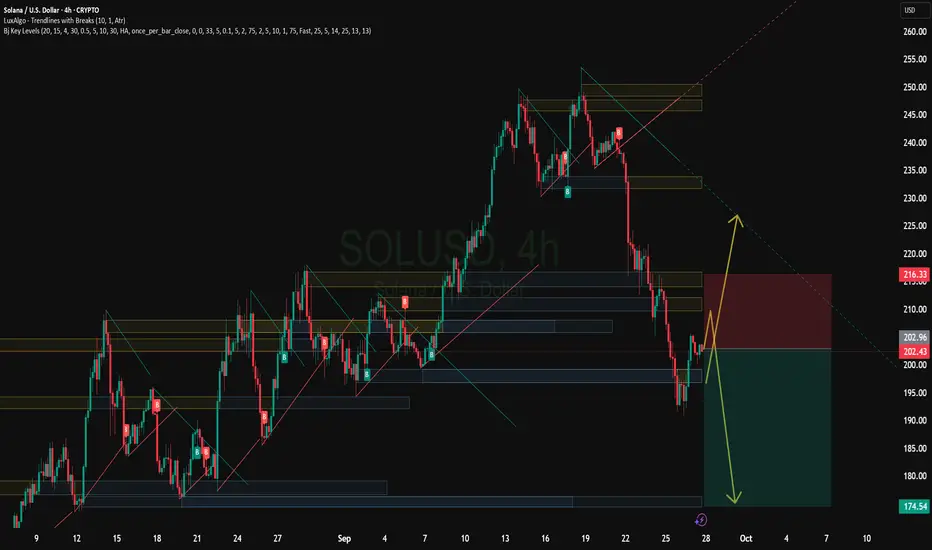
Price has broken below the ascending trendline and the green support zone (~214–210).
MY marked two downside target points.
📉 Target levels on chart:
1. First target: around 185
2. Second target: around 165–167
So, if SOL continues bearish momentum after this breakdown, the chart suggests:
Initial support/target near 185
Deeper target zone near 165
Solana - Is the Bull Run Over?If we zoom out a bit, since SOL bottomed on April 7th and then rallied, we have had three significant retracements.
The first was 33%, the second was 24%, and this one so far is 21%.
This retracement might feel like a big thing, but it’s not that big of a deal if we zoom out.
From that perspective, this is not a major concern; we could even have expected it, in my opinion. I think we will pump again soon!

SOLUSD H4 | Bearish dropSolana (SOL/USD) has rejected off the sell entry which is a pullback resistance and oculd potentially drop from this level to the downside.
Sell entry is at 217.255, which is a pullback resistance.
Stop loss is at 231.317, which is a pullback resistance.
Take profit is at 188.19, which acts as an overlap support.
High Risk Investment Warning
Trading Forex/CFDs on margin carries a high level of risk and may not be suitable for all investors. Leverage can work against you.
Stratos Markets Limited (tradu.com ):
CFDs are complex instruments and come with a high risk of losing money rapidly due to leverage. 65% of retail investor accounts lose money when trading CFDs with this provider. You should consider whether you understand how CFDs work and whether you can afford to take the high risk of losing your money.
Stratos Europe Ltd (tradu.com ):
CFDs are complex instruments and come with a high risk of losing money rapidly due to leverage. 66% of retail investor accounts lose money when trading CFDs with this provider. You should consider whether you understand how CFDs work and whether you can afford to take the high risk of losing your money.
Stratos Global LLC (tradu.com ):
Losses can exceed deposits.
Please be advised that the information presented on TradingView is provided to Tradu (‘Company’, ‘we’) by a third-party provider (‘TFA Global Pte Ltd’). Please be reminded that you are solely responsible for the trading decisions on your account. There is a very high degree of risk involved in trading. Any information and/or content is intended entirely for research, educational and informational purposes only and does not constitute investment or consultation advice or investment strategy. The information is not tailored to the investment needs of any specific person and therefore does not involve a consideration of any of the investment objectives, financial situation or needs of any viewer that may receive it. Kindly also note that past performance is not a reliable indicator of future results. Actual results may differ materially from those anticipated in forward-looking or past performance statements. We assume no liability as to the accuracy or completeness of any of the information and/or content provided herein and the Company cannot be held responsible for any omission, mistake nor for any loss or damage including without limitation to any loss of profit which may arise from reliance on any information supplied by TFA Global Pte Ltd.
The speaker(s) is neither an employee, agent nor representative of Tradu and is therefore acting independently. The opinions given are their own, constitute general market commentary, and do not constitute the opinion or advice of Tradu or any form of personal or investment advice. Tradu neither endorses nor guarantees offerings of third-party speakers, nor is Tradu responsible for the content, veracity or opinions of third-party speakers, presenters or participants.

solana to the depthsthere is a scenario where we could go for an sfp, but there have been many within this higher time frame one, so not sure if it'll come again before heading lower

Long Swing Entry OpportunitySolana still performing as a strong beta play to Ethereum. This pull back is steep but hitting all the right zones for a long entry (log trend line and EMA bands). The Steepness of the recent pullback I attribute to fairly large liquidation of over levered longs exploited in a bear attack to force a long squeeze, uncorrelated to a change in the fundamental market sentiment for Solana.

SOL going bearishlet's see how the market sentiment is shifting bearish ; the next key level is around 209 and 206 if it keeps going bearish the retracement might follow

SOL/USD – Weak Below SMA200🔴 SHORT under $212 – target $205
Solana trades at $210, capped far below SMA200 ($217.6). Resistance at $217–221, support at $205. RSI at 47, neutral but unable to recover momentum. Trend remains bearish while under $217.
📖 Keywords: #SOLUSD #Solana #Altcoins #CryptoBearish

Sol analysis Hi traders as you can see we are in uptrend I've been moving with it n counter the pull backs,my target remain 300,look for entry from 198 to 210 with a liquidation of 180 for possible 300 n new ATH as always you know we dont control the market by that we risk responsibly n use proper money management i wish you all the best Q4 is around the corner buy each n every dips.