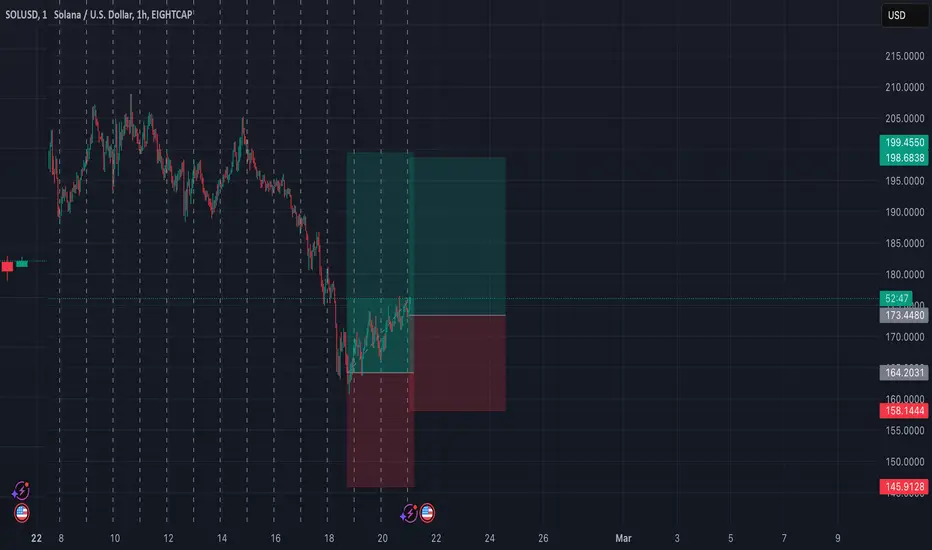
Solana 2-21🔥 Market Overview:
Trend: Solana is in an uptrend, trading above the 200 EMA and showing strong bullish momentum.
Key Levels:
Resistance: $176.50 – Next key level to break for further upside.
Support: $173.90 – 200 EMA acting as a solid floor.
Indicators:
EMA 200: Price is well above, confirming an uptrend.
MACD: Bullish crossover, indicating further upside potential.
RSI: 63 – Slightly overbought, but still has room for growth.
🔥 Scalping Strategy:
🩸 1. Momentum Scalping
Buy near: $174.50, targeting $176.50.
Sell near: $176.50, targeting $177.50.
Stop-loss below: $173.50.
🩸 2. EMA Scalping
Long entries near: 200 EMA ($173.90).
Exit at: $176 resistance.
🩸 3. Breakout Scalping
If Solana breaks $176.50, go long toward $180.00.
🔥 Mid-Term Trend Forecast (1-3 Weeks):
If Solana holds above $173.90, expect a move toward $180+.
A drop below $173.50 could lead to a retrace toward $170.
🔥 News & Market Context:
No major bearish catalysts—Solana continues to gain institutional interest.
Bitcoin’s trend will play a role in Solana’s next move.
Strong volume suggests continued bullish pressure.
🔥 Decision:
🩸 Short-term: Favor scalping longs while above $173.90.
🩸 Mid-term: Needs a breakout above $176.50 for more upside.
🩸 Ideal Play: Buy dips, aim for $180.00.
👑 Final Verdict:
Solana remains bullish above $173.90. The trend is strong, and scalping longs are favored. Break $176.50, and the next stop is $180+.
🔥 "Dominate the trend, or be crushed by it. Strength is in movement, hesitation is defeat." 👑
Trade ideas

$SOL RSI Fully Reset! Could Very Well Have Seen the BottomI’ve been waiting a few days before posting an update on CRYPTOCAP:SOL to see if it forms a cluster that mimics the fractal before the Trump Pump.
So far it has been playing out perfectly.
I still think we might have a wick at the very least to retest $155, but it does not necessarily have to happen as we’ve already have some confirmed price action in that region.
Main target is reclaiming the DMA9 and then prior Trend.
The RSI has FULLY RESET, so we could very well have seen the bottom here.

SOL - 20 FEB 2025SOL is a must buy dont you think? LOL just need psotive trend conditions to go 2x long with significant capital

Solana Scaleup Trade 2 AddedUse proper risk management
Looks like good trade.
Lets monitor.
Use proper risk management.
Disclaimer: only idea, not advice.
Solana Bullish Megaphone PatternKey backtest of the previous bullish symmetrical triangle now which could be forming a bullish megaphone pattern.
ETF coming, staking on ETF coming, bullish crypto regs, SOL remains # 1 chain. See you at $450 target of this pattern.

Solana Wave Analysis – 20 February 2025
- Solana reversed from the support zone
- Likely to rise to the resistance level 186.60
Solana cryptocurrency recently reversed up from the support zone between the support level 165.65 (the previous monthly low from January) and the lower daily Bollinger Band.
The upward reversal from this support zone will likely form the daily Japanese candlesticks reversal pattern Morning Star – if Solana closes today near the current levels.
Given the strength of the support level 165.65, Solana can be expected to rise to the next resistance level 186.60 (former support from the start of February).

SOL Possible push past ATHSOL has now on the weekly pushed past ATH, and has now tested support directly after this has happened. This could be a possible sniper entry time period. 'Not now' but maybe soon. Keep in mind a double top also just happened. Room for both ways as per usual. Fundamentals are there in terms of the capability (other then SOL slowness compared to the XRPL) NFTs are popping on SOL due to little to no fees so on, loads of great projects, with room for much improvement on fundamentals and technical / price. Altcoin market is soon to come!

SOL expanding megaphone last bottom rail touch completeCoincides with another backtest of the bull flag
Not financial advice
Looks good

Could Solana be finally reversing on the upside?COINBASE:SOLUSD has been a nightmare and has fell significantly in past few days, much more than #BTC and #ETH relatively.
But I can see a potential leading diagonal (3-3-3-3-3) rise. It the retracement of it holds above/around 61.8% which also happens to be the wave 4 low (165.945) then the next leg up should start which would give more insight into whether this is really an impulse up in progress or just another corrective leg.

SOL - Daily OversoldSol could be primed for a bounce.
Historically when it reaches oversold on the daily timeframe we have seen strong bounces follow (green circles).
We are at oversold level right now on the daily which means if we get a bounce from this level it will be the first sign of a another low being set. Sol also printed a daily doji which could signal a reversal will start soon.
If we catch a bid here the first major level to watch will be $188-$192. This was the bottom of our bear flag (orange triangle) that acted as our support level. Since price broke down from the bear flag, coming back to retest it could act as a level of new resistance. However, if we can reclaim that level of support then we should be able to rally back to the $217 level followed by $240+.
One other thing to keep in mind is the large unlock happening in March. This is one of the main reasons it has been so heavily shorted which gives credibility to a potential short squeeze sending us to the $190 level. But if sellers come back in at that level before the unlock, wait for the selloff to look for new bids.

Solana Scalping + Forecast (2-19)🔥 Market Overview (SOL/USD):
Trend: Solana is currently in a bearish correction after a strong rally, testing critical support levels.
Key Levels:
Resistance: $202
Support: $165
Indicators:
EMA 9 ($184) acting as short-term resistance.
EMA 200 ($189) is a key trend-defining level.
MACD: Bearish on the daily chart, with momentum weakening further. Lower timeframes indicate possible consolidation before a move.
🔥 Scalping Strategy:
🩸 1. Range Scalping (Low-Volatility Play)
Buy near: $165, targeting $175
Sell near: $175, targeting $165
Stop-loss below: $162
🩸 2. Breakout Scalping (For a Larger Move)
Long above: $180 → Target: $190
Short below: $160 → Target: $150
🩸 3. EMA 9 Scalping (Intraday Bounces)
Look for price reactions around the EMA 9 for short-term reversals.
🔥 Mid-Term Trend Forecast (1-3 Weeks):
Solana is testing its 200 EMA, which is a crucial level for trend direction.
If price fails to reclaim $189, a deeper correction to $150 is likely.
A strong reclaim of $190+ would confirm bullish continuation.
🔥 News & Market Context:
Solana's DeFi ecosystem growth continues to attract capital.
Market-wide risk sentiment is cautious, adding pressure to alts.
Increased whale accumulation near key support levels signals possible reversals.
🔥 Decision:
🩸 Short-term: Range scalping is the safest play inside consolidation.
🩸 Mid-term: Watch for either a breakout above $190 or a deeper correction below $160.
🩸 Ideal Play: Accumulate cautiously near $165, but be ready for volatility.
👑 Final Verdict:
Solana is at a critical point. Bulls need to reclaim $190+ for momentum. Otherwise, a deeper correction remains on the table.
🔥 FinCaesar’s Words of Power:
"The strongest castles fall when their foundation is weak. Strengthen your position before the real battle begins."

$SOLUSD Heading to $100 I am excited to see COINBASE:SOLUSD heading to retest $100. What a great buying opportunity that will be. Ideal I would love to see COINBASE:SOLUSD at $9, but I feel that boat has sailed.


ICT TA Daily view, we are in a Fib golden zone + OB!We have reached a Golden Fib retracement Zone , With a an OB in that Zone too + VFG1 . and thar happened after positive BOS!
We need to see a strong reaction there, with good volume to go up!
Internal structure is showing reversals, but waiting for External Structure to confirm .
Over all, we are still in a bullish bias, this is a good area to start buying, but confirming a stronger signal is better to wait a daily candle closes above 209$ .
We can buy from here, and if continued to go down, the second buy Zone is between (82 to 105$)
Keep in mind this is daily analysis, don't leverage or over leverage!
and this is Technical Analysis, however Crypto could not follow over TAs, spicily if market updates on Fundamentals showed something.

SOLANA: Buy ideaOn SOLANA we would have a hight probability to have an uptrend after the breakout with force the resistance line by the buyers.

I am buying spot at this levelMy overall bias for Solana is bullish.
Solan price is dropping significantly at the moment probably due to Libra token. (just my guess).
I have set buy orders at $130-145 area. I don't usually buy the dip, but this might be worthwhile buy the dip opportunity.
