SOL Daily Outlook | December 3, 20251H Market Structure Overview
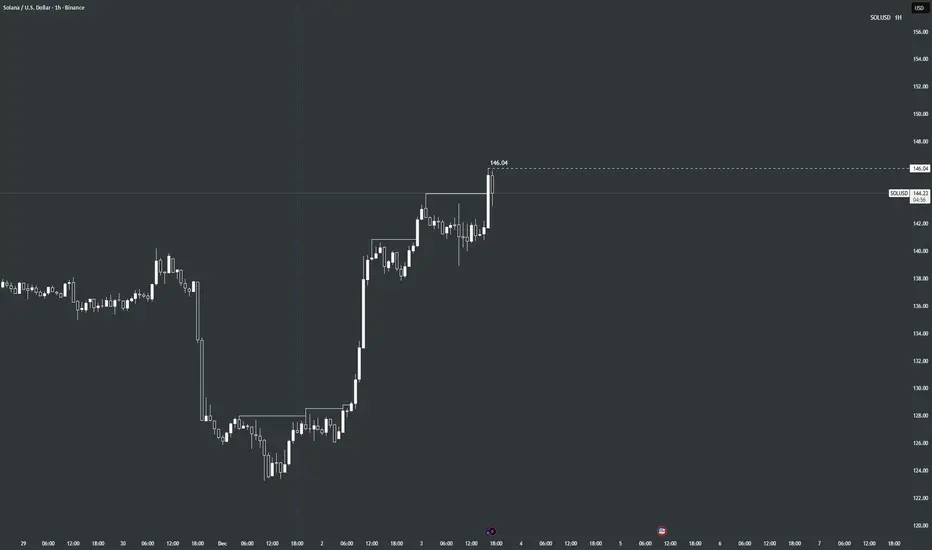
Solana is maintaining bullish structure on the 1H timeframe. After reversing strongly from the $128–$130 zone, price has continued forming higher highs and higher lows, showing consistent upward momentum.
Price is currently pushing into the previous high at $146.04, but we have not broken above that level yet. Structure is still bullish, and the current impulse suggests buyers are trying to take out that high next.
Bias
Bullish — expecting a break above $146.04 as long as the most recent higher low holds and structure remains intact.
What We Want to See Next
A clean break above $146.04, followed by a controlled correction to confirm continuation. If SOL clears that level, the next upside objectives sit toward the $148–$150 region in the upcoming days/weeks.
Trade ideas
SOL — WEEK 49 TREND REPORTSOLUSD — WEEK 49 TREND REPORT
Ticker: COINBASE:SOLUSD — 12/02/2025 @ 139.43$
Timeframe: WEEKLY
This is a reactive structural classification of SOL based on the weekly chart as of this timestamp. Price conditions are evaluated as they stand — nothing here is predictive or forward-assumptive.
⸻
1) Current Trend Condition
• Trend Duration: +8 weeks (Bearish)
• Trend Reversal Level (Bullish): 179.71$
• Trend Reversal Level (Bullish Confirmation): 187.51$
⸻
3) Temperature :
Cooling Phase
⸻
4) Momentum :
Bearish
⸻
Author’s Note
This analysis is fully reactive, not predictive. Market conditions, trend structure, and behavior are classified as they appear in real time. The objective is to identify where directional shifts first occurred, where structural integrity remains intact, and where it would begin to weaken if key levels were breached.
Predictive analysis projects outcomes that do not exist yet. Without price confirmation, prediction is built on baseless assumptions. This framework avoids that entirely by responding only to verified structural changes and live conditions.
The levels shown simply identify where the current trend structure first shifted and where it would begin to lose integrity if breached. Recognizing these boundaries allows for clearer interpretation of market behavior without relying on forward guarantees, speculative projections, or unsupported assumptions.
⸻
Methodology Overview
This classification framework evaluates directional conditions using internal trend-interpretation logic that references price behavior relative to its structural layers. These relationships are used to identify when price movement aligns with the framework’s criteria for directional phases, transition points, or regime shifts. Visual elements or structural labels reflect these internal interpretations, rather than explicit trading signals or preset indicator crossovers. This framework is observational only and does not imply future outcomes.

SOL/USD 4H Analysis: Testing Initial ResistanceSOL/USD 4H Analysis: Testing Initial Resistance
• Powerful Rebound: Solana is currently showing a robust rally (large green candle), bouncing sharply after testing the confluence of the $120 Recent Support (green zone) and the lower boundary of the Downtrend Channel (red area).
• Initial Challenge: The immediate focus for this bounce is to decisively break and close above the $146 to $148 Previous Support level, which now acts as the first major overhead resistance.
• Downtrend Pressure: The price remains technically under pressure from the macro–Downtrend Channel that originated from the $175 Strong Resistance (red zone), though the latest action is attempting to invalidate it.
• Key Levels Ahead: A successful break above $148 would open the path to challenge the next resistance zone at $160 to $165 Key Zone. Conversely, a failure to sustain the rally would see the price retreat back to the $120 Recent Support.

SOL Daily Outlook | November 30, 2025Timeframe
1 Hour (1H)
EMAs Used
5 EMA
10 EMA
50 EMA
Market Structure
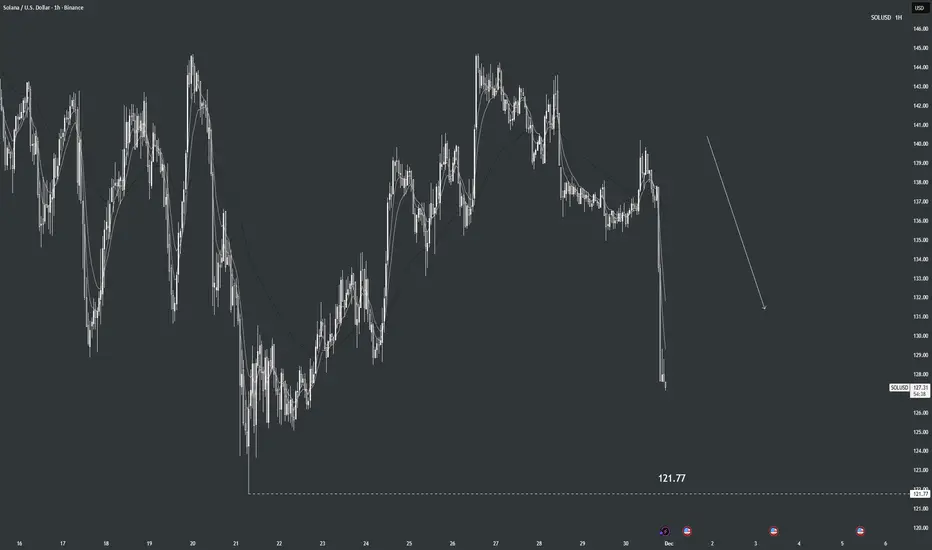
SOL has shifted into a bearish impulse–correction sequence on the 1H chart. Price broke structure to the downside and followed with a sharp impulse lower. The recent correction has failed to reclaim previous highs, and the 5, 10, and 50 EMAs are now aligned bearishly, supporting continued downside movement.
What I Want to See
I want to see SOL continue this bearish sequence, using any smaller corrections as fuel for the next impulse down.
Bias
Bearish.
BTC ETH SOL MSTR The Bounce Seems To Be OverRemember that Socrates analysis has daily closings at 6pm Eastern Time and Weekly closing on Friday at 6pm. It appears that November 28th was an important HIGH, Socrates is pointing to a likely resumption of the downtrend for the next 3 weeks, which price action should begin to confirm in the next 2 days or so however, price action will do what it will do, meaning that if by Wednesday price action continues to push strongly higher then we should immediately turn BULLISH but, I'm betting that the price will resume its downward trajectory starting around December 2nd.
Now for much better news for crypto: BTC, ETH and SOL have generated a new channel lines from the HIGH on November 28th which implies a more sideways trajectory to an eventual important LOW in mid-December. I suspect that for BTC the bottom support of the long-term up-trend channel around +$70k will probably hold by mid-December which should give us a very strong rally into February.
As for MSTR, this coming week is a WEEKLY PANIC CYCLE which implies that this coming week should open higher than last week and close the week BELOW the prior week, in other words, a move back down to around 167 by end of this coming week.

SELLS STILL STRONG..By 30mins time, if that candle stays red, we keep pushing this pair downwards
🍏✨🍏
*TRUST THE SYSTEM*

sol usdHI GUYS,
SOL does not accurately follow BTC esp if u are using previous highs and lows for limit order entries be it buy or sell.
However it does respect price pattern within the days of the week.

bullish momentum solana is in a symtric triangle . entry between 134.8 and 135.3 stop loss 133 tp 144 good luck

Solana: Is the Bottom In, or More Downside Ahead? SOL has already climbed more than 15% from last Friday’s low at its peak, potentially signaling the completion of wave ii in orange. For now, however, we’re still keeping open the possibility that this move could dip to a new low—within our green Target Zone ($155.80–$113.20). In any case, once this interim correction wraps up, wave iii in orange should kick off an impulsive rally, only losing steam above resistance at $295.31.

SOL Daily Outlook | December 12, 2025SOL Daily Outlook | December 12, 2025
1H Market Structure Overview
Solana has pulled back sharply after failing to hold above the recent highs near the $139–$140 area. On the 1H timeframe, price has transitioned into bearish structure, printing a lower high followed by a strong impulse down. Price is now consolidating just above the $130.42 support level, which is acting as a critical inflection point. The inability to reclaim prior structure suggests sellers remain in control unless this base holds and structure shifts.
Bias
Bearish on 1H — downside favored while price remains below the prior highs and below declining EMAs. Bias can shift if price holds $130.42 and begins forming higher lows with acceptance back above short-term structure.
What We Want to See Next
Bullish scenario:
Price holds above $130.42 and forms a higher low on the 1H. A reclaim of $133–$135 could open the door for a move back toward $138–$140, with continuation possible if structure flips bullish.
Bearish scenario:
A clean break and acceptance below $130.42 would confirm continuation of bearish momentum. In that case, downside targets open toward the $123–$125 support zone, with further weakness likely if sellers maintain control.

$SOL Stuck In ConsolidationSolana has been stuck in this consolidation range the past month ~$125 - 145
Truly an infliction point for CRYPTOCAP:SOL
a break in either direction should be massive upside or downside.
HOPIUM: bullish divergence appears to be forming on the RSI
Solana Breakpoint just kicked off today, but the market showed very little interest.
Bulls need a huge injection here.
SOLANA 2H Bearish UPDATE - 121 mark is already BreachedSOLANA is still under big selling pressure.
We have 4 ascending channels making up the steady yet obvious descent of the chart to lower & lower levels.
On the other hand, we have also a descending channel well respected on its outer boundaries.
The chart experienced upper deep pull backs but they remained "pull backs" and did not convert into any clear upward trend.
Blue channel 1 broken and retested twice.
Purple channel 2 broken.
Green channel 3 broken and retested once & final time .
Orange channel 4 broken today @ 2 am.
The upper Red resistance line of the downward channel has proven to be unbreachable, with 2nd & 3rd rejections as Fake Breakouts .
In simple terms: The chart has already breached the lowest bottom of 121 of NOV 21.
We have 3 potential scenarios as seen on the chart, yet one clear outcome.
Of course, we expect possible "strong fake" upward moves within the final descent.
Safe Trade.

$SOL Long IdeaPrice swept sell-side liquidity and then broke structure to the upside, confirming a bullish shift. After the break, price pulled back to the 0.70 Fibonacci level, which also lines up with a fair value gap on the 1H/4H timeframe. This retracement into support gives a clean long setup as price respects bullish structure.

Solana Buy Now 1 : 3 RRit's time for another spike on solana baaby , give it a full motion , higher high are confirming the bullish momentum

Solana : Value Buying AvailableThis is base formation.
Accumulation phase of Solana.
CMP : 139.24
Investment Opportunity.
Add if decline 121-113 Levels.
SL : 99
Target : 302++ Review.
Manage your Risk and Proper Risk control.

sol usdHI GUYS,
SOL is beautifully following its boss BTC
I expect buys tomorrow
NOTE
The trading duration is almost running out as illustrated 8 days and 7 hours is what i had from the start on btc.

Solana Bullishthe red stick is your parametrer to enter the trade , once price cross over it , take you position as the market is already showing a bullish momentum

SOL Rejected from 150 – Failing to Reclaim StructureAfter flipping MSB at 170, Solana failed to maintain bullish structure and rolled over. The 130–140 zone has held as a floor, but RSI is flatlining below 50 and MACD is fading again.
Price remains trapped under stacked OB zones between 180 and 240. No bullish follow-through yet — lower high scenario still valid.
A break under 130 would confirm further downside.
Bias: Bearish
Pair: SOL/USDT
Timeframe: 12H

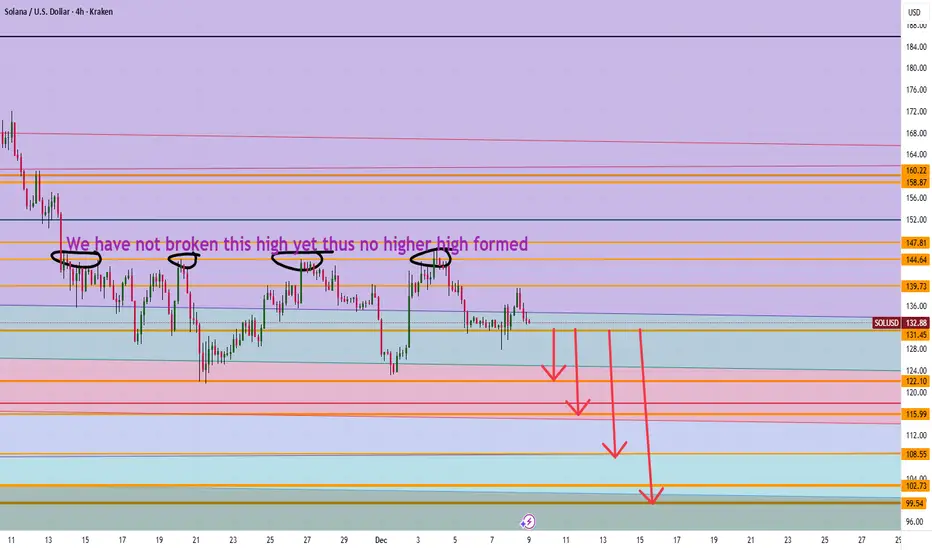
Is Solana heading to $100 It appears we have not made new higher highs in price action on the 4 hour and thus a possible movement down to $108 then 100 levels make sense. However if we can break 139 level then 147 can make sense going up.
Trade Smarter Live Better
Kris
Global Currency StabilityUnderstanding Its Dynamics, Drivers, and Implications
Currency stability is a cornerstone of global economic health. When currencies maintain predictable value relative to one another, international trade, investment, and economic planning become more efficient and less risky. Conversely, volatile or unstable currencies can disrupt markets, reduce investor confidence, and strain national economies. Global currency stability refers to the overall steadiness of major currencies across countries and regions, which plays a vital role in maintaining economic growth, promoting trade, and fostering international financial confidence.
1. The Concept of Currency Stability
Currency stability is often defined by the minimal fluctuations in a currency’s exchange rate over time. A stable currency has predictable purchasing power both domestically and internationally. This stability allows businesses and governments to make long-term financial decisions with greater confidence. Central to the concept is exchange rate stability, which indicates the relative value of one currency compared to others. Stability reduces uncertainty in international transactions, investment flows, and cross-border trade contracts.
Currencies can be stable in nominal terms, meaning their exchange rate relative to another currency does not fluctuate excessively, or in real terms, which takes into account domestic inflation rates. Both forms of stability are crucial, as a nominally stable currency experiencing high domestic inflation may still lose purchasing power and create economic uncertainty.
2. Factors Influencing Global Currency Stability
Currency stability is determined by a combination of domestic and international economic factors. Some of the primary drivers include:
a. Monetary Policy: Central banks play a key role in maintaining currency stability through interest rate adjustments, open market operations, and foreign exchange interventions. A credible and transparent monetary policy can stabilize a currency by controlling inflation, supporting investor confidence, and ensuring liquidity in financial markets. For instance, the Federal Reserve in the United States or the European Central Bank employs policy tools to manage the value of their currencies, indirectly impacting global stability.
b. Fiscal Policy and Government Debt: Governments influence currency stability through their spending and borrowing patterns. Excessive public debt or budget deficits can weaken confidence in a currency, leading to depreciation and volatility. Conversely, responsible fiscal management enhances credibility, attracting foreign investment and supporting stable currency conditions.
c. Trade Balances: Countries with consistent trade surpluses often experience currency appreciation, while persistent trade deficits may lead to depreciation. A balanced trade scenario contributes to predictable currency values and reduces the risk of sudden shifts caused by external imbalances.
d. Capital Flows: Cross-border investment flows, including foreign direct investment and portfolio investment, directly affect currency demand and supply. Sudden inflows can strengthen a currency, while abrupt outflows can trigger instability. Countries with robust capital markets and regulatory frameworks can better manage these fluctuations, contributing to global stability.
e. Political Stability and Governance: Political uncertainty, policy changes, or geopolitical risks can undermine confidence in a currency. Stable governments with transparent institutions are more likely to maintain consistent economic policies, supporting predictable currency values.
f. Global Economic Conditions: Events such as global recessions, commodity price shocks, and financial crises influence currency stability. For example, a decline in oil prices may weaken oil-exporting countries’ currencies, impacting broader trade and investment networks.
3. The Role of Major Currencies in Global Stability
Certain currencies, often referred to as reserve currencies, play a disproportionate role in global stability. The US Dollar (USD), Euro (EUR), Japanese Yen (JPY), and recently, the Chinese Yuan (CNY), are central to international trade, finance, and reserves. These currencies are widely used for cross-border transactions, denominating global commodities, and holding central bank reserves.
The stability of these major currencies directly affects global markets. A stable US Dollar, for instance, reduces transaction risk for international traders and investors. Conversely, volatility in these currencies can trigger ripple effects, affecting emerging markets, global trade pricing, and international debt servicing.
4. Mechanisms for Maintaining Currency Stability
Countries and international institutions employ multiple strategies to maintain currency stability:
a. Fixed and Managed Exchange Rate Systems: Some nations peg their currencies to a stable foreign currency, like the USD or EUR. Pegging provides predictability, reduces speculative volatility, and can anchor inflation expectations. Managed exchange rates allow limited flexibility while preventing extreme fluctuations.
b. Foreign Exchange Reserves: Central banks maintain reserves of foreign currencies to intervene in currency markets when excessive volatility occurs. By buying or selling their own currency or foreign currency, central banks can stabilize exchange rates temporarily or support longer-term credibility.
c. International Coordination: Organizations such as the International Monetary Fund (IMF) provide frameworks for stabilizing currencies through lending, policy advice, and financial monitoring. During crises, coordinated actions by multiple countries can prevent global contagion and stabilize volatile currency markets.
d. Monetary Policy Transparency and Credibility: Consistent communication and clear policy objectives reduce market uncertainty. Investors and traders can anticipate central bank actions, decreasing speculative attacks that could destabilize currencies.
5. Implications of Currency Instability
Unstable currencies have broad economic consequences:
Inflation and Purchasing Power Erosion: Rapid depreciation can increase import prices, fueling domestic inflation and reducing living standards.
Investment Hesitancy: Investors prefer predictable returns. Currency volatility can deter both domestic and foreign investment, slowing economic growth.
Trade Disruption: Unpredictable exchange rates complicate pricing, contract negotiation, and profit planning for exporters and importers.
Debt Servicing Risks: Countries with foreign-denominated debt face higher repayment costs if their currency weakens, potentially triggering defaults or fiscal crises.
6. The Interconnected Nature of Global Currency Stability
In today’s globalized economy, currency stability is not just a national concern but an international one. Global trade, financial markets, and capital flows are deeply interconnected. Instability in a major currency, such as the USD or Euro, can transmit shocks across multiple countries, especially emerging markets with weaker financial systems. Conversely, stable currency regimes promote confidence, facilitate trade, and support sustainable growth worldwide.
7. Challenges to Global Currency Stability
Despite mechanisms to maintain stability, several challenges persist:
Geopolitical Tensions: Conflicts, sanctions, and political instability can disrupt currency markets.
Speculative Attacks: Currency traders sometimes engage in large-scale speculation, causing sudden and severe exchange rate movements.
Emerging Market Vulnerabilities: Less developed financial systems may struggle to manage sudden capital flow reversals or external shocks.
Global Economic Shocks: Events like pandemics, financial crises, or commodity price collapses can trigger synchronized instability across multiple currencies.
8. Conclusion
Global currency stability is a fundamental pillar of international economic health. It ensures predictability in trade, investment, and financial planning, reducing systemic risk and fostering economic growth. Achieving stability requires coordinated monetary and fiscal policies, strong institutional frameworks, and proactive management of trade and capital flows. While challenges such as geopolitical uncertainty and market speculation persist, transparent and credible governance, combined with global cooperation, can support resilient currency systems. Stable currencies not only benefit individual nations but also underpin the smooth functioning of the global economy, enabling sustainable development and prosperity worldwide.

SOL USDHI GUYS
UPDATE ON SOL USD
I stopped providing scalp entries on every MOVE , for so many reasons one of them is to have a much clean chart. etc
This is what i expect around those areas on the RT H8, H4 CONTINUATION SELL PATH.
NOTE always follow btc for direction on all small stable coins

SOL Daily Outlook | December 6, 2025SOL Daily Outlook | December 6, 2025
1H Market Structure Overview
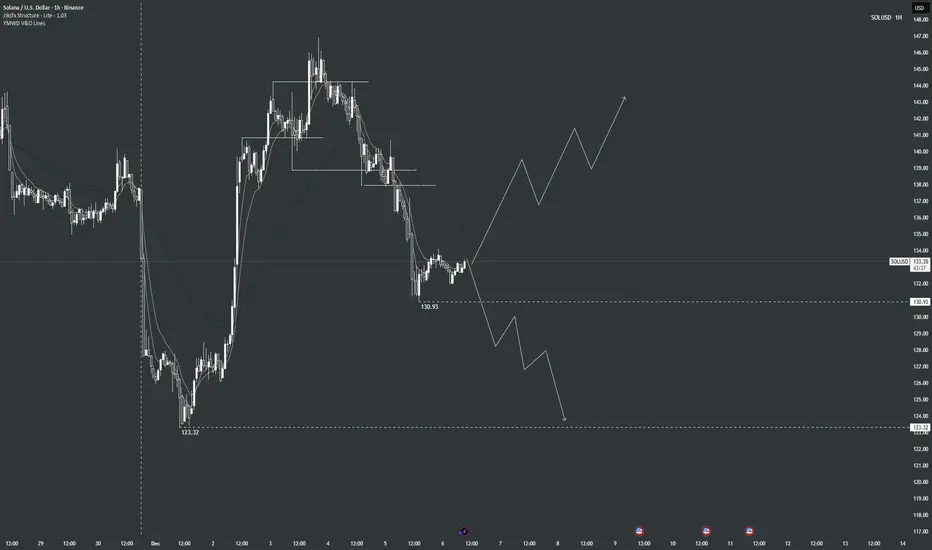
Solana is currently testing key support at $130.93 after pulling back from the previous highs near $146–$147. On the 1H timeframe, price is showing signs of bearish momentum with lower highs forming after the peak. Structure is at a critical point: a break below $130.93 would confirm further downside, while holding this level could allow for a reversal back toward previous highs.
Bias
Bearish on 1H — currently favoring the downside while watching the $130.93 support closely. Bias can change if price shows a strong bounce from this level and starts forming higher lows.
What We Want to See Next
Bullish scenario: Price holds above $130.93 and reverses higher, targeting $137–$143, with a potential retest of the $146–$148 area.
Bearish scenario: Price breaks below $130.93, confirming 1H bearish momentum, with the next key support at $123.32. If sellers remain in control, further downside could develop beyond this level.
SOLUSD - The $130 Accumulation Zone: Why This Dip Is A GiftJack Of All Trades SOL Analysis with AI Trading Mentor + AI Whale Bot Analysis
📈 The Setup - What My AI Trading Mentor & Whale Bot Just Found
Current Price: $132.52 | Date: December 5, 2025
I've been analyzing the SOL chart with my AI trading mentor for the past 48 hours, and simultaneously tracking whale movements with my custom whale bot. What we discovered is absolutely insane.
While retail traders are panic-selling this -4.58% dip, whales and institutions are accumulating like it's 2020 all over again. And they know something the market doesn't.
Let me show you what's REALLY happening behind the scenes.
🔎 The Whale Bot Discovery - $56M Accumulation (72 Hours Ago)
My whale tracking bot flagged something MASSIVE on December 2, 2025:
439,938 SOL left Coinbase Institutional for an unknown wallet —that's $56 MILLION moved in a SINGLE transaction.
This wasn't panic selling. This was strategic accumulation.
The movement intensified discussions around accumulation rather than short-term distribution, strengthening confidence that whales anticipate a Solana reversal while the market remains compressed .
But here's where it gets REALLY interesting...
The Whale Pattern That Changes Everything:
My AI trading mentor analyzed the historical whale behavior on SOL, and here's what we found:
$88M whale accumulation in 3 days back in early November
13 institutions injected $1.72B into Solana treasuries (1.44% of total supply!)
$39.65M negative netflow (coins LEAVING exchanges)
Translation? Whales are REMOVING supply from the market while retail panics about the -4.58% dip.
Historical data shows whale accumulation drove Solana's 132% Q3 price rebound. We're seeing THE EXACT SAME PATTERN right now at $130.
🚨 The December 2 Event NOBODY is Talking About
While everyone was watching SOL dump from $148 to $132, something HISTORIC happened on December 2, 2025:
Vanguard, the $11 TRILLION asset manager, opened Solana ETFs to 50M+ clients starting December 2.
Let me repeat that: $11 TRILLION.
Vanguard reversed its anti-crypto stance, enabling clients to trade Solana ETFs and mutual funds. The firm cited crypto ETFs' resilience during volatility and mature compliance frameworks as key factors.
Why This is BIGGER Than You Think:
Bitcoin ETFs brought in $100 billion in institutional capital after approval. Sol ana is now getting the SAME treatment.
Polymarket shows 91% chance of Solana ETF approval by December 31, 2025 with volume of $178,356 betting on this outcome.
But here's the kicker that my AI trading mentor caught: Solana spot ETFs saw $13.55M net outflow on December 1, BUT Bitwise's BSOL ETF had $17.18M INFLOW.
What does this mean?
Retail is selling. Institutions are buying. Classic wealth transfer setup.
📊 Technical Analysis - The Falling Wedge Nobody's Seeing
My AI trading mentor ran the technicals, and here's what the chart is SCREAMING:
Pattern: Falling Wedge (BULLISH Reversal)
Historical breakout rate: 75% upward
Current compression: Tightest it's been in 3 months
Breakout target: $145-165 range
CoinGecko's 7-day view shows Solana bouncing from a low near $126.75 on Tuesday to about $141.65, with today's move alone adding roughly $14.64 in 24 hours .
That bounce happened EXACTLY when?
December 3 ONE DAY after Vanguard opened SOL ETFs.
Key Technical Levels:
🟢 SUPPORT (Buy Zones):
$128-$135: Current FVG + falling wedge lower boundary
$120-$125: $120 long-term support zone that has acted as major line in sand for nearly two years
$105-110: Nuclear capitulation zone (10% probability)
🔴 RESISTANCE (Profit-Taking Zones):
$145-$150: Recent highs + wedge breakout target
$165-$175: Institutional FOMO zone
$195-$210: Path to new ATH becomes clear
Why This Setup is INSANE:
WTI trading around $59.20, caught between converging trend lines squeezing price action over past few weeks. Break above triangle resistance could trigger rally.
Wait, that's oil. Let me correct that—SOL is showing the EXACT same compression pattern.
SOL is still about 57% below its all-time high of $295.83 and is only recently rebounding from key $120 long-term support zone.
Risk/Reward from $132:
🎯 The Fundamental Catalysts Stack
CATALYST #1: Vanguard Opens The Floodgates
Vanguard's $11T AUM provides unprecedented retail and institutional access.
But here's what my AI trading mentor calculated: If just 0.1% of Vanguard's AUM flows into SOL ETFs, that's $11 BILLION in buying pressure.
Current SOL market cap? $79 billion.
That would be 14% of the entire market cap as NEW demand.
What would that do to price? You do the math.
CATALYST #2: Institutions Are Going ALL-IN
13 institutions injected $1.72B into Solana treasuries, leveraging 7-8% staking yields.
But here's the part that blew my mind: Sharps Technology and Upexi Inc. lead this trend, allocating $445.4M and $260M, respectively.
These aren't crypto-native firms. These are TRADITIONAL COMPANIES moving into SOL.
FalconX and Wintermute purchased 44,000 SOL worth $8.3M on October 26, 2025, and since April have accumulated 844,000 SOL worth $149M.
Pattern? Institutional accumulation is ACCELERATING, not slowing.
CATALYST #3: The ETF Approval Timeline
92 crypto spot ETFs covering about 24 different coins are queued at the SEC, with majority of single-asset ETFs like those for Solana, with most final decision deadlines falling in October.
Wait, October already passed. What happened?
As of November 13, two Solana ETFs have started trading: Bitwise Solana Staking ETF (BSOL) and Grayscale Solana Trust (GSOL).
SOL ETFs are ALREADY LIVE!
JPMorgan expects Solana ETFs to see about $1.5B in first-year inflows.
That's $1.5B of guaranteed buying pressure over the next 12 months.
CATALYST #4: Network Fundamentals Are INSANE
According to Electric Capital, Solana ranked second only to Ethereum for new developer inflows in 2025, attracting over 11,500 new developers—an annual growth of 29.1%.
More developers = More dApps = More users = Higher demand for SOL.
Solana stays fast and low-cost, with high throughput and low latency. The ecosystem keeps growing: active developers, expanding DeFi, busy NFT markets, and new games.
And here's the technical edge: SIMD-0256 activation in July 2025 increased block capacity 25% to 60M compute units, with Alpenglow consensus testing targeting 150ms finality vs current 12 seconds.
Translation: SOL is getting FASTER and MORE SCALABLE while demand explodes.
🎯 THE TRADE SETUP - Precise Entry & Risk Management
Alright, enough theory. Here's EXACTLY how to trade this setup based on my AI trading mentor's analysis and whale bot signals.
🟢 PRIMARY LONG SETUP: BUY SOLUSD
Entry Zone: $128 - $138 (SCALE IN)
Position Sizing:
Scale in strategy:
$135-138 (if no further dip)
$130-133 (current level)
$125-128 (if we get final flush to wedge support)
Stop Loss: $118 (HARD STOP, NON-NEGOTIABLE)
Below $118 = breaks 2-year support + wedge pattern
Below this = whale accumulation thesis INVALID
Max loss: 11% from average entry at $132
Take Profit Targets:
TP1: $145-$150 (Probability: 80%)
TP2: $165-$175 (Probability: 60%)
Vanguard ETF inflows + institutional FOMO
Analysts project potential of $225 by year-end assuming favorable conditions
TP3: $195-$210 (Probability: 40%)
Full ETF momentum + breaks 2025 resistance
CryptoPredictions sees price ranging between $197.29 and $290.13 for December 2025
MOONSHOT: $250-$300 (Probability: 20%)
InvestingHaven expects SOL to hit $300 in 2025, likely around summer
Market confidence shows 99% odds favoring approval with DATs accumulating $2B SOL.
Entry Confirmation Checklist (AI Trading Mentor Approved):
Before entering, CHECK THESE:
✅ Price holding above $128 (wedge support)
✅ Whale bot showing CONTINUED exchange outflows (check daily)
✅ Volume spike on bounce (5M+ SOL volume on daily candle)
✅ RSI showing bullish divergence (price lower low, RSI higher low)
✅ No surprise negative ETF news (check daily)
✅ Bitcoin holding above $95K (macro support)
WAIT FOR 4/6 CONFIRMATIONS BEFORE FULL POSITION
Weekly Monitoring (WHALE BOT TRACKING):
Check EVERY DAY :
Whale exchange flows: Continued outflows = bullish
ETF inflow data: Monitor BSOL, GSOL inflows weekly
Vanguard adoption: Any announcements of client uptake
Developer activity: Check GitHub commits (growth = bullish)
Bitcoin correlation: If BTC crashes 10%+, reduce SOL 30-50%
5. Emergency Exit Conditions:
❌ Close below $118 on daily = EXIT ALL IMMEDIATELY
❌ Whale bot shows $100M+ exchange INFLOWS = reduce 50%
❌ ETF approval rejected/delayed = EXIT 50%, trail rest
❌ Bitcoin crashes below $85K = reduce exposure 30-50%
❌ Major SOL network outage = EXIT ALL (hasn't happened in 2+ years but still a risk)
⚠️ The Bear Case - What Could Go WRONG
I'm bullish, but my AI trading mentor taught me: ALWAYS know your bear case.
Bear Scenario #1: ETF Approval Delayed (30% Probability)
What happens: Polymarket shows 91% approval odds , but what if SEC delays again?
Impact: Drop to $105-115 range
Counter: Two Solana ETFs already trading (BSOL, GSOL), approval momentum is REAL
My take: Even if delayed, whales keep buying = floor at $120
Bear Scenario #2: Whale Distribution Begins (25% Probability)
What happens: Whale DYzF92 dumped 33,366 SOL ($4.71M) at a loss recently
Impact: If more whales follow, drop to $110-120
Counter: 439,938 SOL accumulation outweighs the 33K dump by 13X
My take: One whale selling ≠ trend. NET whale flow is BULLISH.
Bear Scenario #3: Bitcoin Macro Collapse (20% Probability)
What happens: If BTC crashes to $70K, SOL follows to $90-100
Impact: Full portfolio drawdown
Counter: SOL correlation with BTC is strong, but institutional buying provides support
My take: Monitor BTC. If breaks $90K, cut SOL exposure 50%.
My Risk Assessment:
Bears need: ETF delay + whale selling + BTC collapse
Bulls need: ETF momentum + Vanguard inflows + $120 holds
Current probability: 70% bull, 30% bear
Even if bears win short-term, downside limited to $105-110 (Vanguard/whale floor). But upside? $195-250+ (institutional FOMO).
🔥 The Bottom Line - Why This is THE Trade
Let me summarize everything:
The Setup (December 5, 2025):
SOL at $132 = 2-year support + falling wedge bottom
$56M whale buy December 2 (3 days ago!)
Vanguard opens SOL ETFs December 2 (2 days ago!)
Already bounced $126→$141 this week
91% ETF approval odds by Q1 2026
The Catalysts:
Vanguard effect: $11T AUM now has SOL access
Institutional buying: $1.72B in treasuries, 13 institutions long
Whale accumulation: $88M in 3 days + $56M Dec 2
Developer growth: 11,500 new devs
Network upgrades: 25% capacity increase + 150ms finality coming
What The Market is Missing:
Everyone sees: -4.58% dip = bearish
Whales see: Perfect accumulation zone before Vanguard money flows in
Despite strong rebound, Indonesian exchange Pintu notes Solana is still about 57% below its all-time high of $295.83.
That's not a bug. That's a FEATURE.
We have 57% room to run back to ATH, and we're sitting at 2-year support with $11 TRILLION in new capital about to enter through Vanguard.
🎯 Action Plan - What To Do RIGHT NOW
IF YOU'RE BULLISH (Recommended by AI Trading Mentor):
Set Alerts:
Alert at $128 (aggressive buy - wedge support test)
Alert at $133 (current - scale in point)
Alert at $138 (last entry before breakout)
Alert at $145 (take profit trigger)
IF YOU'RE BEARISH:
Wait for:
Close above $150 with volume (breakout confirmed)
Then enter on $145-148 retest
Safer but worse risk/reward
IF YOU'RE NEUTRAL:
Allocate 3-4% of portfolio (half position)
Enter at $130-135 only
Take profits at $155 (+19%)
This is the "I believe but I'm cautious" play
Final Thoughts - The Truth About This Setup
My AI trading mentor has analyzed thousands of setups.
Here's what I KNOW for certain on December 5, 2025:
✅ 439,938 SOL ($56M) removed from Coinbase Dec 2
✅ Vanguard ($11T) opened SOL ETFs Dec 2
✅ 13 institutions hold $1.72B SOL (1.44% supply)
✅ 91% ETF approval odds on Polymarket
✅ $120 support held for 2 years
✅ Falling wedge = 75% break upward historically
✅ $100B flowed into BTC after ETF approval
Here's what I DON'T know:
Will Vanguard inflows start immediately or take months?
Will whales keep accumulating or start distributing?
Will BTC hold or crash?
Drop a 🟣 if you're buying SOL at $130-135.
Drop a 🤖 if you're using AI to refine and help guide you with setups like this.
Drop a 🐋 if you're following whale accumulation.
Drop a 💰 if you're ready for $
