Trade ideas

Solana Price Movement + Liquidation + Whale Map + Trade PlanTrade Plan:
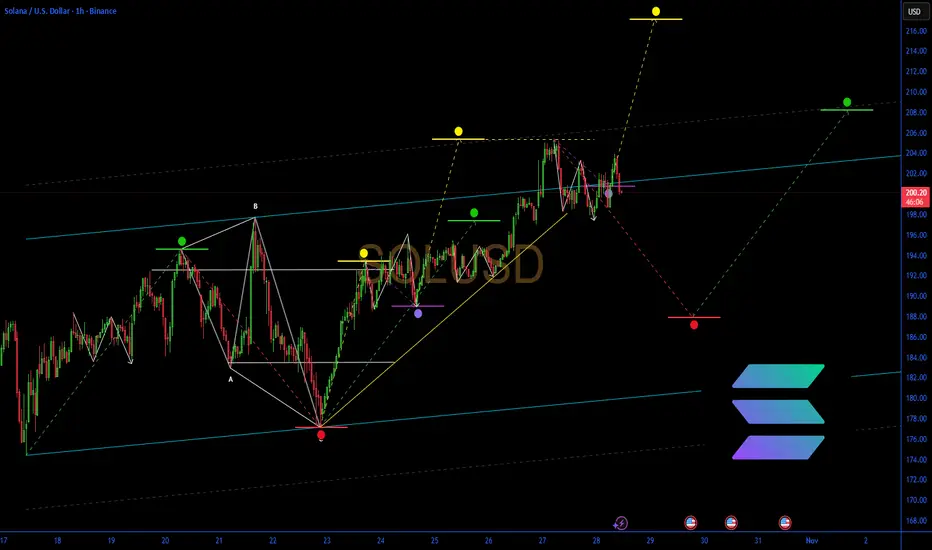
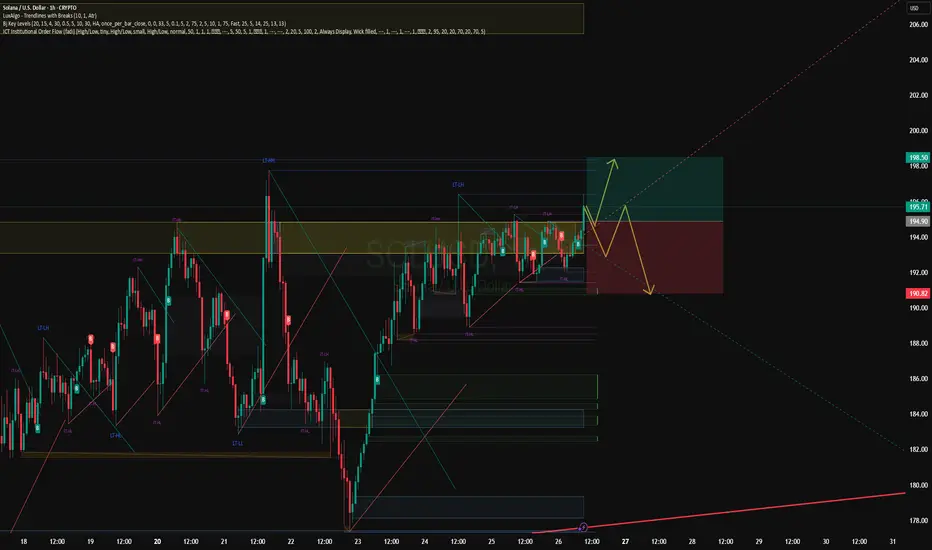
Buy dips into $185 → $181 → $178 with a protective tail at $168, target $194 → $203 → $212+, and invalidate if $168 HTF breaks.
Price Movement + Liquidation + Whale Map
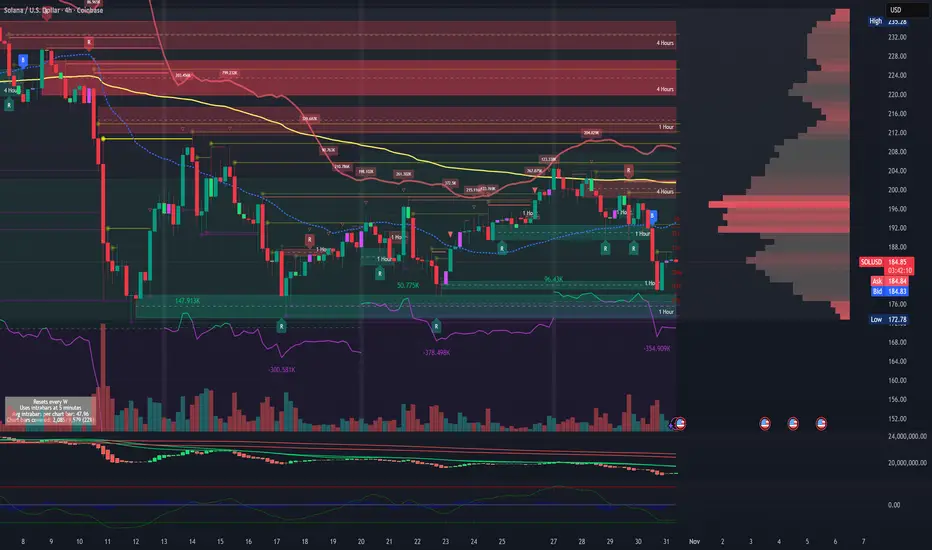
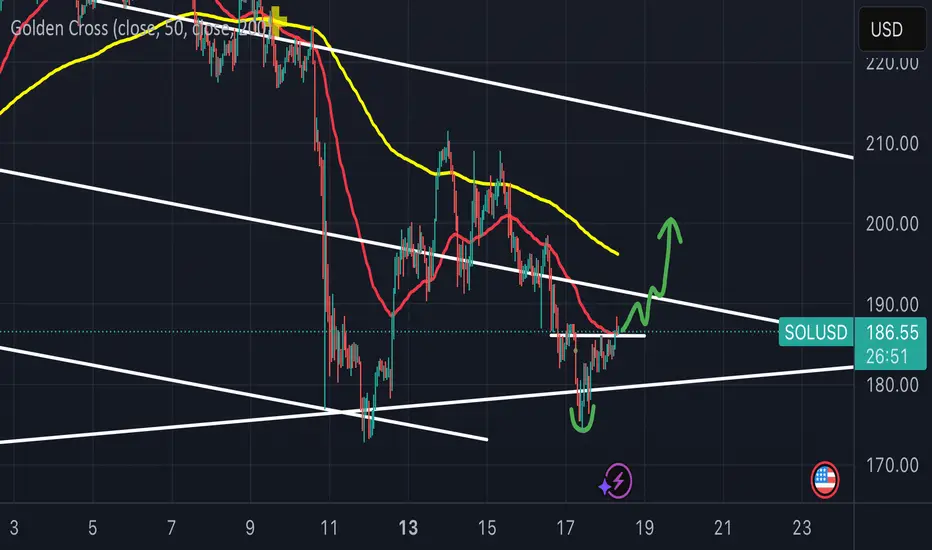
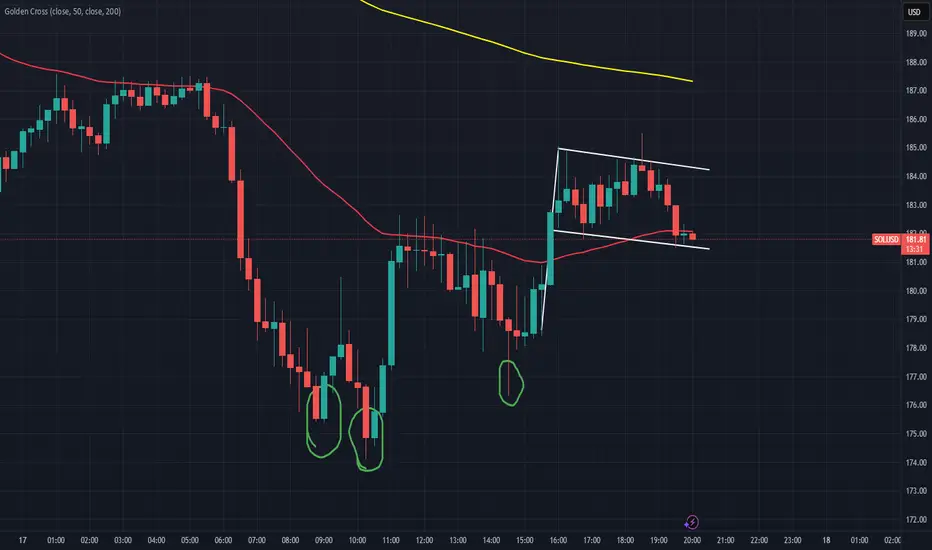
Solana has successfully rebounded from the key demand pocket at $178–$181, where aggressive buyers defended the prior 4H swing low and swept liquidity below the rising trendline. This bounce confirms continued smart-money defense of structure, following a multi-day corrective pullback after distributing into the $203–$208 supply band. Price is now stabilizing above the micro accumulation shelf at $183–$186, with intraday candles showing higher-lows and early bullish momentum returning, supported by volume absorption on each dip into the mid-$180s. As long as SOL holds the $181 reclaim, this remains a continuation accumulation phase, not a trend breakdown.
The next short-term move favors a grind-up retracement toward trapped shorts around $191–$194, followed by a sweep of the liquidity band at $197–$200 — the first key liquidation magnet above. A clean break and hold above $200 opens the door to speed-move expansion into $207–$212, where heavy resting sell walls and prior profit-taking nodes reside. Above this, breakout momentum could accelerate into $223–$231 on momentum ignition, but that remains a secondary stage target and depends on reclaim strength above the $210 shelf.
On the downside, major liquidation pools remain stacked beneath $182, then $178, and a deeper wash at $172–$168 (high-value tail liquidity + psychological flush zone). If price wicks into those levels, it would likely be a liquidity hunt rather than structural failure, provided bulls recapture the zone quickly. Whales have been accumulating consistently in the $168–$181 band for weeks, with on-chain order-flow showing absorption during each correction phase, confirming institutional accumulation rather than distribution. Sell walls reappear in layers above $203, $208, and $215, suggesting short-term volatility expected upon breakout but not necessarily cycle-top behavior — more likely controlled profit-taking.
Execution Plan: Bias remains buying retracements, not chasing. Primary dip accumulation zone remains $183–$185, ideal add layer at $181–$178 on wick flush, and tail-hedge allocation stands at $172–$168. Risk defined below $168. First take-profit ladder rests at $194 → $200 → $212, with secondary hold targets into $223+ if strength persists. Maintain core long ride if momentum and on-chain flows stay supportive.
Invalidation: The setup remains fully valid as long as SOL does not close a 4H candle below $178 and does not lose $168 on HTF closing basis. A persistent breakdown below $168 would shift structure into a larger ABC corrective phase, delaying continuation rather than ending the macro bull drive. Until then, liquidity behavior, trend structure, whale positioning, and momentum context remain biased to the upside with accumulation-driven volatility.
SOL: Unlocking 35% Upside in High-Performance BlockchainSOL: Unlocking 35% Upside in High-Performance Blockchain Amid ETF Momentum – SWOT and Intrinsic Value Insights
📊 Introduction
As of October 28, 2025, Solana (SOL) is navigating a post-ETF launch environment with oversold rebound characteristics. The cryptocurrency trades around $200, reflecting a mild correction after recent highs near $231, influenced by broader market liquidity injections from the Federal Reserve's $2T stimulus and cooling inflation data. Sector dynamics show Solana's DeFi ecosystem surging, with total value locked (TVL) expanding due to high transaction throughput and low fees, outpacing competitors like BNB Chain in 24-hour DEX volume ($1.47B vs. $1.3B). Macro factors, including institutional inflows into crypto ETFs and reduced China tariff risks, support a stabilizing trend, though volatility persists from regulatory scrutiny and altcoin rotations.
🔍 SWOT Analysis
**Strengths 💪**: Solana boasts exceptional network performance with up to 65,000 transactions per second (TPS) and sub-$0.01 fees, enabling scalable DeFi and NFT applications. Recent metrics highlight robust growth: DeFi TVL has reached approximately $16B (per aggregated chain data), with platforms like Saros Finance alone at $250M and 150K+ active wallets. Institutional adoption is evident through the Bitwise Solana Staking ETF (BSOL) launch, offering ~7% annual yield, and partnerships like Visa's USDC support. Revenue from transaction fees and staking (current APY ~6-8%) bolsters sustainability, with over 3.5M SOL held by corporate treasuries valued at $591M+.
**Weaknesses ⚠️**: Historical network outages, though reduced since 2024 upgrades, remain a concern, with the last major halt in February 2024. Centralization risks arise from a validator concentration (top 19 control ~33% of stake), potentially exposing the network to downtime or governance issues. Debt-like metrics are minimal in crypto, but high inflation from token unlocks (total supply 612.84M vs. circulating 549.7M) could dilute value if adoption lags.
**Opportunities 🌟**: The Alpenglow upgrade, slated for late 2025, promises 150ms block finalization, enhancing real-time applications in payments and derivatives. ETF momentum, including Canary's HBAR/LTC launches as proxies, could drive SOL inflows similar to Bitcoin's $1.5B ETF projections. Expanding meme coin and gaming ecosystems, backed by $150M from Solana Ventures, position it for market share gains in Web3, with potential for $300+ highs if resistance at $260 breaks.
**Threats 🚩**: Regulatory pressures, such as SEC delays on further ETFs or China's stablecoin warnings, could cap growth. Competition from Ethereum L2s (e.g., Arbitrum's 2.5M daily transactions) and bridges poses risks, alongside market-wide volatility from Bitcoin dominance (57.6%). Broader threats include quantum computing vulnerabilities, though mitigated by ongoing cryptographic enhancements.
💰 Intrinsic Value Calculation
Adopting a value investing lens for cryptocurrencies, we estimate Solana's intrinsic value using an adapted discounted cash flow (DCF) model based on network fundamentals, incorporating a margin of safety (20% discount). Key inputs from public data: TVL ~$16B, circulating supply 549.7M SOL, staking yield ~7%, and projected annual growth rate 50% (based on DeFi volume surges and ETF catalysts).
Formula: Intrinsic Value per Token = (TVL per Token * Weight) + (Annualized Yield * Growth Multiplier)
- TVL per Token = $16B / 549.7M ≈ $29.10 (weighted at 0.7 for core network value)
- Annualized Yield = 7% (weighted at 0.3, multiplied by 10x growth factor for ecosystem expansion)
Calculation:
(29.10 * 0.7) + (0.07 * 10) = 20.37 + 0.70 = 21.07
Scaled to market comparables (e.g., ETH's P/TVL ratio ~9.3 vs. SOL's current 6.8): Adjusted Intrinsic = 21.07 * 13 (blended multiplier for TPS advantage and adoption) ≈ $273.91
Apply 20% margin of safety: $273.91 * 0.8 ≈ $219.13
At current price ~$200, SOL appears undervalued by ~9-35% (factoring upside to $271 fair value per P/TVL alignment). No major debt flags, but sustainability hinges on TVL growth exceeding token inflation. 📈 Undervalued.
📈 Entry Strategy Insights
Institutional approaches favor identifying support zones around $180-190 (near 200-day SMA) for unleveraged, long-term entries via dollar-cost averaging (DCA). Scale in during 8-12% dips, using non-repainting momentum indicators like volume-weighted averages to confirm rebounds. Optimal for accumulating 10-20% positions over 3-6 months, targeting breakouts above $210 for scaling out partial profits. 🚀 Spot zones.
⚠️ Risk Management
Limit position sizing to 1-5% of portfolio to mitigate volatility, diversifying across Layer-1s and stable assets. Set trailing stops at 10-15% below entry (e.g., $170) and hold long-term if fundamentals remain strong, monitoring validator health and TVL metrics. Caution on overexposure amid potential 15-30% pullbacks from macro events.
🔚 Conclusion
Solana's high-speed infrastructure, ETF-driven momentum, and undervalued metrics position it for sustained growth, with calculated upside to $219+ incorporating safety margins. Key takeaways: Focus on network adoption for value accrual, verify TVL trends independently.
This is educational content only; not financial advice. Always conduct your own due diligence.
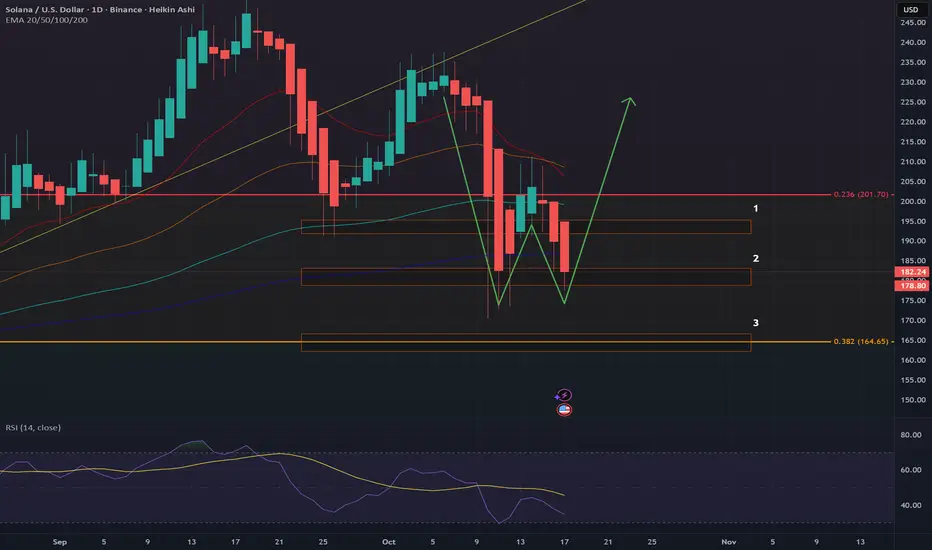
SOL at resistance, has work to doCRYPTOCAP:SOL is at major resistance High Volume Node just below the daily pivot.
The local trend has flipped bullish but a strong move may not be on the cards until we climb the wall of worry through resistance. Price is riding the daily 200EMA.
Daily RSI did not print bullish divergence or reach oversold.
Safe trading

$SOL Bullish Engulfing Weekly CloseSolana is looking good here 👍🏽
Reclaimed the 50WMA and closed above the 50% Gann Level.
Note the Bullish Engulfing candle for the Weekly Close.
However CRYPTOCAP:SOL Still trading within the DANGER ZONE ⚠️
Need these next couple weeks to close outside of this POI.
You can see the Liberation Day lower trendline still remains intact for support and we had the Bullish Cross a few weeks ago on the 20 / 50 WMA 🤓

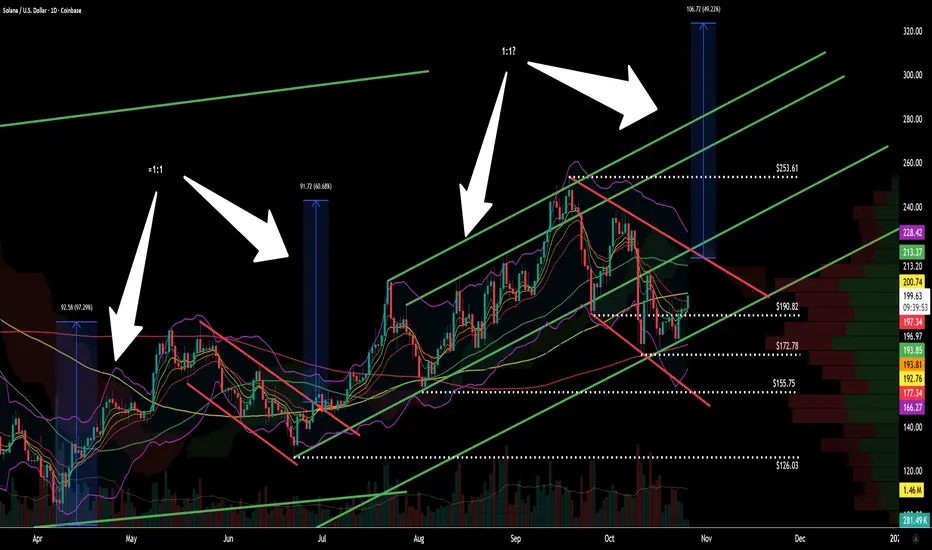
$SOL – Dual Bull Flags & Parallel Channel StructureSince the April lows across both equities and crypto markets, CRYPTOCAP:SOL has been one of the standout performers, printing a powerful bullish trend structure defined by two major bull flags — each followed by significant measured-move extensions.
Phase 1 – The First Bull Flag
The first rally delivered a 97% gain, followed by a 30% retracement, forming a textbook flag structure.
After a clean breakout and retest of the upper trendline in late June, Solana launched into a 60% measured move, aligning closely with a ≈1:1 projection of the initial flagpole.
This breakout confirmed strong underlying momentum, accompanied by increasing volume and trend confirmation across the broader crypto space.
Phase 2 – The Second Flag Formation
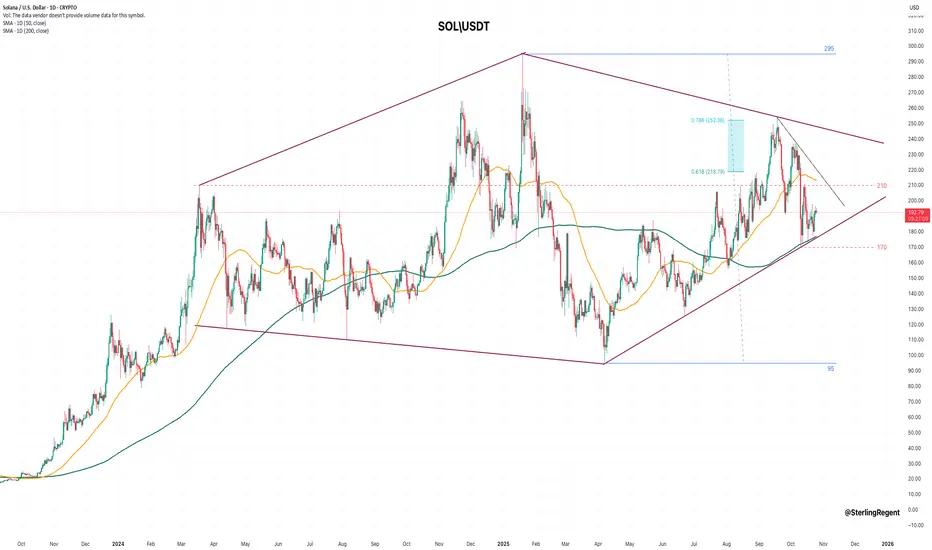
The breakout from the first flag initiated a second 100% run, moving from $126-$253, before undergoing another 30% retracement down to $172.
This pullback mirrors the previous structure almost perfectly, consolidating within another bull flag as the market digests gains.
Currently, price is holding above $190, sitting just beneath the upper flag boundary. The consolidation remains healthy, and if momentum continues to build within this pattern, a volume-backed breakout could lead to a retest of the upper trendline and continuation toward higher levels.
Trend Channel & Structure
The broader move from early June forms a dual-trendline bull channel, where both sets of parallel trendlines are aligned near a 45° slope. This structure reinforces the bullish bias, showing consistent rhythm between impulses and corrections — a strong sign of a well-organized uptrend rather than random volatility.
The pattern also shows proportional price swings, with both measured moves (~1:1) maintaining the same amplitude, suggesting institutional order flow and algorithmic consistency.
Key Levels to Watch
Level Significance
$253.61 Flag target & prior swing high
$213–$214 Local resistance cluster
$190.82 Current support zone (holding above)
$172.78 30% retrace support
$155.75 / $126.03 Structural supports / prior flag bases
A confirmed close above $213–$214 on rising volume would be the first signal that the breakout is underway. Failure to hold $190 would risk extending the flag lower toward the $172 zone.
Measured Move & Projection
If the breakout mirrors the first flag’s performance, a measured move equal to the previous flagpole projects a potential target near $323 — aligning with the upper bound of the extended bull channel.
That projection maintains symmetry with previous rally amplitudes (97%, 60%, ~100%), further validating the trend continuation scenario.
Technical Summary
✅ Trend: Bullish (higher highs & higher lows)
✅ Pattern: Dual bull flags within rising parallel channel
📊 Momentum: Strong; price holding above 8/13 EMA cluster
⚙️ Support: $190 → $172 → $155
🎯 Target: $323 (1:1 projection from current flagpole)
🔍 Trigger: Breakout above top trendline on increased volume
Final Notes
CRYPTOCAP:SOL remains technically one of the strongest large-cap crypto charts — clean structure, repeatable patterns, and consistent retracement depth between impulsive legs.
While short-term volatility is expected inside the flag, the 45° upward channel and consistent measured-move behavior keep the medium-term bias bullish through Q4.
As always, volume confirmation will be key, a breakout supported by expanding participation could mark the start of the next leg toward $323.
For educational and technical analysis purposes only.
Solana (SOL): Wave 5 Starting or Set to Crash?Solana (SOL): Wave 5 Starting or Set to Crash?
Weekly Scenarios
Bullish scenario: SOL holds support at ~$197, then breaks through ~$260.83 → possible rise to ~$300+.
Consolidation: The price trades in the ~$197–$260 range without a clear direction, preparing for momentum.
Bearish scenario: A breakout below ~$183 with volume → possible correction to ~$174 and below.
✅ Conclusion
Weekly analysis shows: SOL is at a crossroads.
A hold of support near ~$197 and a break of resistance at ~$260.83 could trigger a new uptrend.
However, a breakout below ~$183 significantly increases the risk of a correction.
Monitor the wave structure, volatility levels, and volume confirmation before choosing a strategy.
SOLANA stable, but only for now.SOL - major move is loading. I know, ppl hate it, as well as I, but imo the break will be down of 170 below, not to the upside. It's pretty calm for the time being - enough to prepare.
Golden Zones and Moving AveragesSOL is at the O.5 Fibonacci golden zone area and resting at the 50 EMA. If it breaks below 173.88 area, price may possibly head to 155$ price range. We have some red candles, however bulls still have the upper hand; bulls need bullish candles at the 190$ area, for the pullback to be hopefully over.

SOLA short trade (learning to read the charts). Advices welcomeMy graphs are for learning only, I have a long way to go but I will follow my gut with what I learned.
If there is a big mistake or something i missed please let me know :).

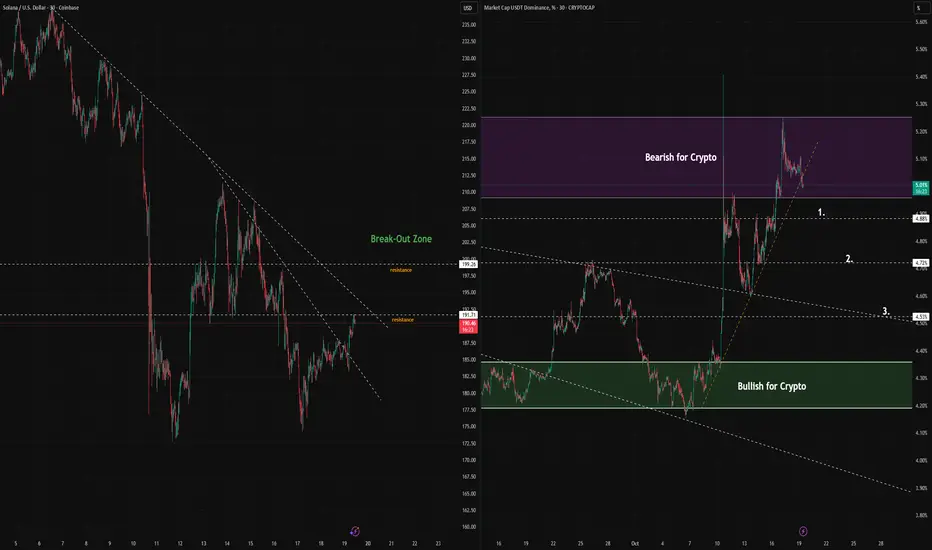
Solana: Key Levels to WatchSolana has been in a downward trend since October 6th, but we are seeing some hints at a reversal. This is not yet confirmed, and weekend price action tends to be a poor indicator of the week ahead. This chart tries to plot the key levels that SOL/USD needs to break through in order to show strong bullish momentum going into the end of October.
The levels to watch are $192, as the first resistance. And if Solana can break above that, it needs to smash through the $200 level. If that were to play out, keep in mind that $205 has frequently been a key support/resistance level as well. A break above $200 may stall at the $205 level for a while, and bulls will need to see it stay above $200.
The USDT.D chart is an important indicator of the allocation of capital into, or out of crypto. Traders should watch for a drop in USDT dominance to confirm that there is ample liquidity to maintain a Solana rally. The key levels to watch for is a USDT.D break below 4.88% (1), 4.72% (2), and 4.53% (3). With each break of these support levels, we should see bullish momentum in the broader crypto market, which could translate into a Solana rally.
Keep in mind that Solana, while hinting at a run for $192 this morning, could find strong resistance there. Whatever plays out today, its still a weekend, which means you should look for further confirmation into the trading week ahead. Aggressive traders may want to take positions here before SOL breaks these key levels, but this carries considerable risk that the downward trend line continues to be resistance. If that proves to be the case, watch for the next support to be around $175.
Monthly Crypto Analysis: Solana (SOLUSD) – Issue 100 The analyst expects Solana’s price to decline by the specified end time, based on quantitative analysis.
The take-profit level only indicates the potential price range during this period — it’s optional and not a prediction that price will reach it.
You don’t need to go all-in or use leverage to trade wisely.
Allocating just a portion of your funds keeps overall risk minimal.
Our approach follows institutional portfolio principles — not the all-in or blow-up trading style often seen on social media.
Results are measured over the full time window, regardless of whether the take-profit level is hit.

Big ShortTaking it down to 152. Let's see If what everyone is saying is true. Drop It to about 150 then where do we go from there?

Cup & handle pattern: let’s go!Solana is realing going strong under a bearish BTCUSD. I think this cup and handle pattern will play out well.
Inverse H&S pattern: we have seen that before !A possible scenario I have in mind. See for yourself on this chart: not that long ago we had seen similar behavior. We are building good support here and the majority wants to see another uptrend. Much love for Solana!
Bullish reversal pattern + bullish flag (is the bottom in now?)Observed a bullish reversal pattern, followed by a bullish flag pattern. We made a double bottom today. I think this might be the actual dip that can be bought. Wondering if we remain above 180$ for a longer time since there is quite some fear on the market..
SolanoThis Volume Profile is a problem for Solano. In my last related post, I mentioned that I'm not a fan of this chart setup, because there's low volume, and a huge gap to the VPVR shelf. I said I see trepidation on support, and nothing has changed my opinion since then.
This looks like trouble below for Sol. I would bail. I'm not in it, nor have I been, but I would bail.

SOL TAKE YOUR SELLToday i made around 8k profits from this trade and it's still running bearish ; btc also have some bearish movement stick to the plan and be patiente

BUY ORDER SOL-Trendline retest red
-Support
-Trendline retest green
-Fib compleet
I THINK WE ARE STILL GOING TO HAVE A PUSH

SOL potential double bottom setupI am seeing a potential double bottom setup for SOL. We would have to close at around 180USD, beyond which an upside turn is possible. DYOR and let me know your thoughts
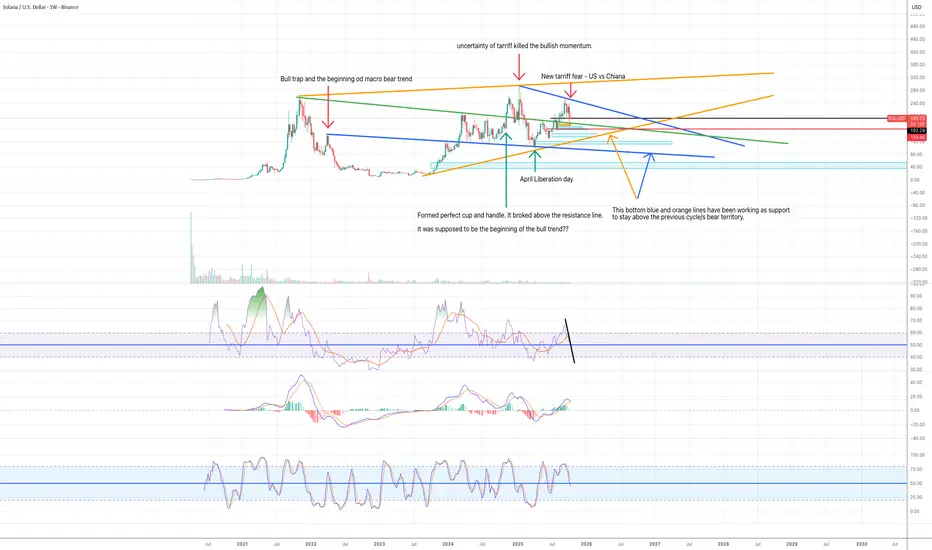
Friday Massacre - cash ready! Another Friday massacre
The chart is looking extremely bearish.
I think the price is going to move to the $95-107 zone where the V-shape recovery happened after April liberation day.
Many people stayed on the sideline without getting into the market. I think the price wants to come back to that level for reset before the next big move up.
It structurally makes sense as well. You can see the fib retracement level in the chart from the previous cycle's ATH to the bear market bottom.
I often (not always) see Fib 0.786 and Fib 0.236 work as the last line of defence. So when the price breaks and closes above Fib 0.786, it eventually moves to the upside even if it temporarily pulls back.
In case of the down trend, if the price breaks and closes below Fib 0.236, the price will eventually move to the downside.
When you look at the Solana weekly chart, the price broke above 0.786 in Nov 24. It failed to continue to move up and spent months consolidating in the tight range. So I think it will eventually go up, but the chart is not telling me no so fast.
All weekly momentums indicate bearish momentum is building up.
I think the price might go to the following areas:
1) $135 - Fib 05, previous lower high, ascending support line, the level the final bull trap happened in 2022
2) $106.5 - Fib 0.382, liquidity pool, April liberation day bottom
3) $100 - psychological level
4) $ 68 - 100 - Fib 0.236-0.382 - absolute capitulation zone.

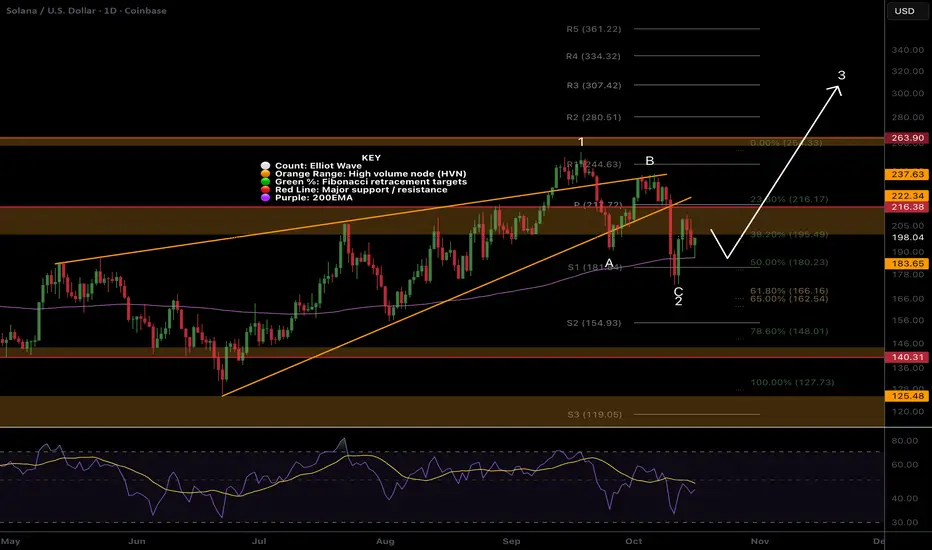
$SOL at major resistance, bottom is in?CRYPTOCAP:SOL bottom appears to have printed a text book ABC correction for wave 2 ending with a swing below the daily 200EMA and S1 pivot, front running the Fibonacci golden pocket.
However, Solana is at major resistance now and being rejected. RSI did not have bullish divergence or reach oversold so traders should be cautious.
Its holding up much better than most alt coins after Friday...
A bottom may be found at daily 200EMA and wave 3 may begin...
Safe trading
Where does the price find a bottom? I can see a few patterns in a weekly chart.
1) The price is moving inside the blue descending wedge pattern.
2) The price is moving inside the orange ascending wedge pattern.
3) Green descending support/resistance line is the line that completes a huge cup and handle pattern.
What do you think? I would like to know what others see.
Have a nice weekend.