SOL Daily Outlook | November 26, 20251hr timeframe has been pushing up to 144.69 beautifully above the 50ema. Lots of opportunity to catch long entries here inside the 1hr ranges.
Bias: We continue to push higher BULLISH
Trade ideas

Breakout from falling wedge pattern?I think as soon as the EMA crossover VWMA occurs on the 1D that we will see a breakout from here. 1D macd bullish signal already occured in the meanwhile. Bulls are back!

SOL to Bottom Out Around $103-104SOLANA – Eyes on the Final Flush? 🔥 Key Confluence at $103–$104
Solana is approaching what might be the most important support zone of this entire macro structure. Several major technical factors are all pointing to the same potential bottom area:
🟢 1. Head & Shoulders Breakdown Target
The measured move from the H&S pattern puts the projected downside right into the $103–$104 zone, creating a textbook target alignment.
🟠 2. Long-Term Trendline Support (Orange)
Price is now dropping toward a multi-year rising trendline that has held since early 2024.
This line has acted as major dynamic support across multiple cycles, and SOL is now coming back to retest it.
🟣 3. Fibonacci 0.886 Retracement
The 0.886 retrace of the full macro move lands perfectly in the same area.
This fib level is often where deep retracements reverse during strong bullish expansions.
📉 Current Structure
– Breakdown from right shoulder confirmed
– Momentum still down, but seller exhaustion showing up
– Volume declining on the drop → typical late-stage correction behavior
📌 Key Zone to Watch
$103–$104 (Green Box)
This is my “high-probability reaction zone” where I expect Solana to bottom or at least produce a significant bounce.

SOL Daily Outlook | November 25, 2025Solana buyers in control. Price is above the 50ema with a strong push heading towards 144.69!
Bias: Bullish

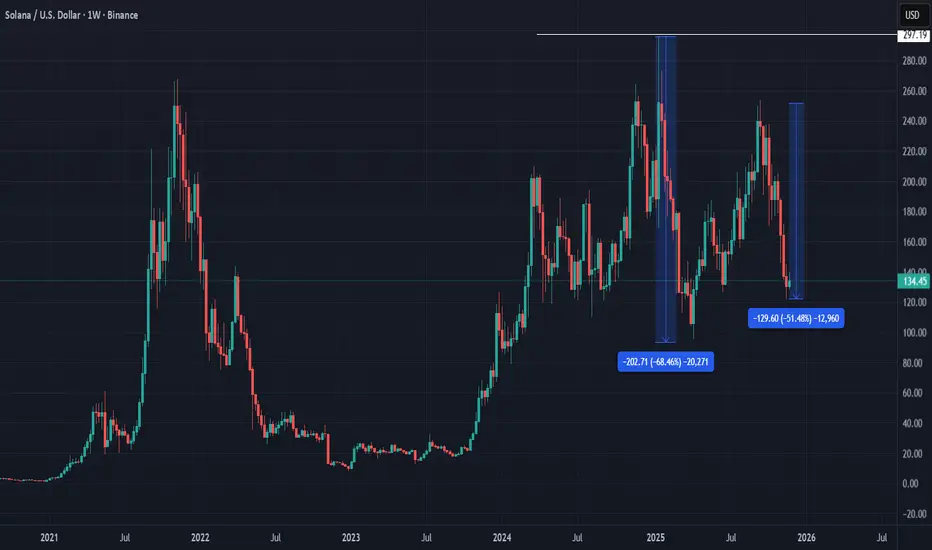
SOL - The Next Collapse May Be InevitableCRYPTOCAP:SOL COINBASE:SOLUSD BINANCE:SOLUSDT BINANCE:SOLBTC
Fundamental Analysis:
Solana pumped strongly in 2020–2021 because it offered high speed, low fees and a new ecosystem that attracted developers and traders. The same thing happened again in 2024–2025, but this time the main driver was the huge wave of easy-to-create tokens and memecoins . Anyone could launch a coin in a few minutes and many of these tokens were dumped on the market with no real purpose. Now that most of these new coins are losing popularity and people are realizing that many were simply scams, activity on the Solana blockchain is starting to slow down. Even with the recent Solana ETFs, large investors will likely wait for a major price drop before buying, not during a hype phase that has already ended.
Technical Analysis:
The price almost hit $300, then made a very strong correction of around 68%. After that, the market struggled to bring the price back to $250, and it quickly fell again to around $135. This tells me that the zone between 200–300 was used by whales as a distribution zone. They sold heavily while the market was excited, and the weak recovery shows that buying pressure is not strong anymore.
My Expectation:
Because the fundamentals are weakening and momentum is fading, I believe the next range of distribution will move lower, likely around . If activity keeps dropping and no new narrative appears, holders may rush to exit and the price could fall sharply.
This is not a signal to short — it is only my personal point of view on how Solana currently looks to me.
Retrace in Solana UnderwayWe're getting very close to confirming a minor wave bottom that should get price into the target box. Afterwards, I look for a new local low in 2026 towards the $70 level. That should be bought like Crypto is going out of style.

Monthly Crypto Analysis: Solana (SOLUSD) – Issue 107 The analyst expects Solana’s price to decline by the specified end time, based on quantitative analysis.
The take-profit level only highlights the potential price range during this period — it’s optional and not a prediction that the market will necessarily reach it.
You don’t need to go all-in or use leverage to trade wisely.
Allocating just a portion of your funds helps keep overall risk low and ensures a more sustainable approach.
Our strategy is built on institutional portfolio management principles, not the high-risk, all-in trading styles often promoted on social media.
Results are evaluated over the entire analysis period, regardless of whether the take-profit level is reached.
The validity of this analysis is based on a specific time range (until 23 Dec 2025), and after this period, the analysis will be reviewed and updated (once every 28 days).

SOL USDHI GUYS,
We failed to sell today as i expected a break and retest.
however there was news toady shifting to a new sell structure.
Hopefully a few hours from now i expect sells as illustrated above.


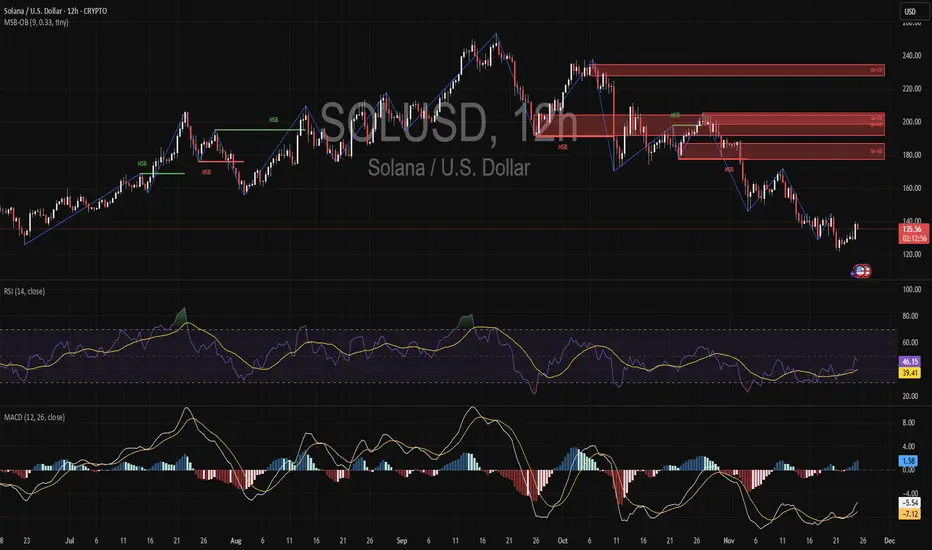
Solana Rejects Supply at 200 – Breakdown Just Getting Started?SOL rejected cleanly from stacked supply zones above 200 and confirmed a bearish market structure break on the 12H.
This rally looks exhausted, with a lack of momentum and no reclaim of key invalidation levels.
MACD is still trending down, RSI struggles to break 50, and previous support zones are now flipping resistance.
Unless bulls reclaim 150 fast, Solana could bleed back toward the 115–120 range.
No signs of strength yet. Bears holding the range.
Bias: Bearish
Pair: SOL/USDT
Timeframe: 12H
This is not financial advice, only data analysis. Please consult a qualified financial professional for personalized guidance.
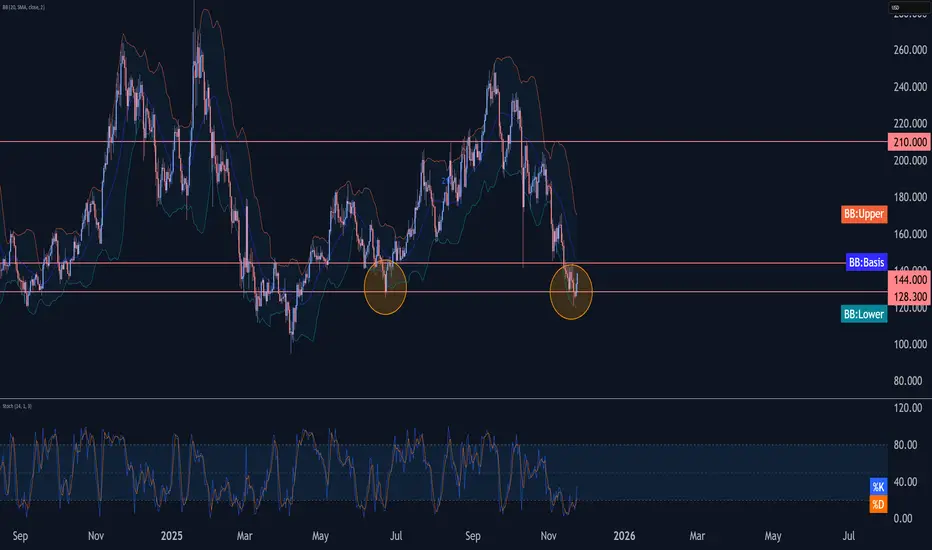
Solana Wave Analysis – 24 November 2025
- Solana reversed from support area
- Likely to rise to resistance level 144.0
Solana cryptocurrency recently reversed from support area between the strong long-term support level 128.30 (which stopped wave 2 in June) and the lower daily Bollinger Band.
The upward reversal from this support area stopped the previous multi-week downward ABC correction (2) from September and started the active impulse wave 1.
Given the oversold daily Stochastic, Solana cryptocurrency can be expected to rise to the next resistance level 144.0 (top of the latest uwpard correction iv).
SOL looks weak, lower in wave C?Price continues lower, a textbook ABC correction so far.
Wave B ended shy of all-time high. Price lost the daily 200EMA and is testing the major High Volume Node support. The probability is a continuation to the downside.
📈 Daily RSI reached oversold with no divergence
👉 Continued downside brings up the $112 target
Safe trading

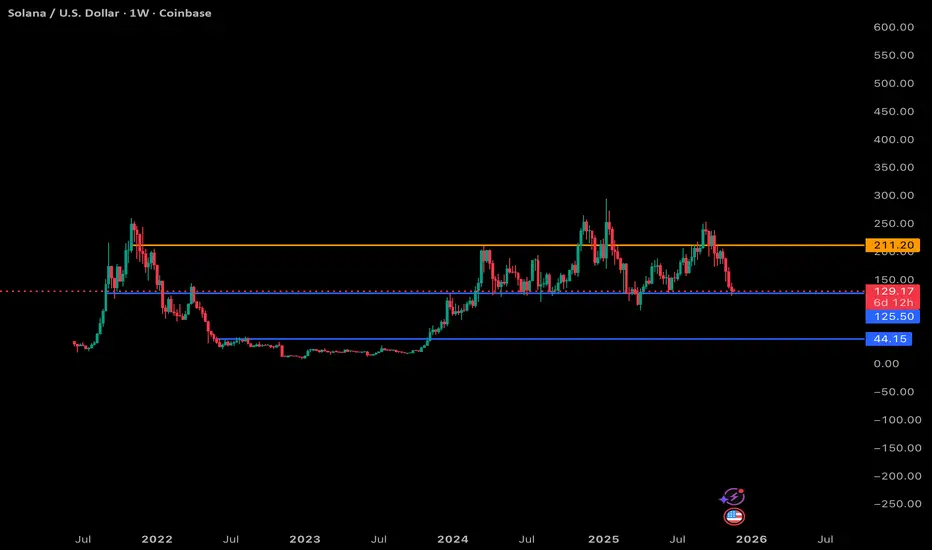
SOL 1W Breakdown: Key Levels, What I’m Watching Next Nov 24 2025Here’s my read on Solana’s weekly chart using the same structure as the BTC and ETH analyses.
Blue = support, orange = resistance, and the dotted mid-range is acting like a pivot zone.
Support Levels (Blue)
$125.50: This is the line SOL is sitting right on top of right now. It’s been a key mid-range level for almost two years. Losing this on the weekly would be a clear bearish signal because there isn’t much structural support underneath until the next major zone.
$44.15: This is the big, deep support from the 2022–2023 accumulation base. I’m not calling for this immediately, but structurally there’s a lot of empty space between $125 and $44. If the macro rolls over and SOL can’t defend the mid-range, we could see a slow bleed or capitulation wick toward this zone.
Resistance (Orange)
$211: This is the major weekly resistance for SOL and has been the top of every rally since 2022. Until SOL can close above this level and hold it, any upside is still just range movement.
My Current Thoughts
SOL is in a tricky spot. We’re sitting right on that $125ish support, and this is basically the “bounce here or things get uncomfortable fast” level.
If we don’t get a bounce:
The chart opens up a pretty big air pocket down to the next structural support.
Weekly structure turns decisively bearish.
SOL likely enters a multi-month corrective phase similar to what it did in 2022/2023 (but obviously not the same magnitude).
If we do bounce:
SOL can chop around this mid-range again, possibly retesting $150–175.
But it still needs a clean reclaim of $211 to resume a real macro uptrend.
Overall View
SOL’s weekly chart is way less forgiving than BTC or ETH right now. The range is clear, but we’re testing the bottom of it, and losing this level puts a lot of downside in play. From a structural standpoint, this is the most important support SOL has tested in a long time. If it holds, cool, if it breaks, we probably enter a much deeper reset.
Slow grind or big drop, the next weekly close is going to be telling.
SELL BUILDING FOR SOLUSDSOLUSD INSIGHTS
We see price close bearish red as we wanted, which suggest push downwards towards TP(129.48), SL:134.58 and further if momentum continues, we see as price reacts to our setup
LETS GO...
🍏✨🍏
TRUST THE SYSTEM

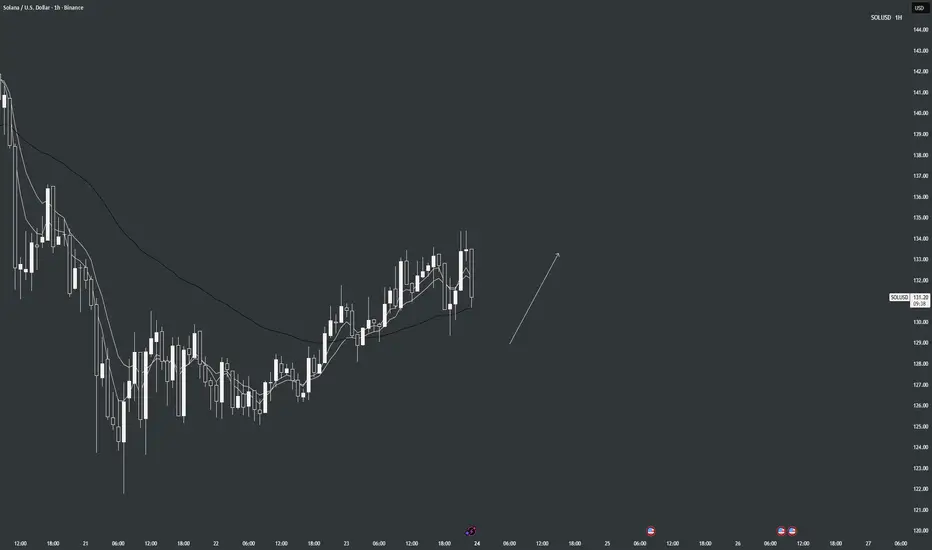
SOL Daily Outlook | November 23, 2025On the 1h, yeah SOL's showing bullish signs right now with that 2-4% pump today (trading ~$130-132), pushing back into the EMA-50 zone and fast EMAs (5/10) starting to hook up—validating your rule to stay bullish until we break below the EMAs cluster.The BOS at 128-130 still holds the structure bearish overall, but this bounce is countering it hard, mirroring BTC's own relief rally (up ~3% today too). Bias locked bullish above EMAs.Key magnets: Upside: 138-140, then 150
Downside (only on EMAs break): 122, then 115-118
Tight correlation means if BTC holds here, SOL grinds higher next.
SOLUSD WE SHUD SEE A PUSH DOWNWARDS, THE EDGE SPEAKSSOLUSD INSIGHTS
We see price go towards the LH(LOWER HIGH) and it gave us an opening for a sell position to the downside, we take a sell here and aim at TP1(128.72), and if price continue with the momentum we could see TP2 (127.28),
SL:(133.22)
LETS GO..
🍏✨🍏
TRUST THE SYSTEM

Solana: Room for moreSOL recently dipped further into the now green Target Zone between $155.80 and $113.20. Within this area, we expect the low of wave ii in orange to be established imminently. Afterward, we anticipate a strong wave iii rally, which should peak above resistance at $295.31.

short term bearish the way the market is moving I strongly think we are going to see lower prices, seems like there is a lot of bull traps, and in my previous idea I mentioned the head and shoulders that formed that would send us to where were at today,
we have a high chance that were heading towards $119 , if we bounce back from there ,
we will bounce back and ascend around $150-130 level for a short period of time before the market decides to go towards $150-185,
or just continue to head lower if we cannot break the $130-$150 range

SOLANA to 185$!🟩 SOLANA LONG SETUP – Elliott Wave + PA
After a successful short as posted a couple of days ago, SOL is nearing the end of a W–X–Y corrective structure, with the final (Y)–C wave looking mature. RSI is printing a clear bullish divergence ⚠️, signaling fading bearish momentum.
The key trigger now:
➡️ A clean break above the blue channel-top trendline.
That’s the level where an impulsive reversal can launch 🚀.
Quick Highlights:
• 🌀 Corrective pattern nearly complete
• 📉 RSI bullish divergence forming
• 📈 Break above blue line = long confirmation
• 🎯 Impulsive upside likely once breakout holds
Watching for that breakout to flip bias from defensive to aggressively bullish.

Solana (CRYPTO: $SOL) ETFs Surge as Price Tests Major SupportSolana (CRYPTO: CRYPTOCAP:SOL ) trades at $127.45 after a sharp 31% decline over the past month, but institutional activity is telling a different story. While retail sentiment weakens, capital continues flowing into newly launched Solana ETFs—creating one of the clearest divergences in the crypto market heading into late 2025.
Six U.S. spot Solana ETFs are now live, with issuers including 21Shares, Fidelity, VanEck, Canary Capital, Bitwise, and Grayscale. Fidelity’s FSOL on NYSE Arca quickly captured attention thanks to its staking component, making it the largest traditional asset manager offering staked SOL exposure. 21Shares also added competitive pressure by launching its ETF with a 0.21% fee after securing Cboe approval.
Combined ETF holdings now exceed $2 billion, and the inflows haven’t slowed—Solana ETFs recorded $26.2 million in net inflows on November 18, marking the 15th consecutive positive day. Remarkably, these inflows outpaced those of Bitcoin and Ethereum for the week. When institutions accumulate during market selloffs, it often reflects long-term conviction in underlying fundamentals such as Solana’s high throughput, low transaction costs, and increasingly mature ecosystem.
Technicals
Despite the correction, SOL is testing a major ascending-trendline support that has been respected several times. Price recently dipped into liquidity near $127, a level that has previously marked swing turns.
If support holds, the bullish continuation scenario comes into focus. The first target stands at $253, followed by $295. A breakout above both levels would strongly support new all-time highs heading into 2026.
If support fails decisively, the next demand zone lies between $110 and $100. A breakdown of that zone increases the probability of a deeper move toward $80. For now, buyers continue defending trend support, keeping the broader structure intact.

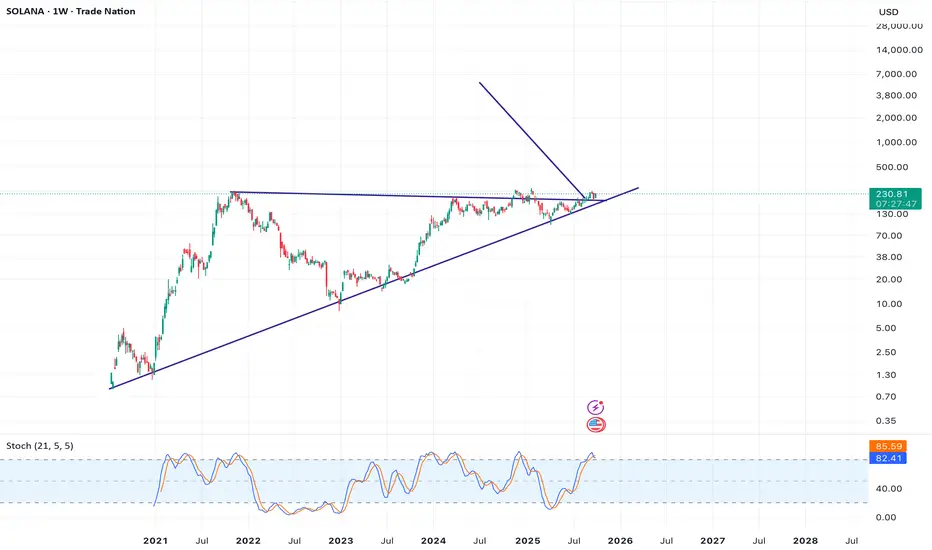
Solana ready for take offSolana is ready for take off. As long as it stays above the trend line, it will be targeting 5500 dollar. Weekly trend has been confirmed for many times. So it seems really powerful.
SOLUSD BEARISH PUSH..We Take a Sell position to the downside, and set our TP at this areas.. we look to see price hit 140.50, if momentum remains we should see price push towards 138.12 SL can be set at 148.34 , as the system nd edge is consign all criteria's have been met, so the push downwards towards this levels shud begin.
*TRUST THE SYSTEM*

SOL BEARISH SELL SELLthe overall market is very sceptic about the crypto lately ; as it reflects on the most traded crypto price , be ready to allocate more money to your next bull run on gold
it's happening now
