SOLUSD Looking strong selling from key resistance area📉 SOL/USD Technical Update (1H Timeframe)
SOL/USD showing a strong downtrend, with fresh selling pressure emerging from the resistance area around 156.27.
🎯 Technical Targets:
Support 1️⃣: 150.85
Support 2️⃣: 146.60
The momentum remains bearish — watch for potential continuation moves as long as price stays below key resistance levels.
⚠️ Risk Management Reminder:
Always apply proper risk and position management — protect your capital first.
💬 Like • 💡 Comment • 🔁 Share • ✅ Follow for more technical insights
Trade ideas


SOL/USD Looking sell from consolidation area 📉 SOLUSD Technical Update
SOLUSD showing selling pressure after a consolidation breakdown.
Currently retesting near $164.00, acting as a potential sell zone.
🎯 Technical Target: $156.80 (support zone)
🕐 Time Frame: 1H
Traders should monitor price action closely and apply proper risk management.
💬 Like | 💭 Comment | 🔁 Share

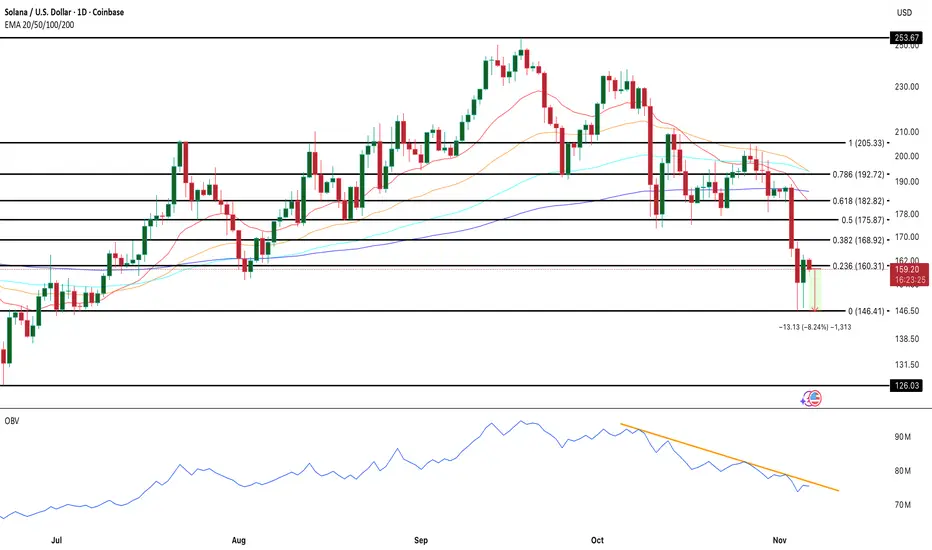
Solana Faces Key Technical Imbalance Ahead of Next MoveCOINBASE:SOLUSD trades near $159, caught between weakening technicals and fading volume strength. On the daily chart, a bearish crossover is forming, with the 50-day EMA on the verge of slipping below the 100-day EMA, hinting that sellers still control momentum. The On-Balance Volume (OBV) remains trapped under a descending trendline — every touch since mid-October has triggered short-lived rebounds.
Key support for COINBASE:SOLUSD sits at $146; a daily close below this could open the path toward $126. On the upside, bulls need a clean break above $168 to shift momentum, with further resistance at $182–$192.
On-chain data adds weight to the bearish tone: exchange flows flipped from heavy outflows to inflows this week, suggesting selling pressure is returning. Until OBV and money flows align with price action, Solana’s recovery remains fragile.
Solana Wave Analysis – 5 November 2025- Solana reversed from key support level 150.00
- Likely to rise to resistance level 175.20
Solana cryptocurrency recently reversed from the support area between the key support level 150.00 (which stopped the previous sharp downward correction (2) at the start of October), lower daily Bollinger Band and the two support trendlines from June and April.
The upward reversal from the support area stopped the impulse C-wave of the earlier ABC correction (2) from September.
Given the strength of the support level 150.00 and the oversold daily Stochastic indicator, Solana cryptocurrency can be expected to rise to the next resistance level 175.20 (former support from October).

SOLANAA correction followed and now it appears thet the price is testing the previous support zone (around 165)
if this level doese"t hold the movement could continue toward 140
however if it holds a rebound towerd 200-220 could follow

SOLANA HIGH PROBABILITY SETUPS SOON!!!🚨 SOL HIGH PROBABILITY SELL/BUY SETUP 🚨
* Here We Can See Clearly The Next Potential Moves For SOLUSD Coming Hours/Days.
* Keep Your Eyes Close On Your Trading Positions.
* Happy PIP Hunting Traders.
FXKILLA.

Solana 1/11/25As the bias is down trend there are plenty of room for scalping.
There is a scalp opportunity at the moment for little bull run from 185 to 190 in next few hours.
Based on smi 270/90/30 min (part of my strategy)
the price will move upwards tries to rich a 190-191$
Entry 185
Target 191
Stop 184
Enjoy.

SOLANA Dream Buy ZoneSolana is currently forming a very interesting potential ABC corrective structure leading into the 1-1 trend based fibonacci extension being approx. $215. The end of this current Wave C is forming an ending diagonal nearing the apex.
According to Elliot Wave theory, ending diagonals (wedges) tend to occur when the existing directional trend is showing signs of exhaustion and requires a pricing reset/rebalance. This can occur as a very fast, sharp move downwards before continuing in the direction of the broader trend which remains to the upside.
What interests me is the several zones of confluence that line up just below $180, being the overall target of the wedge, as well as the location of both major VWAP's from the high and the low , that can act as major support zones for a bounce.
This drop could be fast and scary, likely to shakeout many traders and investors especially those on high leverage.
Ive set my alerts here at the zone for a major long trade that could sustain itself to new highs.

SOL ReversalTerrrrrible week for Crypto, broadly, but I am watching a potential bullish divergence on the daily RSI for Solana.
This sell-off has been particularly pronounced, but I believe there will be some form of bounce provided this divergence sets tomorrow. If it does I am long with a short horizon, medium leverage, and tight stops.


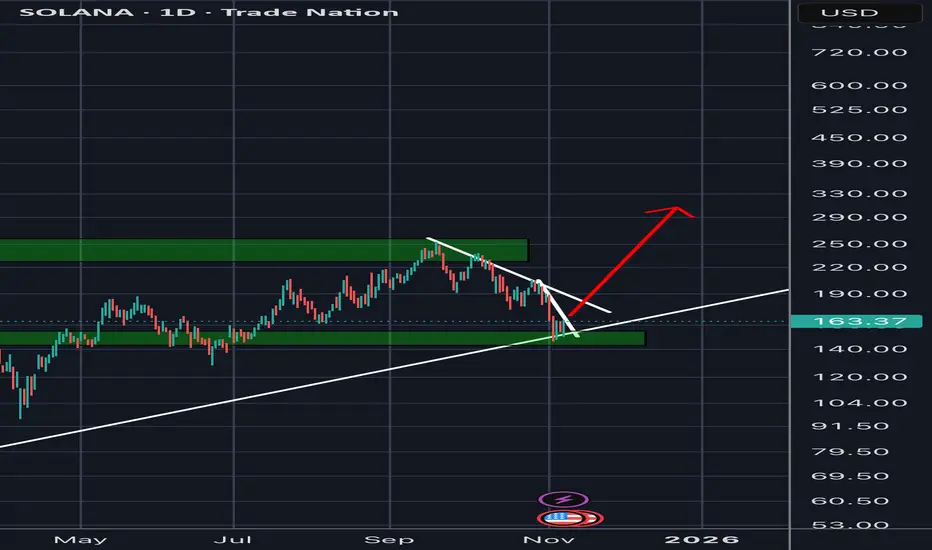
Solana (SOL/USD) — Potential Bullish Reversal in Play!After a strong sell-off into the key demand zone ($140–$150), Solana is showing early signs of recovery. The green zone has acted as a major support area, with previous price reactions confirming it as a solid buy zone.
If SOL can hold this level and form a solid higher low, we could see a bullish move toward the supply zone ($210–$230) — the red area on the chart.
📈 Technical Outlook:
Support: $140–$150 (Strong Demand Zone)
Resistance: $210–$230 (Supply Zone)
Current Price: $157
Bias: Bullish above $150
Invalidation: Daily close below $140
🔥 What to Watch:
Daily candle close above $160 could signal momentum shift.
Volume confirmation and RSI recovery would add confidence.
Possible “V-shaped recovery” toward the red zone if buyers step in.
💬 Your Turn:
What’s your outlook on Solana?
Do you think SOL will bounce from this support and continue the uptrend, or will bears drag it lower first?
👇 Share your thoughts in the comments and let’s discuss possible trade setups!
#Solana #SOLUSD #Crypto #TradingView #PriceAction #SupportResistance #TechnicalAnalysis #BullishSetup

(SOL) Spot Long 10-08-2025SOL /We have Government Shutdown Ending, ETF's, Clarity Act, Trump Tariffs Blocked, New Chair of the Federal Reserve, QE, & Maybe Stimulus Checks for the USA Taxpayers all Incoming Soon!
Plus,
Fear = Oversold = I Buy = $
SOL will RISE!
:)

SOL holds up wellCRYPTOCAP:SOL Price continues lower in the channel, a textbook ABC correction so far.
Wave 1 ended with a wedge throw-over. Price has found support above the Fibonacci golden pocket and High Volume Node at the channel's lower boundary. The probability is a continuation to the downside with a target of $140.
📈 Daily RSI tapped oversold with no divergence to suggest a bottom
👉 Continued downside brings up the $112 target, a great buy opportunity
Safe trading

Solana price path for the next days🚨 NOT a financial advice, do you own analysis TOO.
SOL lost some of its important supports but hope is still there. dont panic because of the recent market selloff.
despite the terrifying current situation i am hopeful for solana price. the RSI indicator has reached the oversold zone meaning the strength of sellers is weakening. however there is still room for further decline.
as illustrated in the chart i expect the price to fell to 130 if BTC Dominance increase as well. hence, we can make sure that sellers are out.
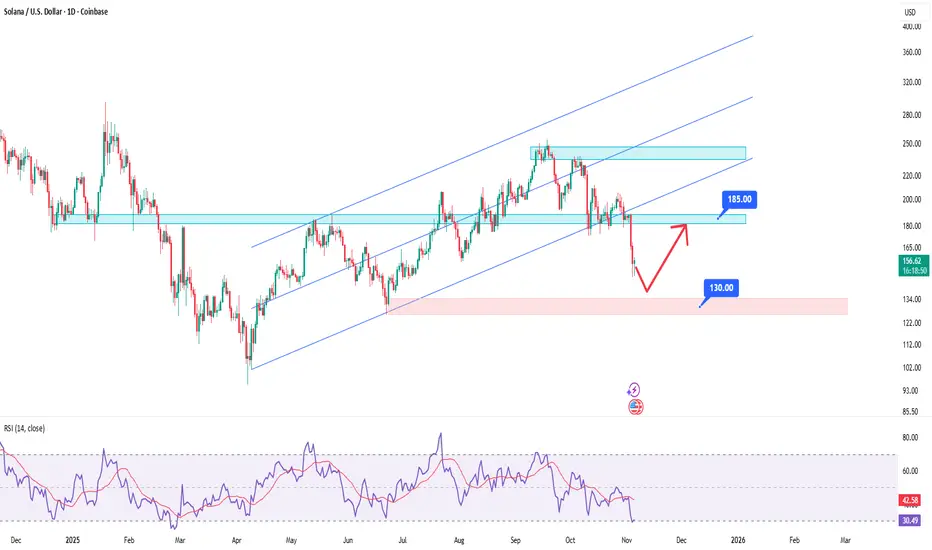
The most important uptrend line for SOLUSDAll crypto assets are way oversold these days (but everyone knows that already). This is totally understandable due to the longer government shutdown and other uncertainties (usual 4 year cycle which is normally already ended now).
It would not surprise me if we go further down than 150$ right now. Only because of the fact that BITSTAMP:BTCUSD even went below 100.000$ today!
In the most worst scenario, it really needs to bounce from the white uptrend line if we still want to see a better Q4 this year or Q1 2026.
According to the fib. retracement level this normally should be a good buy opportunity. If it holds above the white trend line, then we are still inside the ascending triangle (which is a bullish pattern).

SOLANA Pullback - DailyThis crypto coin has been bearish on the past few days, but it seems as it is a slight pullback towards the demand zone at 160 and 130, before it shoots upwards.
Let us wait and see if we can have a selling opportunities, aiming towards those zones.

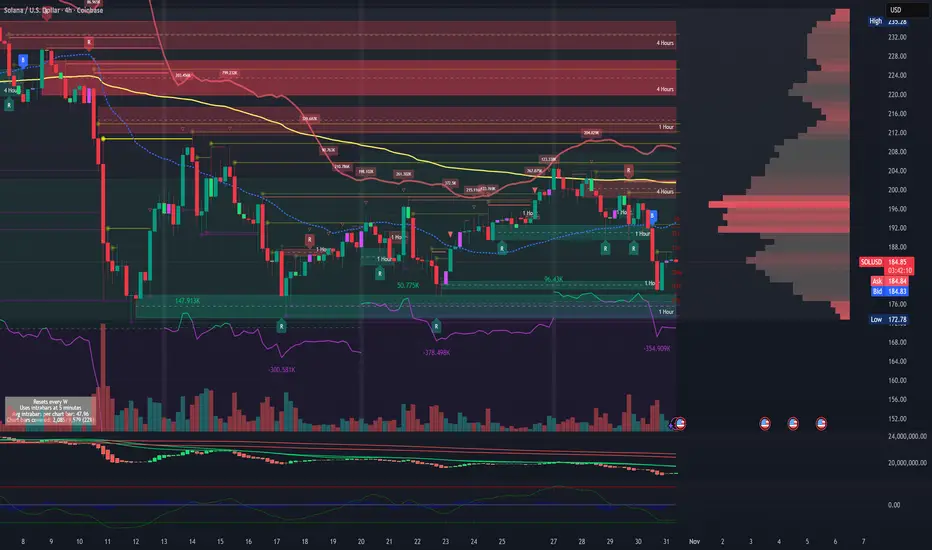
Solana Price Movement + Liquidation + Whale Map + Trade PlanTrade Plan:
Buy dips into $185 → $181 → $178 with a protective tail at $168, target $194 → $203 → $212+, and invalidate if $168 HTF breaks.
Price Movement + Liquidation + Whale Map
Solana has successfully rebounded from the key demand pocket at $178–$181, where aggressive buyers defended the prior 4H swing low and swept liquidity below the rising trendline. This bounce confirms continued smart-money defense of structure, following a multi-day corrective pullback after distributing into the $203–$208 supply band. Price is now stabilizing above the micro accumulation shelf at $183–$186, with intraday candles showing higher-lows and early bullish momentum returning, supported by volume absorption on each dip into the mid-$180s. As long as SOL holds the $181 reclaim, this remains a continuation accumulation phase, not a trend breakdown.
The next short-term move favors a grind-up retracement toward trapped shorts around $191–$194, followed by a sweep of the liquidity band at $197–$200 — the first key liquidation magnet above. A clean break and hold above $200 opens the door to speed-move expansion into $207–$212, where heavy resting sell walls and prior profit-taking nodes reside. Above this, breakout momentum could accelerate into $223–$231 on momentum ignition, but that remains a secondary stage target and depends on reclaim strength above the $210 shelf.
On the downside, major liquidation pools remain stacked beneath $182, then $178, and a deeper wash at $172–$168 (high-value tail liquidity + psychological flush zone). If price wicks into those levels, it would likely be a liquidity hunt rather than structural failure, provided bulls recapture the zone quickly. Whales have been accumulating consistently in the $168–$181 band for weeks, with on-chain order-flow showing absorption during each correction phase, confirming institutional accumulation rather than distribution. Sell walls reappear in layers above $203, $208, and $215, suggesting short-term volatility expected upon breakout but not necessarily cycle-top behavior — more likely controlled profit-taking.
Execution Plan: Bias remains buying retracements, not chasing. Primary dip accumulation zone remains $183–$185, ideal add layer at $181–$178 on wick flush, and tail-hedge allocation stands at $172–$168. Risk defined below $168. First take-profit ladder rests at $194 → $200 → $212, with secondary hold targets into $223+ if strength persists. Maintain core long ride if momentum and on-chain flows stay supportive.
Invalidation: The setup remains fully valid as long as SOL does not close a 4H candle below $178 and does not lose $168 on HTF closing basis. A persistent breakdown below $168 would shift structure into a larger ABC corrective phase, delaying continuation rather than ending the macro bull drive. Until then, liquidity behavior, trend structure, whale positioning, and momentum context remain biased to the upside with accumulation-driven volatility.
SOLCRYPTOCAP:SOL has formed a clear inverse head and shoulders pattern, a classic bullish reversal setup. The measured move from this structure projects a significant upside if neckline resistance breaks with volume, suggesting the pattern is likely to play out.

SOLANA: The last wave before takeoff or a deep pullbackSOLANA: The last wave before takeoff or a deep pullback
📈 Weekly Scenarios
Bullish scenario: SOL holds above ~$190, breaks through ~$260.83 → start of uptrend → target ~$300+.
Consolidation: price trades between ~$190 and ~$260, wave structure not defined until breakout.
Bearish scenario: breakout of support at ~$190 with volume → likelihood of a significant correction to ~$150–$160.
✅ Conclusion
Solana is at a key decision point for the coming week:
The ~$260.83 level is a benchmark for a bullish resumption.
The ~$190 level is a critical support level.
A breakout upward will provide upward momentum; a breakout downwards is likely a pullback. Follow price reactions at the highlighted levels and confirmation of the wave structure before making trading decisions.

SOL/USD Strong Bullish Trend Bullish from key support 199.30📈 SOLUSD Technical Update (30-Min Time Frame) 💰
🚀 Bullish Trend in play — Buyers holding strong around the 198.30 zone!
If momentum continues, we’re eyeing the following
target levels:
🎯 1st Target: 201.60
🎯 2nd Target: 202.50
🎯 3rd Target: 205.20
Stay alert, traders! Watch for confirmations and manage your risk wisely. ⚡
#SOLUSD #CryptoTrading #TechnicalAnalysis #BullishTrend #Solana #PriceAction
💬 Like | 🔁 Share | 🧠 Comment your view below!

SOLUSD H4 | Bearish Drop-Off in MomentumSOL/USD has rejected off the sell entry which is an overlap resistance that aligns with the 50% Fibonacci retracemnt and could drop from this level to the downside.
Sell entry is at 204.97, whichis an overlap resistance that aligns with the 50% Fibonacci retracemnt.
Stop loss is at 221.25, whichis a pullback resistance that is slightly below the 78.6% Fibonacci retracement.
Take profit is at 174.91, whichis a swing low support.
Stratos Markets Limited (tradu.com ):
CFDs are complex instruments and come with a high risk of losing money rapidly due to leverage. 68% of retail investor accounts lose money when trading CFDs with this provider. You should consider whether you understand how CFDs work and whether you can afford to take the high risk of losing your money.
Stratos Europe Ltd (tradu.com ):
CFDs are complex instruments and come with a high risk of losing money rapidly due to leverage. 70% of retail investor accounts lose money when trading CFDs with this provider. You should consider whether you understand how CFDs work and whether you can afford to take the high risk of losing your money.
