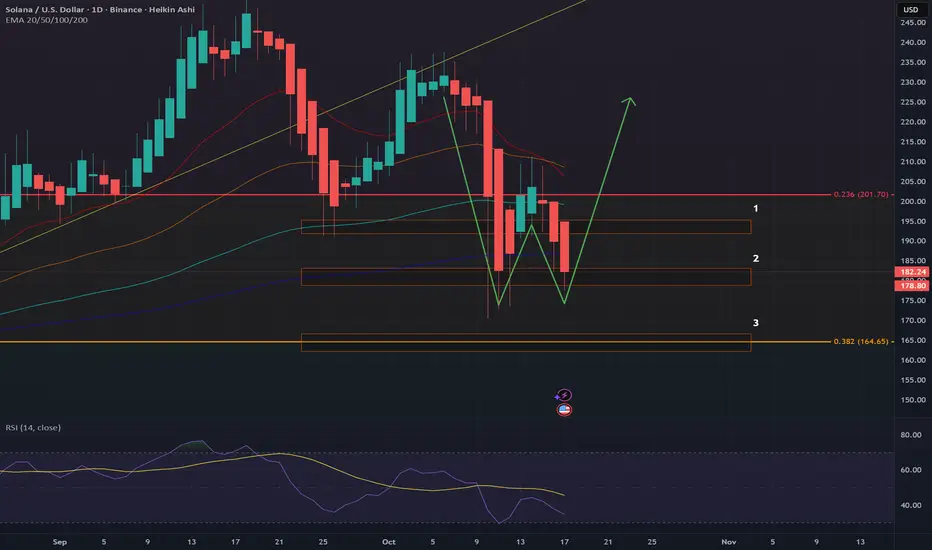
Inverse H&S pattern: we have seen that before !A possible scenario I have in mind. See for yourself on this chart: not that long ago we had seen similar behavior. We are building good support here and the majority wants to see another uptrend. Much love for Solana!
Trade ideas
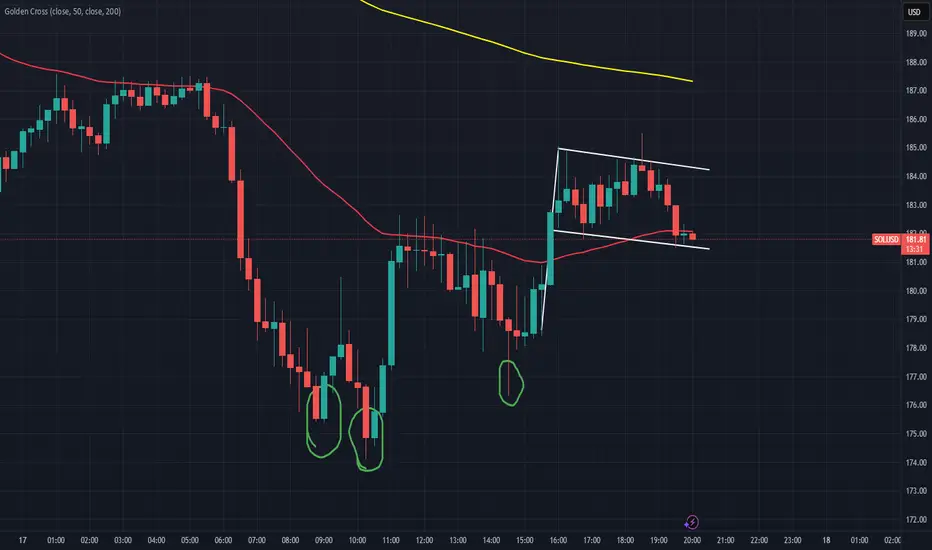
Bullish reversal pattern + bullish flag (is the bottom in now?)Observed a bullish reversal pattern, followed by a bullish flag pattern. We made a double bottom today. I think this might be the actual dip that can be bought. Wondering if we remain above 180$ for a longer time since there is quite some fear on the market..
SolanoThis Volume Profile is a problem for Solano. In my last related post, I mentioned that I'm not a fan of this chart setup, because there's low volume, and a huge gap to the VPVR shelf. I said I see trepidation on support, and nothing has changed my opinion since then.
This looks like trouble below for Sol. I would bail. I'm not in it, nor have I been, but I would bail.

SOL TAKE YOUR SELLToday i made around 8k profits from this trade and it's still running bearish ; btc also have some bearish movement stick to the plan and be patiente

BUY ORDER SOL-Trendline retest red
-Support
-Trendline retest green
-Fib compleet
I THINK WE ARE STILL GOING TO HAVE A PUSH

SOL potential double bottom setupI am seeing a potential double bottom setup for SOL. We would have to close at around 180USD, beyond which an upside turn is possible. DYOR and let me know your thoughts
Friday Massacre - cash ready! Another Friday massacre
The chart is looking extremely bearish.
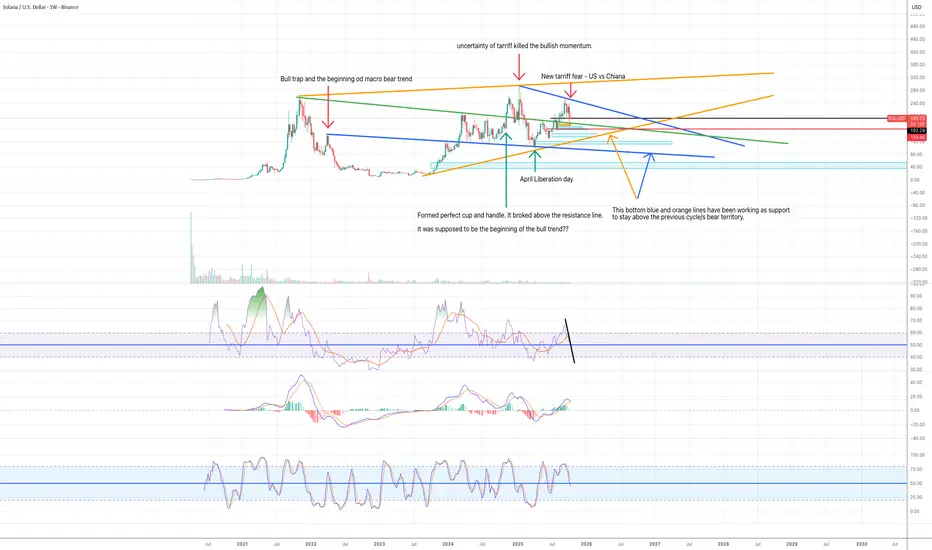
I think the price is going to move to the $95-107 zone where the V-shape recovery happened after April liberation day.
Many people stayed on the sideline without getting into the market. I think the price wants to come back to that level for reset before the next big move up.
It structurally makes sense as well. You can see the fib retracement level in the chart from the previous cycle's ATH to the bear market bottom.
I often (not always) see Fib 0.786 and Fib 0.236 work as the last line of defence. So when the price breaks and closes above Fib 0.786, it eventually moves to the upside even if it temporarily pulls back.
In case of the down trend, if the price breaks and closes below Fib 0.236, the price will eventually move to the downside.
When you look at the Solana weekly chart, the price broke above 0.786 in Nov 24. It failed to continue to move up and spent months consolidating in the tight range. So I think it will eventually go up, but the chart is not telling me no so fast.
All weekly momentums indicate bearish momentum is building up.
I think the price might go to the following areas:
1) $135 - Fib 05, previous lower high, ascending support line, the level the final bull trap happened in 2022
2) $106.5 - Fib 0.382, liquidity pool, April liberation day bottom
3) $100 - psychological level
4) $ 68 - 100 - Fib 0.236-0.382 - absolute capitulation zone.

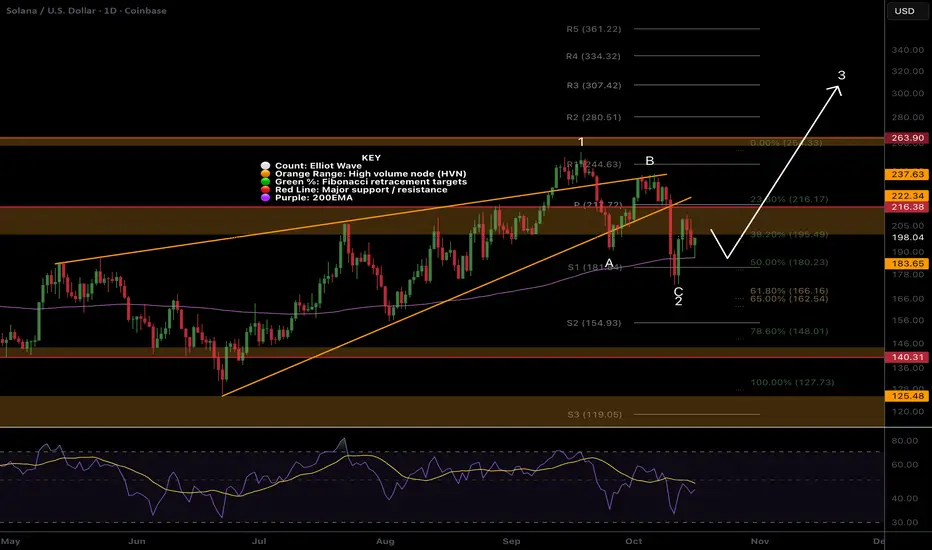
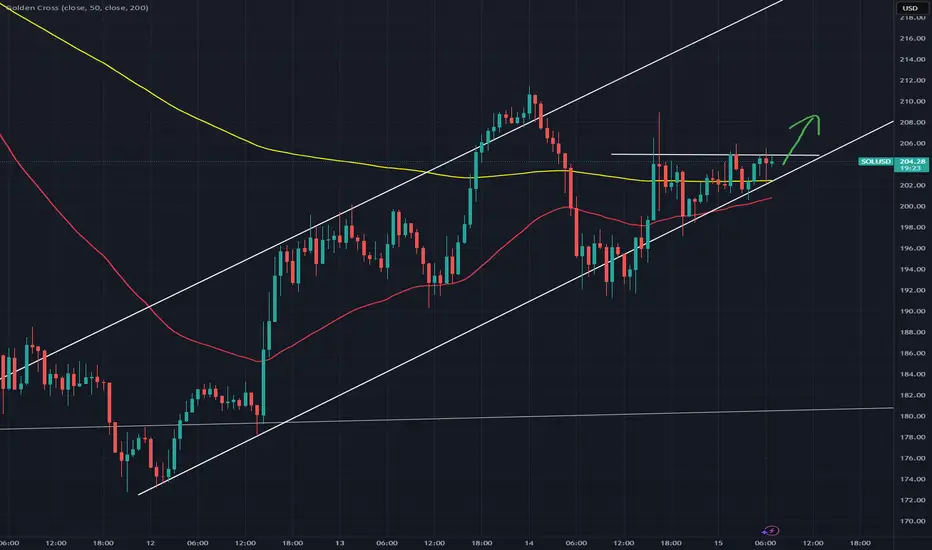
$SOL at major resistance, bottom is in?CRYPTOCAP:SOL bottom appears to have printed a text book ABC correction for wave 2 ending with a swing below the daily 200EMA and S1 pivot, front running the Fibonacci golden pocket.
However, Solana is at major resistance now and being rejected. RSI did not have bullish divergence or reach oversold so traders should be cautious.
Its holding up much better than most alt coins after Friday...
A bottom may be found at daily 200EMA and wave 3 may begin...
Safe trading
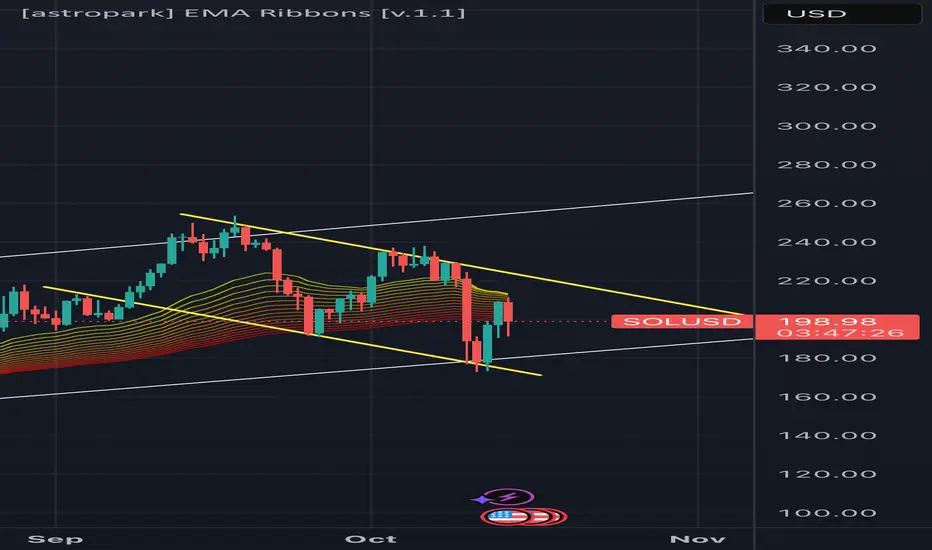
Where does the price find a bottom? I can see a few patterns in a weekly chart.
1) The price is moving inside the blue descending wedge pattern.
2) The price is moving inside the orange ascending wedge pattern.
3) Green descending support/resistance line is the line that completes a huge cup and handle pattern.
What do you think? I would like to know what others see.
Have a nice weekend.
Another Friday crush?? Price action is extremely bearish. I can see the same price action of the last Friday is unfolding in 1H chart.
When I analyse a chart, I use trendl ines, Fib retracement, EMAs, and momentum indicators. But when the action is so volatile and I feel like I no longer know what the hell is going on, I remove all the indicators and look for clear liquidity zone in higher time frames: Where did the price move up too quickly and left unfilled buy orders, and when did the price drop too quickly and left unfilled well orders?
The problem of Solana is the price has moved down and moved up way to fast at the end of last bull cycle and in the beginning of this bull cycle.
Solana price fell from $250 to $82 in two months at the end of 2021. And after the bull trap in March 2023, the price again fell rapidly from $140 to $36 in two months. After the spectacular fall, Solana spent 16 months basing between 8 and 46 for 16 months. However, when it started to move up in October, it went up too quickly again. It moved from $22 to $200 in 6 months.
The past 18months, Solana spent most of the time in the range bound between $126 and $260, satisfying both buying and selling demands. The price can eventually go up, but I see lots of downwards pressures in every time frame:
Monthly:
Large unmitigated fair value gap between $45 and $80.
Price is trapped inside the descending wedge pattern. It is a bullish pattern. However, if the price does not break and close above the descending resistance line, the price is likely to move to the downside.
Momentum indicators are also in the bull zone. However, RSI and MACD are starting to move to the downside. It makes me think the price correction is happening. It is a monthly chart, so it won't resolve quickly.
Weekly:
I can see a diamond pattern. The price is trapped in the shape of the diamond. It is usually a bearish pattern.
The price was moving up strongly along the ascending support line (purple line). However, the last Friday's crush went down to sweep the liquidity (orange rectangular box) and I can see two more fair value gaps sitting below it.
All weekly momentum indicators are still in the bull zone, however, RSI lines and Stochastic lines are now crossed to the downside. MACD lines are very close to cross as well.
Daily:
The price is still above EMA 200 and also above the support line, however, EMA 55 is about to cross over EMA 12 and 21. Yesterday's candle retested EMA 12/21/55 and closed below it.
MACD are deeply in the bear zone and has no sign of recovery.
RSI and Stochastics are reset to move to the downside.
1H:
EMA12/21/55/200 are perfectly lined up for the bear move.
Before last Friday's crush, the price held above $217 for a few days, but it eventually capitulated. I can see the same set up unfolding. And it is Friday again.
There is an unmitigated fair value gap in the $212-218 zone (immediate one) , so the price can move up there to fake out and move down. I have no idea what the market will do. I can see in a daily chart the price is moving inside the descending parallel channel. So if the price can hold above the purple ascending trend line, it might recover from there.
It is a very difficult market. When you have a strong bias, you will always find what you want to see. I have to pay attention to what the price is doing and hopefully react to it correctly.
Good luck.

SOL Ascending Triangle Solana is in an ascending triangle with resistance at $260 and support at $125. Look for $260 resistance to turn to support.

SOL Bearishthis is the last set up for bearish movement ; after retarcing those key level and after the current regulation solana is moving downward

SOL/USDT: Recovering from Flash Crash with Bullish Setup FormingSOL/USDT rebounded sharply from the $170 support following a flash crash and is now consolidating near the $200 level within a mid-range structure. Price action displays a sequence of impulse and correction legs, indicating buyers are attempting to regain control.
A stable close above $210 could confirm renewed bullish momentum toward the $230 resistance zone. The broader setup points to range accumulation, with potential for an upward breakout if momentum continues to build.

Long I opened a long position for a swing trade this morning.
A daily candle is still below EMA 12/21/55 and has not broken above the descending resistance line, however, I see a lot of bullish signs in the chart. I am cautiously optimistic, however, the bull is not in full control yet.
Daily:
Stochastic formed a clear positive divergence and is no in the bull zone.
RSI lines are trapped inside the descending triangle. The momentum is clearly building up and I am anticipating it to break to the upside given RSI line is starting to move to the upside and slow
MA (orange) line is also starting to tilt to the upside.
MACD lines are still in the bear zone, however, histogram shows the bearish momentum is weakening.
A daily candle is still below EMA 12/21/55, however, the price strongly held above the previous higher low at $190 (blue horizontal line) .
A daily candle is also above EMA200, two major support lines (purple and orange lines).
4H:
All three momentum indicators are in the bull zone now.
The price moved to the purple support line, moved up, retraced to retest Fib 0.382 level.
The price is above both EMA 12 and 21.
Trade plan:
Entry price: $202
S/L: $189
Target : $223

H&S pattern's right shoulder turned into an ascending triangle!SOLUSD is showing real strength here, the bulls are not giving up. Staying above the $200 was really needed to not form a "perfect" H&S pattern.
I think that we will see a breakout from this point. Please do not see my ideas as your personal investment advise. I am only sharing ideas here.
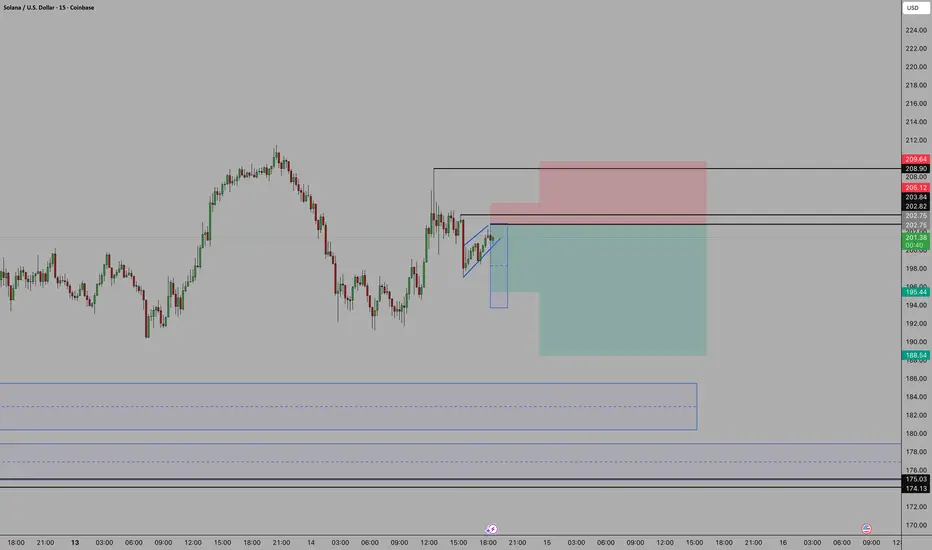
15 min zig zaglooking for one more impulsive move down out of this flag like part in this correction.
simple short term
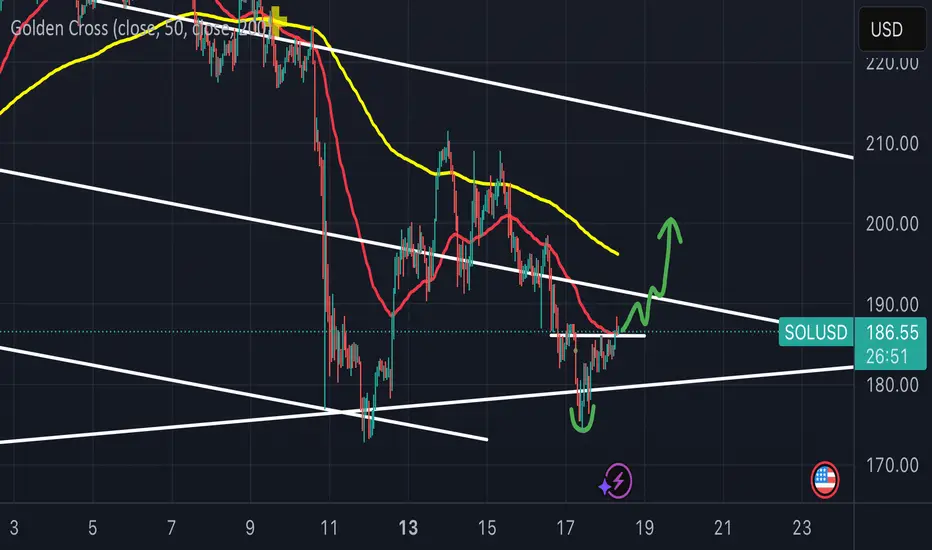
Descending channel: what is next for SOLUSD?There is a head and shoulder pattern drawn starting from 12 october until now. It will most likely go down at first. I hope to see a bounce again from the lower uptrend line (in white). Which would make a big chance to breakout from the descending channel pattern.
Another dip coming? Buy the strength, insteadThe current price action is very similar to that in May/June 2025 (see yellow rectangular box in the charts).
In May, the price started to finally recover from April's bottom. It started to move above the major support/resistance line (purple line in the chart) that was forming a massive cup and handle pattern, but it ende up to be a fake out and the price started to move to the downside again. The real recovery started after the price dropped to the unmitigated fair value gap (blue rectangular box). I am seeing a very similar set up in the current price action.
On last Friday, the price aggressively dropped to the same major support/resistance line (purple line) . The price held that level and spectacularly bounced up on weekend. It was the great buy the dip opportunity, but I had a feeling that there would be another deeper dip to follow.
The reason for that is that higher time momentum indicators were incredibly bearish and it didn't give me any sense of a V-shape recovery. Also a skeptical side of me makes me think that when there is such a clear bounce at the key area, it becomes so obvious where people place S/L (just under Friday's wick). If I were a market maker, I would definitely try to push the price down to take all the liquidity out.
What I am seeing in the charts:
Daily:
Both RSI and MACD are in the bear zone and pointing to the downside.
Stochastic indicator formed positive divergence, but Stochastic is more reactive and when the direction of the stochastic is contradicting RSI and MACD, it is almost always a corrective move.
EMA200 is cutting across three candles. When EMA200 is dead horizontal and sitting on the candles, EMA200 works like a magnet. The price tends to oscillate until strong momentum builds up to push the price to one direction.
4H:
When you see the price in the 4H chart, it bounced up to Fib 0.618 level and EMA 200 (proper pull back) and now it is starting to move to the downside.
But the most important thing is that there is a cluster of unmitigated fair value gap in the $135-$155 zone (orange rectangular block). It takes a lot for the price to move to that level, however, yesterday's daily candle in both SP500 and Nasdaq is trapped inside Friday's massive bear candle. If traditional market starts to break down, Solana will definitely fall further.
Stochastics formed negative divergence and started to roll to the downside.
MACD is still in the best zone and starting to lose bullish momentum.
RSI slow MA line is still in the bear zone and RSI line is already rolling to the downside.
Conclusions:
It is not a bad zone to nibble, but definitely not the time to open a leveraged position!!
It is better to miss the absolutely bottom and buy the strength.
Good luck !

DUMP IT!Potential dump targets if this crash comes - chart is in log scale because linear targets go below zero lmfao - this probably going to be ugly if it plays out.

Long —Low Leverage (if any)
In a bullish case for Solana trading around $220, is poised for significant growth due to strong network adoption, with a record $13.9 billion stablecoin supply and robust DeFi activity, coupled with whale accumulation and partnerships like Sharps Technology’s integration with Jupiter Exchange. Technical indicators, including bull flag patterns and EMA crossovers, suggest minimal resistance up to $250, with short-term targets of $230-$260 by October’s end, medium-term goals of $290-$350 by early 2026, and long-term projections potentially exceeding $500 by 2030. The potential approval of spot Solana ETFs could drive billions in institutional inflows, further fueling a rally, though risks like market volatility remain.

SOLUSD H4 | Bullish ReversalSOL/USD is reacting off the buy entry which is a pullback support and oculd rise from this level to the upside.
Buy entry is at 204.32, which is a pullback support.
Stop loss is at 187.97, which is an overlap support.
Take profit is at 228.36, which is an overlap resistance that aligns with the 78.6% Fibonacci retracement.
High Risk Investment Warning
Trading Forex/CFDs on margin carries a high level of risk and may not be suitable for all investors. Leverage can work against you.
Stratos Markets Limited (tradu.com ):
CFDs are complex instruments and come with a high risk of losing money rapidly due to leverage. 65% of retail investor accounts lose money when trading CFDs with this provider. You should consider whether you understand how CFDs work and whether you can afford to take the high risk of losing your money.
Stratos Europe Ltd (tradu.com ):
CFDs are complex instruments and come with a high risk of losing money rapidly due to leverage. 66% of retail investor accounts lose money when trading CFDs with this provider. You should consider whether you understand how CFDs work and whether you can afford to take the high risk of losing your money.
Stratos Global LLC (tradu.com ):
Losses can exceed deposits.
Please be advised that the information presented on TradingView is provided to Tradu (‘Company’, ‘we’) by a third-party provider (‘TFA Global Pte Ltd’). Please be reminded that you are solely responsible for the trading decisions on your account. There is a very high degree of risk involved in trading. Any information and/or content is intended entirely for research, educational and informational purposes only and does not constitute investment or consultation advice or investment strategy. The information is not tailored to the investment needs of any specific person and therefore does not involve a consideration of any of the investment objectives, financial situation or needs of any viewer that may receive it. Kindly also note that past performance is not a reliable indicator of future results. Actual results may differ materially from those anticipated in forward-looking or past performance statements. We assume no liability as to the accuracy or completeness of any of the information and/or content provided herein and the Company cannot be held responsible for any omission, mistake nor for any loss or damage including without limitation to any loss of profit which may arise from reliance on any information supplied by TFA Global Pte Ltd.
The speaker(s) is neither an employee, agent nor representative of Tradu and is therefore acting independently. The opinions given are their own, constitute general market commentary, and do not constitute the opinion or advice of Tradu or any form of personal or investment advice. Tradu neither endorses nor guarantees offerings of third-party speakers, nor is Tradu responsible for the content, veracity or opinions of third-party speakers, presenters or participants.

Solana Wave Analysis – 13 October 2025
- Solana reversed from key support level 150.00
- Likely to rise to resistance level 210.00
Solana recently reversed up sharply from the key support level 150.00, which has been reversing the price from July, as can be seen below.
The upward reversal from the support level 150.00 stopped the earlier sharp downward ABC correction 2 from September.
Given the recent breakout of the round resistance level 200.00 and the strongly bullish crypto sentiment seen today, Solana can be expected to rise to the next resistance level 210.00.

Solana's Crucial Test: Approaching Trend Change ResistanceSolana's Crucial Test: Approaching Trend Change Resistance
SOL/USD on the 4-hour timeframe illustrates a significant market movement, characterized by a sharp correction followed by a determined recovery. Solana is currently testing a critical confluence of resistance, which will be instrumental in dictating its near-term direction. This analysis will detail Solana's recent price action and highlight the pivotal levels that define its current standing.
The Retreat and The Resilient Foundation
Solana experienced a robust uptrend that peaked near the 240 level in early October. This was succeeded by a notable decline, as price broke down through several key levels. It pierced the 230 1st Resistance (now support), the 220 to 224 Deciding Area, and the 215 Key Support (now resistance). A particularly sharp drop on October 11th brought Solana down to establish a firm base around the 175 support level. This zone demonstrated strong buying interest, effectively halting the decline.
The Grand Comeback: From Depths to Decision
Following the bounce from the 175 support on October 11th, Solana initiated an impressive recovery. This upward movement is marked by a series of strong green candles, indicative of renewed bullish momentum. The price has successfully climbed from its lows, consolidating above the Next Support near 190 (green band) and showing a clear upward trajectory, as depicted by the dotted white lines forming a potential ascending structure.
This significant comeback has now brought Solana directly into the 200 to 205, Trend Change zone (light green band). This area is further reinforced by a descending red trendline, creating a critical overhead resistance confluence.
The Current Crossroads: 200 to 205 and the Trendline
Solana is currently engaged in a battle within the 200 to 205, Trend Change zone, simultaneously confronting the descending red trendline. This convergence of resistance is crucial; a decisive break above both this zone and the trendline would signify a potential shift in the short-term trend from bearish to more neutral or bullish. Conversely, a rejection here could lead to a consolidation or a retest of immediate support levels.
Key Levels to Watch: Resistance & Support
On the Upside (Resistance):
200 to 205, Trend Change & Descending Trendline: This immediate confluence represents the most critical overhead barrier. A sustained break above these would be a strong bullish signal.
215 Key Support (now potential resistance): Above the 200-205 zone, this red band represents the next significant resistance, which previously acted as crucial support.
220 to 224 Deciding Area: This grey band is a higher resistance zone that previously served as a consolidation and pivot point.
230 1st Resistance: The yellow band marks another significant resistance point, aligning with prior peaks during the earlier uptrend.
240: The dark red band represents the previous local top.
On the Downside (Support):
Next Support near 190: This green band acts as immediate support for the current recovery. Maintaining price above this level is important for continuing the upward momentum.
175: This dark green band remains the ultimate foundational support. A break below this level would invalidate the current recovery structure and could signal further downside.
Potential Scenarios from Here
The chart illustrates potential paths forward with dotted white lines:
Bullish Scenario: A successful and sustained breakout above the 200 to 205, Trend Change zone and the descending red trendline could propel Solana towards the 215 Key Support (now resistance) and subsequently the 220 to 224 Deciding Area.
Correction Scenario: A rejection from the current resistance confluence might lead to a retest of the Next Support near 190. A deeper pullback could see the price testing the 175 support if the 190 level fails to hold.
Conclusion
Solana has demonstrated strong resilience, bouncing robustly from the 175 support. It now faces a critical test at the confluence of the 200 to 205, Trend Change zone and the descending trendline. The ability of Solana to decisively overcome this resistance will be key to determining whether its recovery can evolve into a more significant trend reversal or if a period of consolidation or deeper retracement is more likely. Close observation of price action around these crucial levels is essential for understanding Solana's short-term market direction.
Disclaimer:
The information provided in this chart is for educational and informational purposes only and should not be considered as investment advice. Trading and investing involve substantial risk and are not suitable for every investor. You should carefully consider your financial situation and consult with a financial advisor before making any investment decisions. The creator of this chart does not guarantee any specific outcome or profit and is not responsible for any losses incurred as a result of using this information. Past performance is not indicative of future results. Use this information at your own risk. This chart has been created for my own improvement in Trading and Investment Analysis. Please do your own analysis before any investments.
