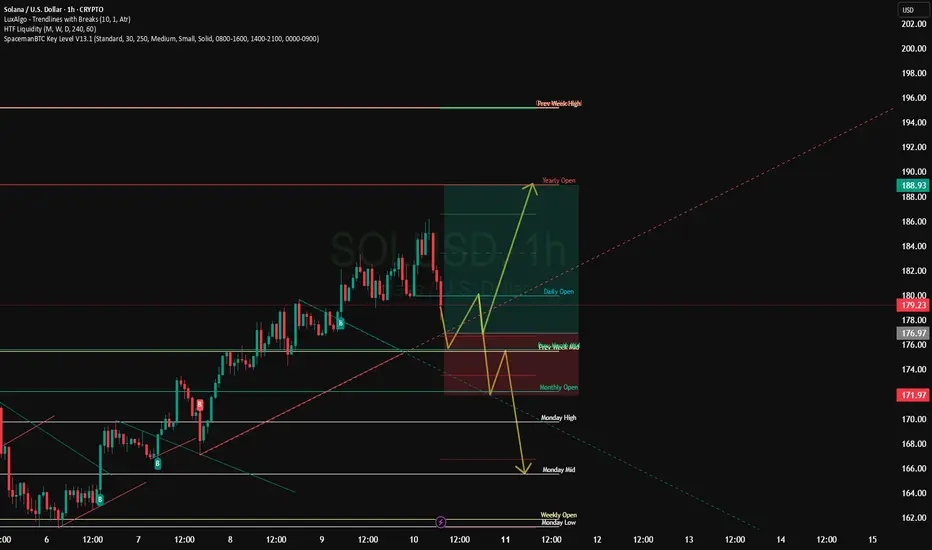
SOL/USD – 1H | Key Levels in Focusrice is currently reacting near the Swing Low after rejecting from the Strong High / P1D High Equal High zone.
If the swing low fails to hold, we could see a run through:
📍 Bearish Roadmap:
1️⃣ Break of Swing Low → Move to P1D Low
2️⃣ Continuation toward Strong Low / UC BOS
3️⃣ Final delivery into the Order Block (OB) around 164 for potential reversal.
Key Levels:
Strong High / Equal High: 186.00
Swing Low: 178.00
P1D Low: 176.00
Strong Low / UC BOS: 174.00
Order Block: 164.00
🎯 Watching for reaction at each level for intraday trade setups.
Trade ideas

Solana's Bullish Breakout: Eyes on $228.1FenzoFx—Solana broke the structure on July 21, and then pulled back below this level, providing discount entries. We expect the uptrend to resume and target the resistance at $228.1.
A dip toward $170.0 followed by a better price for bullish entry at $161.2 could be ideal and low risk. Monitoring these levels for candlestick patterns, break of structure in 5 minutes, and fair value gaps to confirm if there would be a bounce and continuation of the uptrend from any of these two levels.

SOL/USD – Strong Trend, Testing Highs🟢 LONG above $186.80 – potential push toward $190+
SOL is trending cleanly above its 200 SMA, with price pulling back modestly before pushing toward resistance at $186.80. RSI at 50 shows balanced momentum but room for upside. A breakout could fuel a strong rally continuation.
📊 Keywords: #SOLUSD #BreakoutWatch #CryptoLong #TrendMomentum #AltcoinRally

Solana - is showing reversal signalsTechnical structure and patterns
On the daily chart, SOL has formed an inverse head and shoulders pattern, a classic reversal pattern. A breakout above the neckline with increasing volume could lead to a move to $247.71. However, weak demand could jeopardize this scenario, triggering a fall even to $138.05.
The asset has grown by 18% in a week, reaching $181, but there are liquidation clusters and strong resistance at $184–185. A breakout of this range could accelerate growth, with a possible surge to $256.
Support and resistance levels
Resistance:
The key zone is $180–184, a breakout of which would open the way to growth.
Support:
Important zones are $153–143, where cumulative activity was previously observed.
Network background and volume dynamics
The number of tokens on exchanges has decreased by almost 10%, which indicates a decrease in selling pressure. A "golden cross" is also forming between the 100- and 200-day EMAs - a bullish signal with target levels above $176.
Earlier, SOL rebounded from the support zone around $160 and is moving towards a breakout of $175. The further trajectory - growth or consolidation - will depend on how the price behaves at the border around $175.
Solana Short SetupHi everyone.
As I see a CHoCH in 1H TF, so I think this entry level has a good potential to set two sell order.
One with a tight SL that I suggest don't enter more than 0.5% of your capital for this, and the second one with a larger SL level.
I'll update the TP levels later...
Please consider the risk management.
Let's see the market reaction..
Dear traders, please support my ideas with your likes and comments to motivate me to publish more signals and analysis for you.
Best Regards
Navid Nazarian
$SOL (Solana) 6HPrice is trading within an ascending channel, currently around $182. A breakout continuation could target $195 first, followed by $205. Support remains at the lower channel line, keeping the short-term bullish momentum intact.
Solana remains one of the fastest-growing L1 ecosystems with strong DeFi, NFT, and gaming adoption. Network activity and developer growth remain high, reinforcing investor confidence ahead of potential ecosystem upgrades.

SolanaSol usdt Daily analysis
Time frame daily
Risk rewards ratio =3 👈👌
My target= 303 $
Technical analysis
Let's take a look at the chart. The price is between two ascending diagonal lines. At times it has approached the upper line but has not touched it and has turned back. But the lower line has become a good support and can give us a signal that the price will not go lower than this. This support has worked well even in severe declines.

SolanaSol usdt Daily analysis
Time frame daily
Risk rewards ratio >3.5 👈👌
Target 248$
Green line is a historical up trend for solana

Solana: On track and In playSolana’s still dancing to our tune so far — now it’s all about the patience game. Let’s see what unfolds 🫣

SOL/USD – Rejection at $186.19, Testing SMA200🔴 SHORT if $179.65 breaks – potential slide toward $177.60
SOL was rejected sharply from $186.19 and is now hovering above its 200 SMA. RSI is soft at 42, hinting at momentum loss. Breaking $179.65 could trigger further downside toward recent lows.
📊 Keywords: #SOLUSD #RejectionZone #CryptoShort #BearFlagSetup #PriceAction
"SOL/USD BULLISH HEIST! Steal Profits Like a Pro"🏆 "SOLANA HEIST ALERT! 🚨 Bullish Loot Ahead – Thief Trading Style (SOL/USD)" 🏆
💸 Steal Profits Like a Pro – Day/Swing Trade Plan 💸
🌟 Greetings, Market Pirates & Profit Raiders! 🌟
Hola! Bonjour! Hallo! Marhaba! 🤑 Dear Thieves & Trend Snipers, the SOL/USD vault is WIDE OPEN! Time to execute the heist with precision.
🔥 THIEF TRADING MASTER PLAN 🔥
🎯 Mission: LONG SOLANA (Escape Near Blue ATR Line)
⚠️ Danger Zone: Overbought | Consolidation | Bear Trap Ahead
🏆 Rule: "Take Profit & Treat Yourself – You’ve Earned It!" 💪💰
📈 ENTRY STRATEGY (The Heist Begins!)
"SWIPE THE BULLISH LOOT!" – Enter at any price, but smart thieves use:
Buy Limit Orders (15-30min timeframe)
Swing Low/High Pullbacks for optimal entry
DCA/Layering Strategy (Multiple limit orders for max loot)
🛑 STOP-LOSS (Escape Plan)
📍 Thief SL: Below nearest low (Daily MA @ $160.00)
⚠️ Adjust SL based on: Risk tolerance, lot size, & DCA layers.
Pro Tip: Tighten SL if market flips bearish!
🎯 TARGETS (Profit Escape Routes)
🎯 Main Take-Profit: $220.00 (or exit earlier if momentum fades)
🧲 Scalpers: Only LONG! Use trailing SL to lock gains.
💰 Big Bank Thieves: Go all-in. Smaller Raiders: Join swing traders.
📰 WHY SOLANA? (Fundamental Boosters)
Bullish Momentum (Tech + Sentiment Driving Price)
Macro Trends, On-Chain Signals 👉 Check Liinkss 🔗
Intermarket Analysis: Crypto & equities syncing for gains!
⚠️ TRADING ALERTS (News & Risk Control)
🚨 News = VOLATILITY! Avoid new trades during major releases.
🔒 Protect Running Trades: Use trailing stops to secure profits.
💥 SUPPORT THE HEIST! (Boost & Win Together) 💥
🔥 Hit the "LIKE" & "BOOST" button to strengthen our Thief Trading Squad!
🚀 More Heist Plans Coming Soon – Stay Tuned! 🤑🎉
📌 Reminder: This is NOT financial advice – DYOR & manage risk!

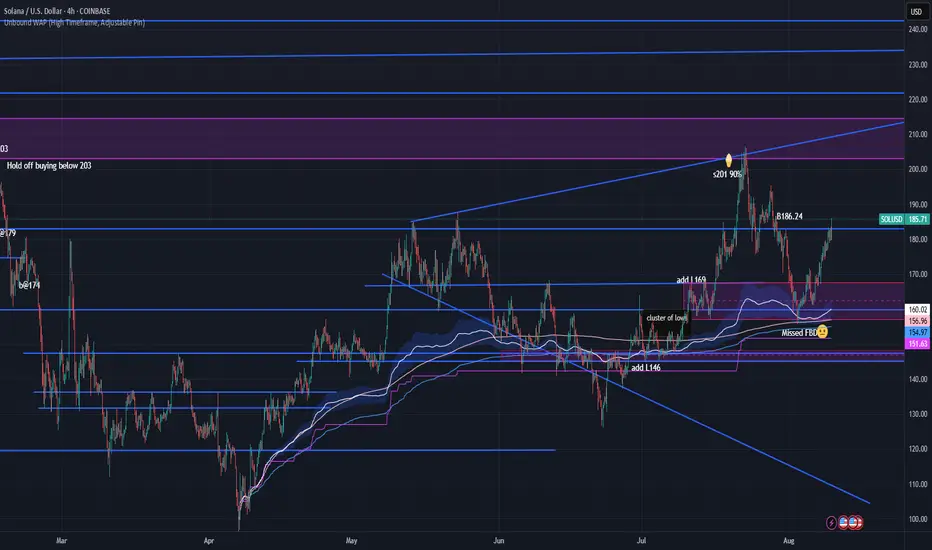
Ideal FBD on SOL with UWAPAug 25. FBD of cluster of lows from July 10-16. 6 day balance.. Combine the FBD with UWAP (Unbound WAP High Timeframe Adjustable Pin. A+ setup
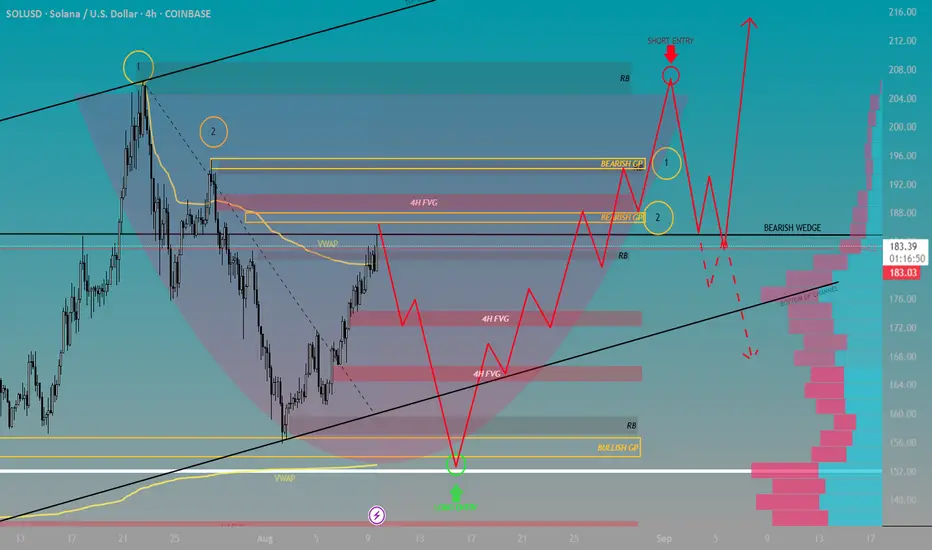
Solana Presents Multiple Opportunities on the HorizonContext 1:
Support: $125.50
Resistance: $185.00
Psychological Levels: $150.00 and $190.00
Context 2:
Technical Structure 1: We are in a bearish wedge that has formed the beginning of a bearish channel that has tested support 3 times and tested resistance 4 times.
FVG’s:
FVG Confluence 1: One bearish 4H FVG located bove price. 3 bullish 4H FVG located below price.
Golden Pocket: Sits right below 4H FVG and aligns with the $190.00 Psychological level. Strong confluence.
Context 3:
Volume Insight: Volume Indicator shows a spike in volume from psych level $150.00 and $155.00. Aligning with the POC and a Rejection Block located right above the 0.65 fibbonacci level.
Bullish Scenario: With multiple confluence at the $150.00 psych level, price sweeps the previous low as it bounces off the lower anchored VWAP. This will lead to a completion of a Cup and Handle formation producing enough momentum for a breakout of the Bearish Wedge.
Bearish Scenario: Above the $200.00 psych level remains a Rejection Block. Sweeping this area may lead to enough liquidation to push us back within the Bearish Wedge and allow for a breakout towards the POC.
Solana – Momentum Continues After \$155 LaunchpadTrend:
SOL rallied from \$155 support and is now trading well above both the 50 EMA and 200 EMA on 4H/Daily charts.
Strong uptrend with higher highs and higher lows in place.
Pattern:
Breakout from ascending channel retest at \$155 triggered fresh buying.
Price is currently approaching resistance near \$185–\$188, which, if broken, opens the path to \$200+.
Key Levels:
Support: \$172, \$165, \$155 (major swing low)
Resistance: \$185, \$200, \$215
Breakout Trigger: 4H close above \$185 on strong volume
Indicators:
RSI remains in bullish zone (65–70), showing strength without extreme overbought conditions.
MACD still in bullish crossover with widening histogram.
Volume increasing on upswings, confirming buyer dominance.
Trade Plan:
Entry: Buy pullbacks to \$172–\$175 OR breakout above \$185 with volume
Stop-loss: Below \$165 (swing low)
TP1: \$200
TP2: \$215
TP3: \$230 (if momentum accelerates)
Bias: Bullish while price holds above \$165.
📈 SOL’s rebound from \$155 has shifted market sentiment firmly bullish. A breakout above \$185 could be the ignition point for a run into the \$200–\$230 range.

Solana Long SetupHi everyone.
I think this areas has some potential to set orders.
If we stop at the first order then I'll update the second order TPs.
please consider the risk management and don't use more than 0.5% of your capital for each...
Dear traders, please support my ideas with your likes and comments to motivate me to publish more signals and analysis for you.
Best Regards
Navid Nazarian
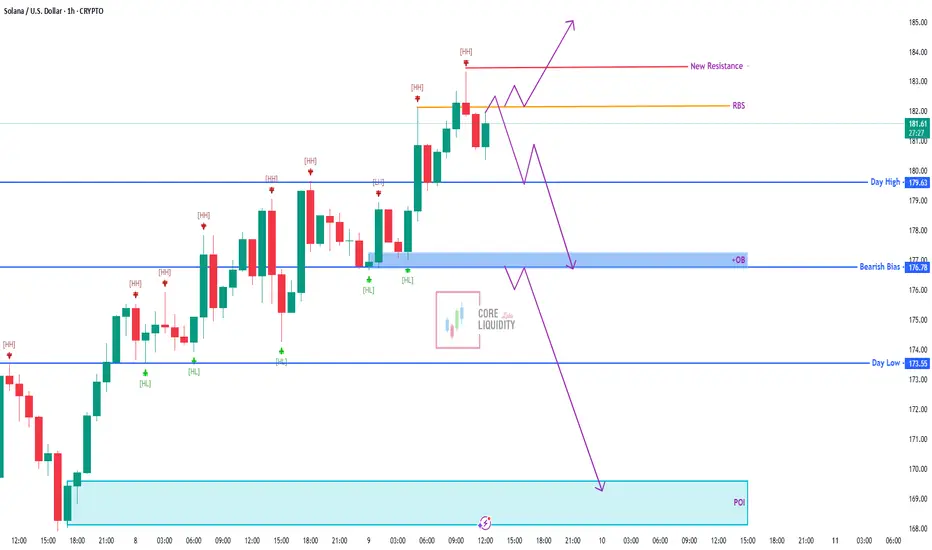
SOL/USD – Watching the RBS ZoneSOL is retesting the 182.00 RBS after a recent pullback. Price action here will decide the next big move:
1️⃣ Bullish Breakout – Push above New Resistance (183.00) could trigger a strong rally to fresh highs.
2️⃣ Bearish Reversal – Failure to hold RBS could send price down to 179.63 Day High, then deeper towards the 176.78 OB or even 173.55 POI.
Key Levels:
Resistance: 183.00 (New Resistance)
RBS: 182.00
Supports: 179.63 / 176.78 / 173.55
Bias: Neutral — breakout or rejection will set the trend.
📌 Keep a close eye on RBS — the next candle pattern here could be the trigger for a major move.

SOL/USD – Key Decision Point SOL is holding just below new resistance (183.00) after a strong push. Price action suggests two possible scenarios:
1️⃣ Bullish Breakout – Clear move above resistance could trigger a rally towards fresh highs.
2️⃣ Bearish Reversal – Rejection here could send price back to 179.63 (Day High), then deeper into the 176.78 OB and possibly towards the 173.55 Day Low / 169.00 POI.
Key Levels:
Resistance: 183.00
RBS: 182.00
Supports: 179.63 / 176.78 / 173.55 / 169.00
Bias: Neutral — breakout or rejection will decide the trend.
📌 Watch closely — the next move could be explosive in either direction.
Solana Long SetupHi everyone.
I think this areas has some potential to set orders.
If we stop at the first order then I'll update the second order TPs.
please consider the risk management and don't use more than 0.5% of your capital for each...
Dear traders, please support my ideas with your likes and comments to motivate me to publish more signals and analysis for you.
Best Regards
Navid Nazarian

Solana Bullish scenarioCurrent Price:181.37
Setup:
SOL has bounced strongly from the 155 to 160 support zone and is now reclaiming key Fibonacci retracement levels. The structure suggests a potential bullish continuation if momentum sustains.
Key Levels:
Support: 174.79 (23.6% Fib), $155.91 (major support)
Stop Loss: Below 150 to protect capital in case of breakdown
Targets:
Target Area 1: 235 (100% Fib Extension)
Target Area 2: 280 (141.4% 161.8% Fib Extension zone)
Bullish Case:
If price maintains above 174 and breaks the 195 205 zone, it could trigger a strong rally towards 235 and potentially 280. Structure resembles a continuation move following the July rally.
Bearish Risk:
Failure to hold above 174 could lead to retests of 160, and a break below 150 would invalidate the bullish outlook.
Outlook:
Bias remains bullish as long as the 174 180 range holds. A breakout above 205 would confirm the next impulsive leg toward 235+.
#SOL #Solana #AltSeason #Crypto #BTC #ETH #BullRun #Traderslounge

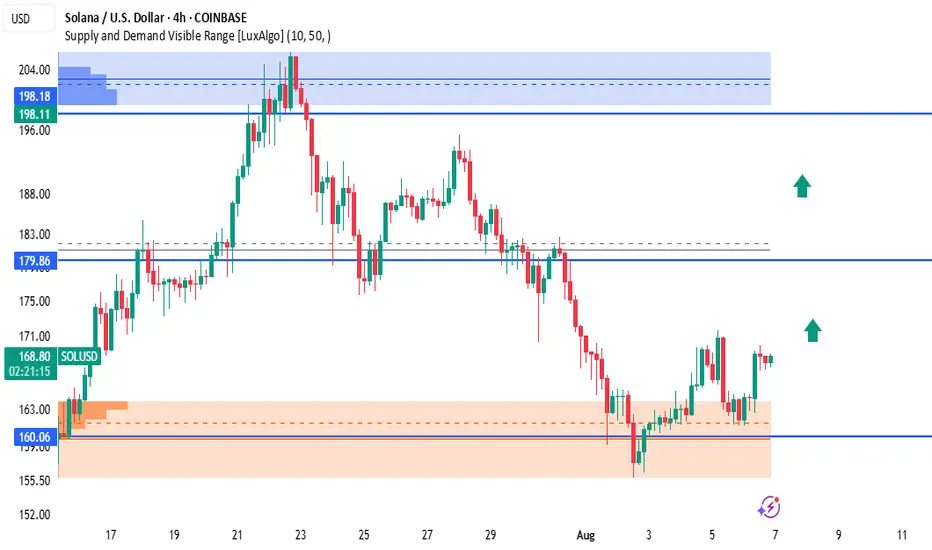
SOLUSD – Demand Zone Reversal in ProgressSolana is showing strong bullish signs after rejecting the demand zone around $160.06, forming a short-term higher low and beginning to climb. The current structure suggests momentum is shifting back to the upside, targeting key resistance levels.
🔹 Key Zones & Levels:
🟠 Demand Zone (Support): $157.00 – $160.06
🔵 Mid Resistance: $179.86 – Prior support turned resistance
🔵 Major Supply Zone: $198.11 – $198.18 (Previous peak area with strong sell pressure)
🟢 Bullish Outlook:
If SOLUSD maintains this upward momentum:
Target 1: $179.86
Target 2: $198.18
Green arrows on the chart highlight the expected bullish path as long as price holds above the demand zone.
📌 Trade Setup (Example):
Long Setup:
Entry: $165 – $169 (current zone)
SL: Below $159
TP1: $179.86
TP2: $198.18
⚠️ Risk Note:
A 4H close below $157 would invalidate this bullish bias.
Wait for strong bullish confirmation like a break and retest above $170 before going heavy.
💬 Follow for more Solana price action updates.
📊 #SOLUSD #Solana #CryptoAnalysis #DemandZone #PriceAction #SmartMoney #TradingView
Solana - The bullish background remains strongCurrent Technical Signals
SOL is trading around $180-$181, holding above the key 20-day EMA, which is around $178.25. A break below this level could open the way to support around $171.78, while holding above this level creates potential for a rise towards $186.40-$190.47.
A golden cross is forming between the 100- and 200-day EMAs on the daily chart - a classic bullish signal, strengthening the chances of a rise to $200.
Your network volume and balances on exchanges are showing a decline, which indicates a decrease in supply - easing pressure on the price and supporting bullish sentiment.
Support and Resistance
Support:
$178.25 (20‑EMA)
$171.78 — lower limit in weak market
The Currency analytics
Resistance:
$180–$190 zone — critical for further gains
Upper resistance at ~$200 — critical for rally continuation
Structural and Valuation Signals
A test of the daily bullish divergence on SOL indicates potential for further gains after correction.
SOL recently broke out of its ascending channel, indicating a possible reversal and the beginning of a new move higher.
Finance Feeds

SOLUSD📉 SOLUSD – Resistance Rejection (Sell Call)
🔄 LHs & LLs in formation
🔍Intant sell Book Partial profits
🎯 Entry: 🔽 Marked on chart
🛡 SL: ⛔ Marked on chart
💰 TP: 🎯 Marked on chart
