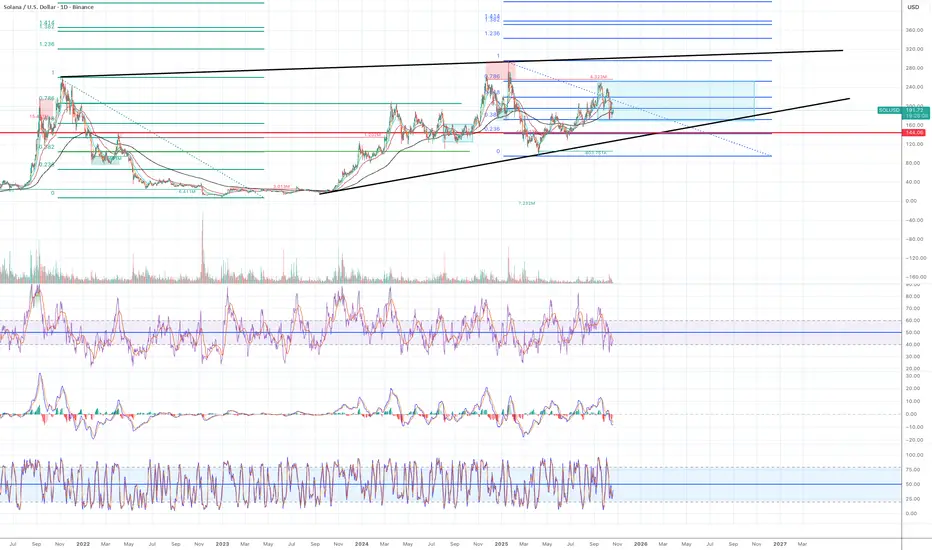
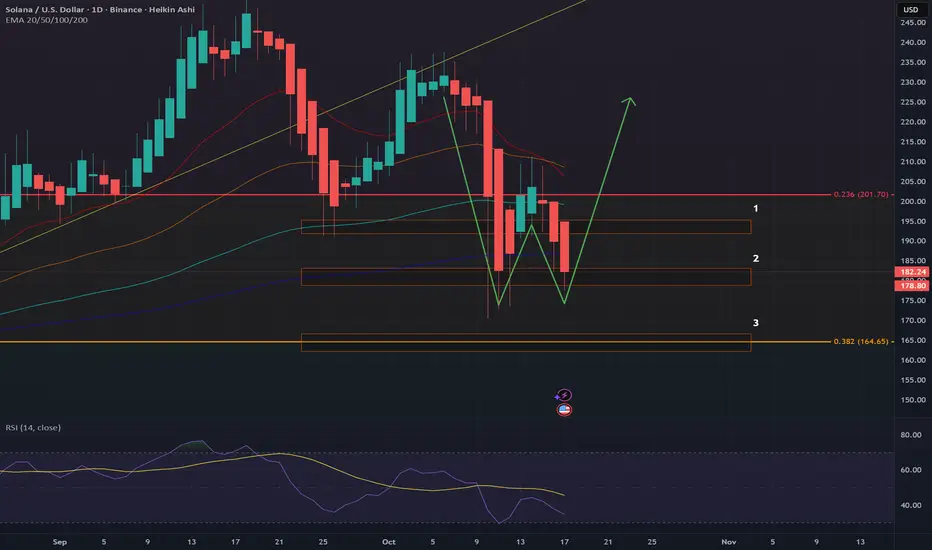
Getting bullishMy macro bias for Solana is bullish. I invest in Solana and I mainly hodle the asset. The price action of Solana in the last 18 months has been very difficult, therefore, I have been avoiding to trade it. However, I am becoming cautiously optimistic as a Solana bull and I can see some clear signs of price recovery.
Look at a green major Fib retracement from the previous cycle ATH at $262 to the bear bottom at $8.25.
1) the price moved rapidly to $208 at Fib 0.786 in March 24. It spent about a month consolidating around that level but it eventually failed to break above and spent 8 months consolidating between Fib 0.382 and 0.786 range.
2) The price eventually broke above 0.786 and 0.1 and reached historical ATH at $293 in Jan 2025 and started a sharp decline to $95, which is roughly Fib 0.382 area.
Look at blue major Fib retracement from historical ATH to the recent bottom ($293 to $95).
1). The price moved to $250 at Fib 0.786 in mid Sept 2025. It spent several days consolidating around that level but it eventually failed to break to the Fib 0.382 zone at $172.
Based on the two major Fib retracements, I am watching to see if the price will hold above Fib 0.382 level. It is normal for the price to consolidate between Fib 0.618 and 0.382 but I often see Fib 0.786 and 0.236 to work as the last line of defense. Once the price goes above or below Fib 0786 and 0.236, the trend can start to break down. So as long as the price stays above Fib 0.236, but ideally above 0.382, my bias is bullish.
$144 (red horizontal line in the chart) is the level Solana had the last bull trap and started the macro bear cycle. This level should work as a strong support level.
I keep adding more to my position when the price dips to Fib 0.382 area at the moment but it is for investment.
For swing trading, I am waiting for the following conditions:
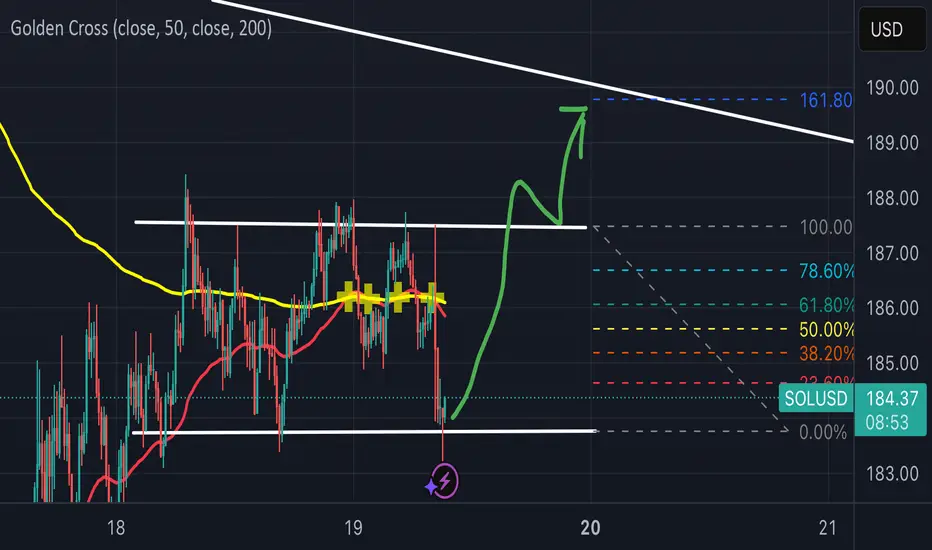
1) Daily candle closes above previous swing higher low at $191.80/
2) EMA 12 > EMA 21 > EMA 55
3) A daily candle is above EMA 200.
4) RSI lines cross to the upside and ideally enter the bull zone.
5) Stochastic are moving to the upside but not overbought.
6) MACD can stay in the bear zone but is starting to tilt to the upside.
Trade ideas
LONG SOLSOL chart looks explosive, could a big move be coming? The macro setup is really nice... ETF and DATS coming, more clarity on govt regulation, stable and RWA tokenization is all the rage. SOL have done a nice job testing the support levels it needed to, i'm long coins (no leverage), looking for a move to 250 and hopefully higher.

SOL (Long) 10-19-2025Just got in SOL around $190.00
Stop Losses at the support level around $172.50 around -10%
First Resistance level around $212.00
Target around $253.00 Next target around $285.00 Profits around +33%-+50% by 12-31-2025!

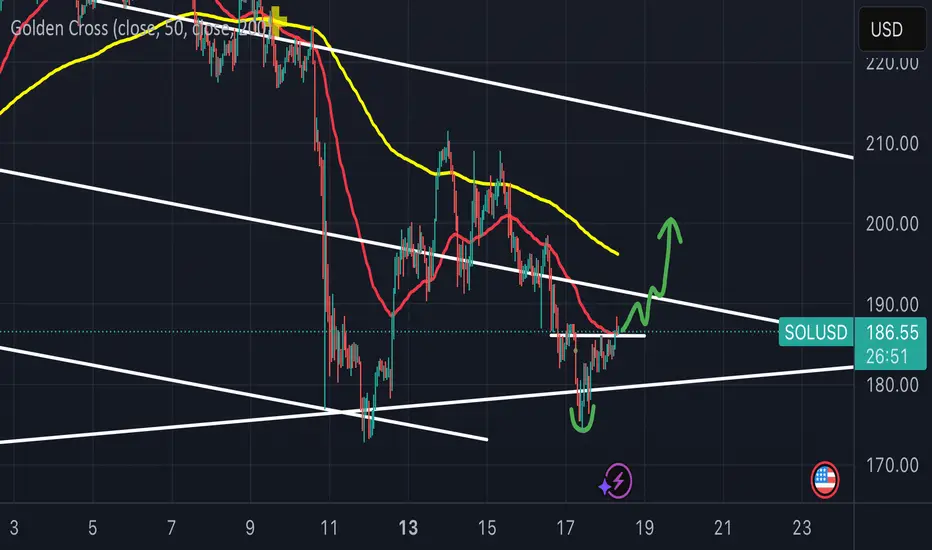
Solana: Key Levels to WatchSolana has been in a downward trend since October 6th, but we are seeing some hints at a reversal. This is not yet confirmed, and weekend price action tends to be a poor indicator of the week ahead. This chart tries to plot the key levels that SOL/USD needs to break through in order to show strong bullish momentum going into the end of October.
The levels to watch are $192, as the first resistance. And if Solana can break above that, it needs to smash through the $200 level. If that were to play out, keep in mind that $205 has frequently been a key support/resistance level as well. A break above $200 may stall at the $205 level for a while, and bulls will need to see it stay above $200.
The USDT.D chart is an important indicator of the allocation of capital into, or out of crypto. Traders should watch for a drop in USDT dominance to confirm that there is ample liquidity to maintain a Solana rally. The key levels to watch for is a USDT.D break below 4.88% (1), 4.72% (2), and 4.53% (3). With each break of these support levels, we should see bullish momentum in the broader crypto market, which could translate into a Solana rally.
Keep in mind that Solana, while hinting at a run for $192 this morning, could find strong resistance there. Whatever plays out today, its still a weekend, which means you should look for further confirmation into the trading week ahead. Aggressive traders may want to take positions here before SOL breaks these key levels, but this carries considerable risk that the downward trend line continues to be resistance. If that proves to be the case, watch for the next support to be around $175.
Monthly Crypto Analysis: Solana (SOLUSD) – Issue 100 The analyst expects Solana’s price to decline by the specified end time, based on quantitative analysis.
The take-profit level only indicates the potential price range during this period — it’s optional and not a prediction that price will reach it.
You don’t need to go all-in or use leverage to trade wisely.
Allocating just a portion of your funds keeps overall risk minimal.
Our approach follows institutional portfolio principles — not the all-in or blow-up trading style often seen on social media.
Results are measured over the full time window, regardless of whether the take-profit level is hit.

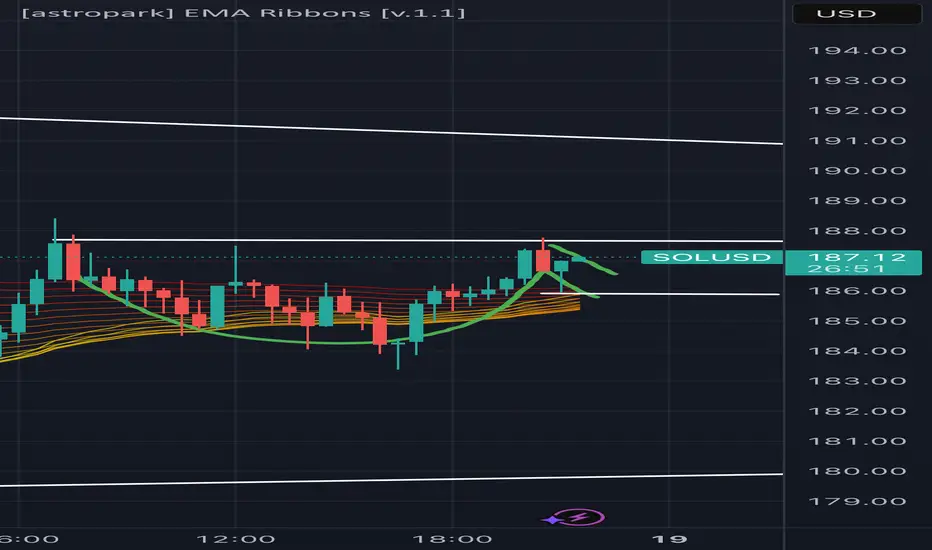
Dropped due to ascending wedge, but rectangle pattern ;)188$ seems to be hard to break, but if we hold at 184$ then I think we can expect an another attempt to go to 190$. Let me know your thoughts about it? Also support this idea if you want me to publish more ideas with patterns.
Big ShortTaking it down to 152. Let's see If what everyone is saying is true. Drop It to about 150 then where do we go from there?

Anything could happen. Maybe we see another bounce at the high with a poke out and a Turtle soup dumper.
We will have to watch when it gets to the top. As we move through the week this could play out or not maybe it does but faster or slower.

I'm thinking more downWhile everyone force feeds me bullish content on X I still see something different.
Might be selling the next run up. I'll post a lower time frame soon.

Solana outlook following recent market crash.Last week, an announcement by President Trump triggered a market crash, resulting in one of the worst trading days for crypto investors this year. Solana (SOL) was also affected, with its price plunging sharply to $172, erasing billions of dollars from the overall crypto market.
However, sentiment began to shift after Trump had a softer tone regarding U.S.–China relations last Friday. Also, the hints at improved economic ties have brought renewed optimism to the crypto and global markets. Historically, periods of fear and uncertainty are when institutional investors and whales tend to enter the market—taking advantage of lower prices while retail investors remain cautious.
On the daily chart, Solana is currently finding support in the $173–$174 range, with the most recent daily candle showing strong bullish momentum. This could be an early signal of a trend reversal. Given the technical setup and improved macro sentiment, initiating long positions around current levels could be a strategic move—with a medium- to long-term target of $300 in 2026.
This is a trade worth watching, and I'm optimistic about Solana's potential in the coming months. What do you think? Comments and suggestions?
Cup & handle pattern: let’s go!Solana is realing going strong under a bearish BTCUSD. I think this cup and handle pattern will play out well.
Solana Defends Triple VWAP Confluence — Structure Still IntactSOL/USD is testing a major confluence zone where three anchored VWAPs (from the April low, January 1st, and the all-time high) align with the ascending trendline that has guided price all year. The cluster between 174–182 has acted as strong dynamic support, reinforced by the 100- and 200-day SMAs. Holding this base could set the stage for a retest of 198–215, with a breakout above opening room toward 252. Breakdown below the trendline would shift momentum short-term bearish, but macro structure remains higher-low intact.

Inverse H&S pattern: we have seen that before !A possible scenario I have in mind. See for yourself on this chart: not that long ago we had seen similar behavior. We are building good support here and the majority wants to see another uptrend. Much love for Solana!
Bullish reversal pattern + bullish flag (is the bottom in now?)Observed a bullish reversal pattern, followed by a bullish flag pattern. We made a double bottom today. I think this might be the actual dip that can be bought. Wondering if we remain above 180$ for a longer time since there is quite some fear on the market..
SolanoThis Volume Profile is a problem for Solano. In my last related post, I mentioned that I'm not a fan of this chart setup, because there's low volume, and a huge gap to the VPVR shelf. I said I see trepidation on support, and nothing has changed my opinion since then.
This looks like trouble below for Sol. I would bail. I'm not in it, nor have I been, but I would bail.

SOL TAKE YOUR SELLToday i made around 8k profits from this trade and it's still running bearish ; btc also have some bearish movement stick to the plan and be patiente

BUY ORDER SOL-Trendline retest red
-Support
-Trendline retest green
-Fib compleet
I THINK WE ARE STILL GOING TO HAVE A PUSH

SOL potential double bottom setupI am seeing a potential double bottom setup for SOL. We would have to close at around 180USD, beyond which an upside turn is possible. DYOR and let me know your thoughts
Friday Massacre - cash ready! Another Friday massacre
The chart is looking extremely bearish.
I think the price is going to move to the $95-107 zone where the V-shape recovery happened after April liberation day.
Many people stayed on the sideline without getting into the market. I think the price wants to come back to that level for reset before the next big move up.
It structurally makes sense as well. You can see the fib retracement level in the chart from the previous cycle's ATH to the bear market bottom.
I often (not always) see Fib 0.786 and Fib 0.236 work as the last line of defence. So when the price breaks and closes above Fib 0.786, it eventually moves to the upside even if it temporarily pulls back.
In case of the down trend, if the price breaks and closes below Fib 0.236, the price will eventually move to the downside.
When you look at the Solana weekly chart, the price broke above 0.786 in Nov 24. It failed to continue to move up and spent months consolidating in the tight range. So I think it will eventually go up, but the chart is not telling me no so fast.
All weekly momentums indicate bearish momentum is building up.
I think the price might go to the following areas:
1) $135 - Fib 05, previous lower high, ascending support line, the level the final bull trap happened in 2022
2) $106.5 - Fib 0.382, liquidity pool, April liberation day bottom
3) $100 - psychological level
4) $ 68 - 100 - Fib 0.236-0.382 - absolute capitulation zone.

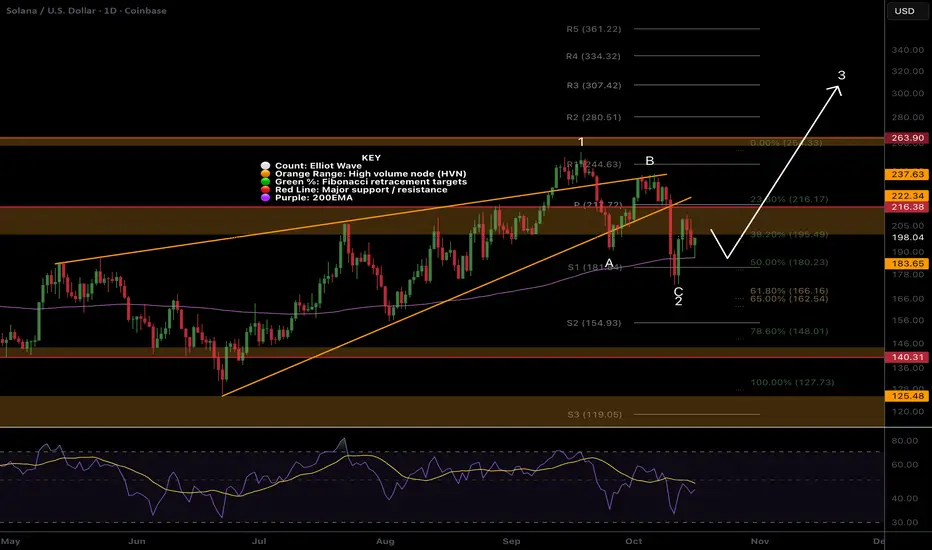
$SOL at major resistance, bottom is in?CRYPTOCAP:SOL bottom appears to have printed a text book ABC correction for wave 2 ending with a swing below the daily 200EMA and S1 pivot, front running the Fibonacci golden pocket.
However, Solana is at major resistance now and being rejected. RSI did not have bullish divergence or reach oversold so traders should be cautious.
Its holding up much better than most alt coins after Friday...
A bottom may be found at daily 200EMA and wave 3 may begin...
Safe trading
Where does the price find a bottom? I can see a few patterns in a weekly chart.
1) The price is moving inside the blue descending wedge pattern.
2) The price is moving inside the orange ascending wedge pattern.
3) Green descending support/resistance line is the line that completes a huge cup and handle pattern.
What do you think? I would like to know what others see.
Have a nice weekend.
Another Friday crush?? Price action is extremely bearish. I can see the same price action of the last Friday is unfolding in 1H chart.
When I analyse a chart, I use trendl ines, Fib retracement, EMAs, and momentum indicators. But when the action is so volatile and I feel like I no longer know what the hell is going on, I remove all the indicators and look for clear liquidity zone in higher time frames: Where did the price move up too quickly and left unfilled buy orders, and when did the price drop too quickly and left unfilled well orders?
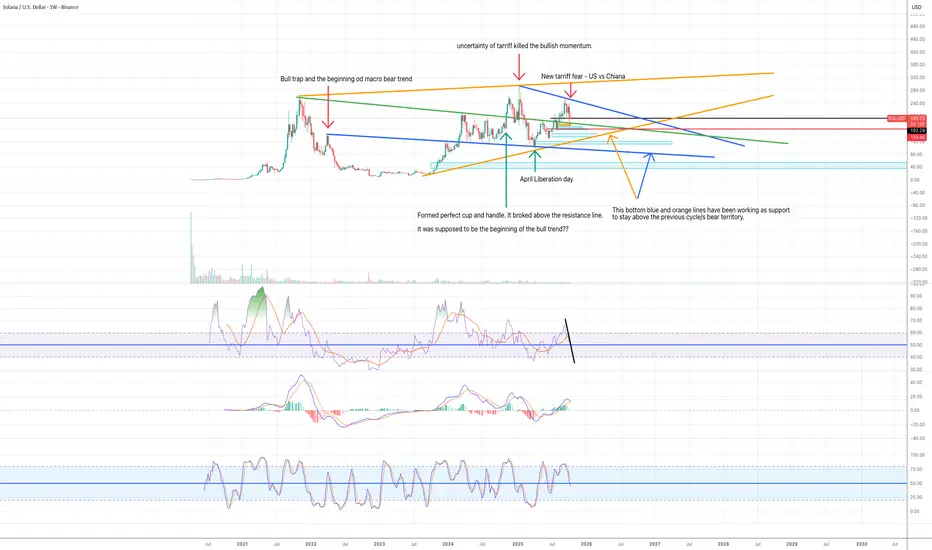
The problem of Solana is the price has moved down and moved up way to fast at the end of last bull cycle and in the beginning of this bull cycle.
Solana price fell from $250 to $82 in two months at the end of 2021. And after the bull trap in March 2023, the price again fell rapidly from $140 to $36 in two months. After the spectacular fall, Solana spent 16 months basing between 8 and 46 for 16 months. However, when it started to move up in October, it went up too quickly again. It moved from $22 to $200 in 6 months.
The past 18months, Solana spent most of the time in the range bound between $126 and $260, satisfying both buying and selling demands. The price can eventually go up, but I see lots of downwards pressures in every time frame:
Monthly:
Large unmitigated fair value gap between $45 and $80.
Price is trapped inside the descending wedge pattern. It is a bullish pattern. However, if the price does not break and close above the descending resistance line, the price is likely to move to the downside.
Momentum indicators are also in the bull zone. However, RSI and MACD are starting to move to the downside. It makes me think the price correction is happening. It is a monthly chart, so it won't resolve quickly.
Weekly:
I can see a diamond pattern. The price is trapped in the shape of the diamond. It is usually a bearish pattern.
The price was moving up strongly along the ascending support line (purple line). However, the last Friday's crush went down to sweep the liquidity (orange rectangular box) and I can see two more fair value gaps sitting below it.
All weekly momentum indicators are still in the bull zone, however, RSI lines and Stochastic lines are now crossed to the downside. MACD lines are very close to cross as well.
Daily:
The price is still above EMA 200 and also above the support line, however, EMA 55 is about to cross over EMA 12 and 21. Yesterday's candle retested EMA 12/21/55 and closed below it.
MACD are deeply in the bear zone and has no sign of recovery.
RSI and Stochastics are reset to move to the downside.
1H:
EMA12/21/55/200 are perfectly lined up for the bear move.
Before last Friday's crush, the price held above $217 for a few days, but it eventually capitulated. I can see the same set up unfolding. And it is Friday again.
There is an unmitigated fair value gap in the $212-218 zone (immediate one) , so the price can move up there to fake out and move down. I have no idea what the market will do. I can see in a daily chart the price is moving inside the descending parallel channel. So if the price can hold above the purple ascending trend line, it might recover from there.
It is a very difficult market. When you have a strong bias, you will always find what you want to see. I have to pay attention to what the price is doing and hopefully react to it correctly.
Good luck.

SOL Ascending Triangle Solana is in an ascending triangle with resistance at $260 and support at $125. Look for $260 resistance to turn to support.
