SOL/USDT (Solana vs Tether) Timeframe: 4-hour chart Pattern....SOL/USDT (Solana vs Tether)
Timeframe: 4-hour chart
Exchange: Binance
Analysis tool: Ichimoku Cloud + trendlines
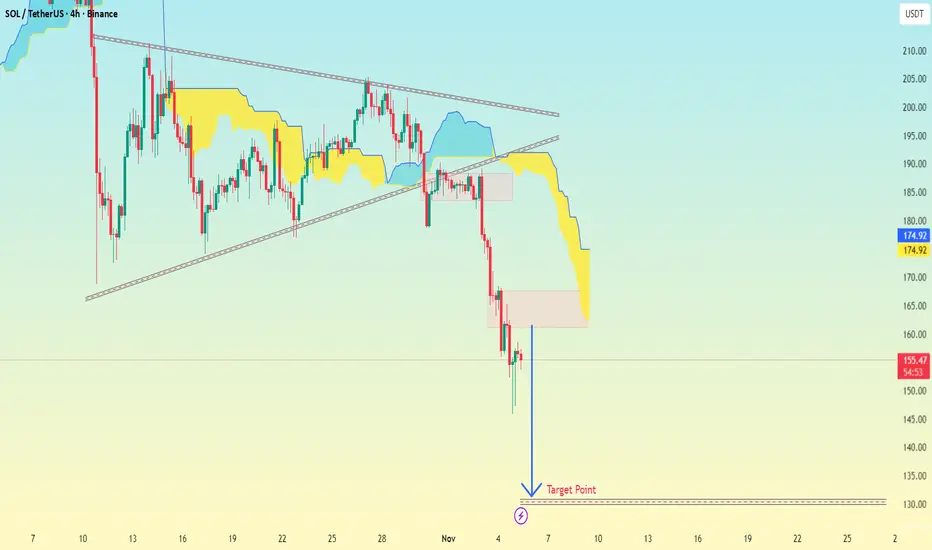
Pattern: my drawn a descending triangle or bearish pennant that recently broke downwards.
Current Price: Around $153.67
Target Point (marked): Around $135 – $137 zone
🎯 Target Zone
From my chart, the “Target Point” label is placed approximately at:
> $135 USDT
This aligns with a measured move projection from the height of the triangle (around $200 down to ~$160), giving a target near $135 — a typical price objective for a bearish breakout.
🧠 Quick Breakdown:
Price broke below support near $160.
The Ichimoku Cloud turned bearish (price below cloud, red span ahead).
Momentum and volume confirm downside continuation.
Target completion likely around $135 – $137, unless support appears earlier.
Trade ideas
SOL/USDT – Holding Steady Near the $160 ThresholdHello everyone, Solana (SOL/USDT) is currently stabilising around $156 after a strong correction earlier this week. This area serves as a key support level, as buying pressure has become more visible over recent sessions.
On the 4-hour chart, the main trend still leans slightly bearish, but the repeated rebounds from $155–156 suggest that buyers are trying to defend the base.
From a news perspective, the broader crypto market remains influenced by U.S. monetary policy. A stronger dollar and 10-year Treasury yields hovering around 4.2% have made investors more cautious toward risk assets like crypto. However, Solana stands out thanks to steady capital inflows into its DeFi and NFT ecosystems, along with ongoing institutional interest — factors that have helped prevent heavy sell-offs.
Overall, liquidity within the Solana ecosystem remains stable despite macro headwinds. Therefore, SOL is likely to continue moving within the $155–160 range before deciding on its next direction.
What do you think — can Solana hold this base and bounce back soon?

Solana going to rise very fast over the next few days, 235-245Divergences and strength of the come back in now in the 6hr charts are going to lead to a surge in prices again as we possibly even go to a new high from here with Solana and BTC possibly

SOL will hit 100 soonAccording to the high timeframe analysis, CHOCH happened at 169 and tapped to the zone below 110 weekly liquidity, followed by a Rally to 240 which was a strong selling zone now it is on the way to hit 100$ or below. We can expect a strong bullish rejection from 80$

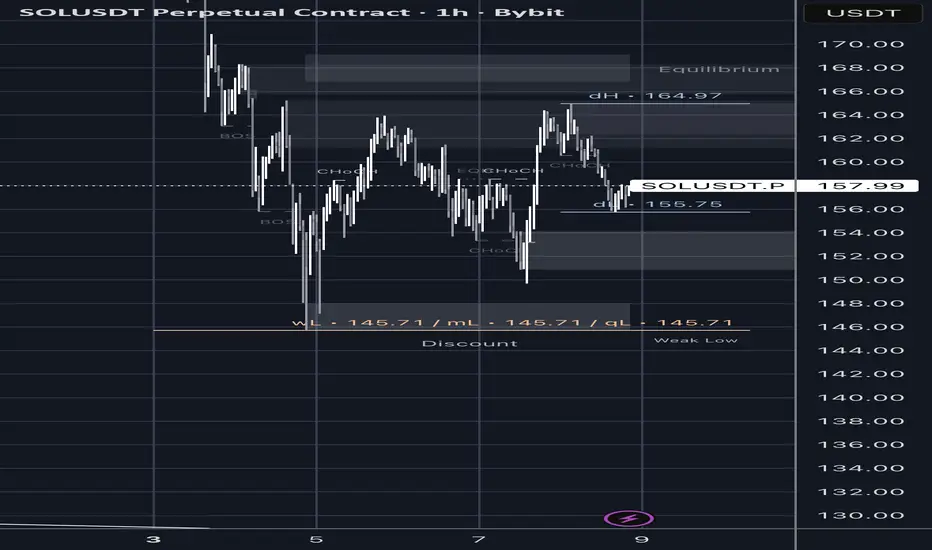
SOLANA: $157 | Key Levels September is usually the Month of Solana
and its Gang of VCs woodstock moment
instead it took a backseat to iron out deals
from tech to fresh capital and TRUMP camp
for nnow it's just allocating tokens for December Big Bad ShowTIME
size em well
as Anatoly is on a series of roadshow PREACHING the new world order of SOLANA

SOL/USDT: Bearish Channel Holds as Price Faces Mid-Range ResistSOL/USDT is consolidating inside a downward channel, with a clear sequence of lower highs and impulse legs defining the structure. Price is currently hovering near mid-range resistance, showing hesitation below the descending trendline.
A rejection at this level could lead to a move back toward the $169 support, completing the projected downside leg. The broader tone remains bearish while channel boundaries continue to guide and limit momentum.

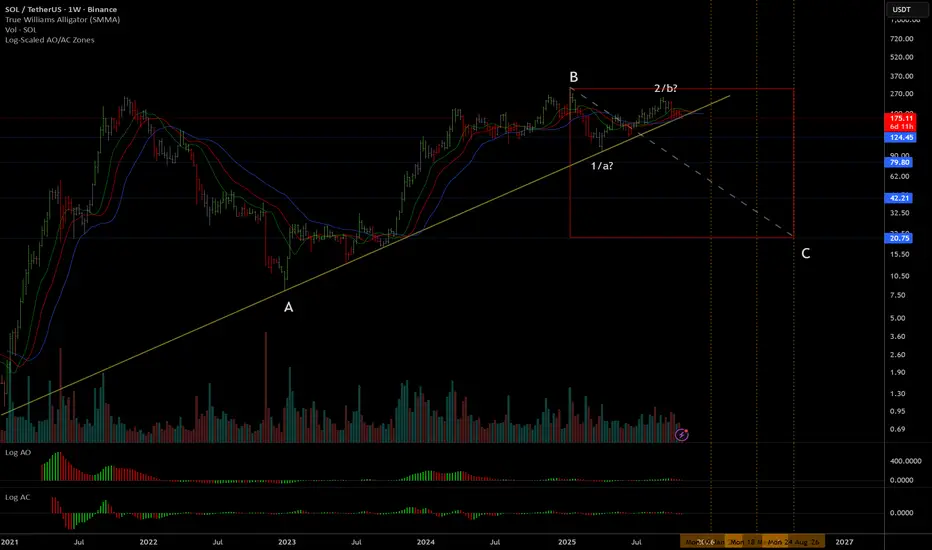
Solana Multi-Year BreakdownSOL is breaking down from this multi-year trendline which has 4 solid touch points. It's difficult to say how low it will go, worst case is probably around $20, but there are definitely other paths it could take as well.
Without forecasting the exact future price, I will say that probabilities are favoring a continuation of the downtrend which began in January after Trump launched his memecoin on Solana.
After we see how fast and far this drops, we can probably get a better idea of what is developing here. Right now, it looks like wave-B ended in January, and we are in a very large wave-C now, but there are some other possibilities as well. The wave-B possibility is closest to the middle so that's the one I am favoring now.
Solana Price Action Turns BearishSolana’s market structure shows a gradual weakening of bullish momentum after an extended upward phase earlier in the month. The asset experienced a breakout that temporarily fueled optimism among traders, but recent sessions indicate a loss of strength as sellers began to dominate. The volume profile suggests that market participants are shifting focus from accumulation to potential distribution, reflecting caution ahead of broader market developments.
Price movements over the past few weeks show that Solana has transitioned from impulsive bullish waves into a corrective environment. This phase reflects uncertainty and potential repositioning by large holders. The consolidation seen mid-cycle indicates a period of balance before a directional move resumes. Current activity implies that short-term liquidity adjustments are occurring, and volatility may expand in the coming sessions.
Market sentiment remains sensitive, with investor confidence depending largely on macroeconomic flows and digital asset liquidity trends. Solana’s performance continues to mirror broader crypto risk appetite, where speculative behavior is being tempered by cautious profit-taking. If momentum continues to decline, extended corrective movement could unfold as participants await new catalysts.
Overall, the report indicates that Solana is entering a controlled phase of distribution where institutional participants may be preparing for another medium-term adjustment in valuation.

Solana — Triangle Tale Before the Pale As you might remember from my previous publications, I’m expecting Solana to decline toward 164 and possibly even lower.
At the moment, I’d like to see it around 178, and depending on how the move toward this level develops, I’ll decide on my next steps — which you’ll see in my upcoming updates.
I have a thought that after reaching 178, Solana might move upward first, forming a corrective triangle, and only later drop to 164 or even below.
The invalidation zone for the current plan is marked in red on the chart.
📉 Follow me so you don’t miss my next analyses and scenario updates

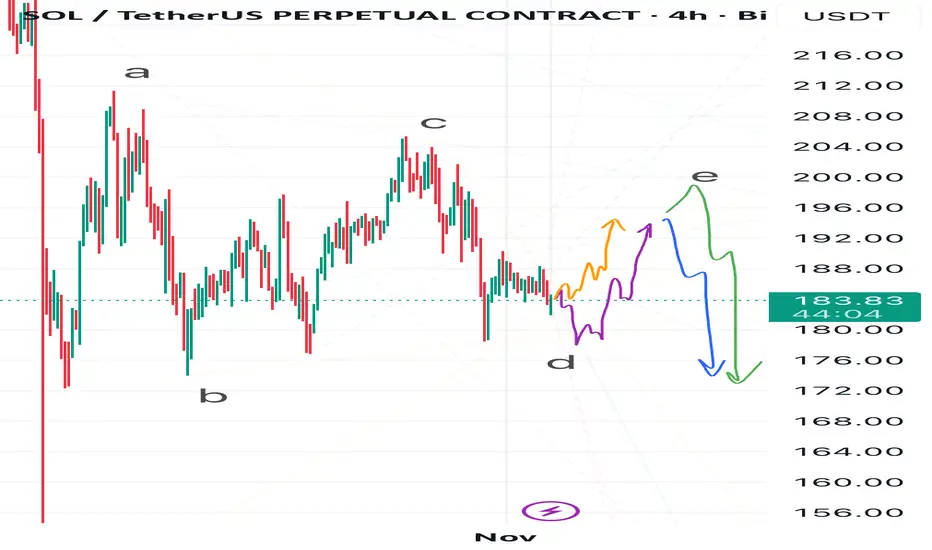
Solana Swing — D or E in the Ring?I see several possible scenarios for Solana at the moment.
In my view, either wave D of the corrective ABCDE triangle has already formed, and the price will follow the orange path, starting to build wave E —
or wave D isn’t complete yet, and Solana might still drop toward 178 or even lower, following the purple path, before beginning wave E.
As for wave E, I also see two possible outcomes:
• The green path, where wave E extends up to around 200,
• Or the blue path, where wave E ends near 194–196, followed by a downside breakout from the triangle, sending Solana toward ~170 or even lower.
💬 Which scenario do you find more likely? Share your thoughts in the comments!
SOL USDT LONG SIGNAL---
📢 Signal Alert
🔹 Pair: SOL / USDT
📈 Trade Type: Long
💰 Entry Zone: 175.75
🎯 Take-Profit Targets:
TP1 = 178.53
TP2 = 182.14
TP3 = 187.54
🛑 Stop-Loss: 171.69
📊 Timeframe: 1H
⚖️ Risk/Reward Ratio: ≈ 3.0
📌 Suggested Leverage: 5x–10x
🔄 After TP1 is reached, move Stop-Loss to Entry to secure profits.
---
🧠 Technical Analysis Explanation
SOL is showing strong bullish continuation momentum after bouncing from the 171.50 demand zone, where buyers stepped in aggressively.
The market has broken above the short-term descending channel, confirming a trend reversal on lower timeframes.
The entry level at 175.75 aligns with the retest of the breakout zone and the EMA 50, which acts as dynamic support.
RSI has crossed above 50, indicating renewed bullish momentum, while volume shows increasing buyer participation.
Take-profit levels are based on major resistance zones and Fibonacci extension projections from the last impulse move.
The stop-loss at 171.69 is set just below the key support area to prevent losses in case of a false breakout.
---
⚙️ Trade Management Tip:
Always confirm entry with a bullish candle pattern (e.g., engulfing or hammer) before executing.
Use partial take-profits and adjust your stop-loss progressively as price advances toward higher targets.

SOLANA/USDT 1W CHARTSometimes, charts of major altcoins like Solana can offer clearer signals when Bitcoin and Ethereum charts look indecisive.
In this case, Solana’s price has been supported by a long-term trendline dating back to 2021. The price is now testing that same trendline, making it an important level to watch, its reaction here could provide early insight into the market’s next move.

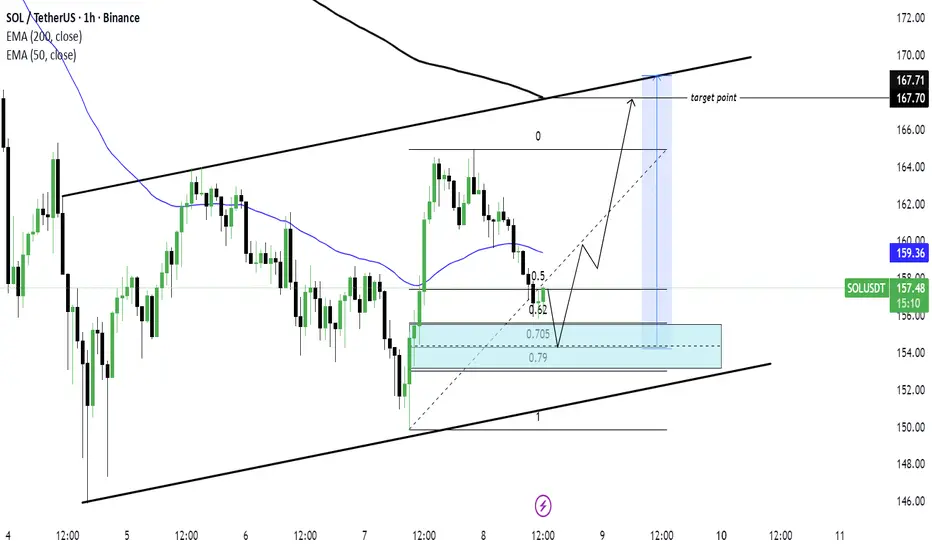
SOL/USDT) Bullish trend analysis Read The captionSMC Trading point update
Technical analysis of SOL/USDT (1-hour timeframe) — a potential continuation move within an ascending channel.
Here’s the complete breakdown
---
1. Market Structure
Price is moving inside a rising channel, confirming a bullish structure with higher highs and higher lows.
The two black trendlines outline this ascending pattern, indicating overall upward momentum.
---
2. Key Zone (Demand Area)
The blue box marks a demand or buy zone around $154–$155.5, aligned with the Fibonacci retracement levels (0.62–0.79).
This zone represents a potential retracement area where buyers may step in to continue the uptrend.
---
3. EMAs as Dynamic Support/Resistance
50 EMA (blue line) = $159.36
200 EMA (black line) = $167.71
Price is currently below the 50 EMA but still above the mid-channel trendline, suggesting temporary correction before continuation.
Once SOL bounces from the demand zone, reclaiming the 50 EMA would confirm momentum shift back to bullish.
---
4. Expected Move
The chart projects a short-term pullback into the demand zone (0.705–0.79 retracement).
From there, a bullish reversal is expected, leading to a continuation toward the upper boundary of the channel.
Target point: Around $167.7, matching the 200 EMA and channel resistance.
---
5. Summary
Trend: Bullish (ascending channel)
Bias: Buy the dip / Continuation upward
Entry Zone: $154 – $155.5 (blue demand zone)
Target: $167 – $168
Invalidation: Break below channel support (~$150)
---
Trading Idea Summary:
“SOL remains in a bullish channel. Price is retracing toward the 0.705–0.79 Fibonacci demand zone, where buyers are likely to re-enter. A bounce from this area could trigger a continuation move toward the $167 resistance zone.”
---
please support boost 🚀 this analysis
SOL to 145 next week.SOL has been having meaningful support from 150 to 160, but when BTC breaches 100k next week we’ll wick to 145 to resume up and this will happen rather quickly. Be quick to catch it.
SOL: One More High… or Goodbye?The Solana bull run that started in December 2022 most likely finished in January 2025. It was a textbook five-wave impulse (extended iii, with i ≈ v). From Jan → Apr 2025 we saw the first leg down (A), and the rally Apr → Sep was merely a corrective (B) move; base case is C down toward $80–50. An alternative allows for one more pop within B (even a small over-throw), but downside resumes after.
Full cycle & proportions
Dec ’22 → Jan ’25: clean 1–2–3–4–5.
Wave 3 shows a classic extension.
Waves 1 and 5 are nearly equal in length.
The run from the bottom is roughly 30–35× (about +3,000%), which statistically argues for a meaningful mid-term correction.
Base correction targets from the whole impulse: 0.382–0.5 Fib → $80–50, aligning with monthly/quarterly imbalances (FVG).
What 2025 looked like
Jan → Apr: first downward leg — wave A.
Apr → Sep 18 (high ~$253): a double zigzag W–X–Y — typical wave B, not a new trend.
Alternative (expanded flat, EFL)
A: Jan → Apr 7 down.
B: Apr → Sep as (A); now forming (B); then (C) up (a minor higher high is possible).
After that, a larger C down into $80–50.
Why I think the rally is done (market context)
TOTAL and BTC likely trace end-phase bull structures (distribution/terminal patterns).
Volume profile on COINBASE:SOLUSD : the heaviest trading sits around $120–200 (HVN/POC) — classic distribution; price often moves below POC afterwards.
Price Action (weekly/monthly): $216–260 is a major resistance that launched the bear market back in Nov 2021. Repeated tests without a weekly/monthly hold above it argue against an immediate breakout.
Fundamentals in two lines
Why a correction now: cycle overextension, liquidity saturation near the top, sensitivity to DXY/real yields and risk-off in US indices.
Why the long-term case survives: high throughput, latency improvements (e.g., Firedancer), growing DeFi/stablecoin/consumer activity. After leverage clears, BINANCE:SOLUSDT historically recovers with high beta.
Levels & invalidation
Base (correction) holds until we get a weekly close > $260–270.
Downside waypoints: $150 → $120 → $95 → $80–50.
Invalidation: sustained hold above $270 with expanding volume — I’d concede an early start of (3) without a deep (2).
Bottom line. With high probability, SOL’s medium-term rally is over; we are in a corrective phase targeting $80–50. The long-term bullish story can resume later — but first the market likely needs to deflate.


Solana’s 63-Day Cycle: Bullish & Bearish Path ProjectionThis chart examines Solana’s recurring 63-day market rhythm, revealing a consistent pattern of “M-top” formations approximately every nine weeks. Each cycle has historically produced a local high followed by a corrective phase, suggesting that SOL trades within a repeatable momentum structure that alternates between accumulation and exhaustion.
Using Heikin-Ashi candles on the weekly timeframe, the pattern highlights clear bullish and bearish rotations — each forming higher lows within a rising macro trendline (the “possible correction line”). The green projection path represents a potential continuation of this macro uptrend, targeting the $275–$325 range for the next cycle top, and possibly $375–$400 if momentum sustains into early 2026.
Conversely, the red path marks the bearish continuation scenario. A breakdown below the $150–$160 trendline support could trigger a deeper retracement toward $120 or even $100, retesting previous accumulation zones before the next cycle emerges.
External factors (e.g., network congestion, exploit events, liquidity shocks) have previously caused deviations from the rhythm, as noted on the chart. Despite these outliers, the broader 63-day pattern has remained structurally intact since early 2024, suggesting a cyclical behavioral consistency among traders and algorithmic participants.

Lingrid | SOLUSDT Continuation Short Pattern BuildingBINANCE:SOLUSDT is consolidating within a defined downward channel after a sequence of lower highs and extended impulse legs. Price action is currently hovering near mid-range resistance, showing hesitation below the descending trendline. A rejection from this level may drive the pair back toward the $169 support, completing the projected move. The overall market tone remains bearish while the channel boundaries continue to confine momentum.
⚠️ Risks:
Sudden short squeezes could trigger a false breakout above $193.
Fed policy commentary this week may increase volatility across risk assets.
Strong crypto inflows could weaken bearish continuation signals.
If this idea resonates with you or you have your own opinion, traders, hit the comments. I’m excited to read your thoughts!

SOLANA Sell/Short Setup (2H)A bearish pattern has formed on the chart, and it appears that the first wave of wave E has been completed, which was symmetrical. In the second wave of E, we are looking to enter a Sell/Short position to capture the third bearish wave of wave E.
The stop loss, targets, and entry point have been marked on the chart.
Please note that this is a swing setup and will take some time to reach the target.
Add this setup to your watchlist | we’ll enter if it reaches the entry zone.
For risk management, please don't forget stop loss and capital management
When we reach the first target, save some profit and then change the stop to entry
Comment if you have any questions
Thank You

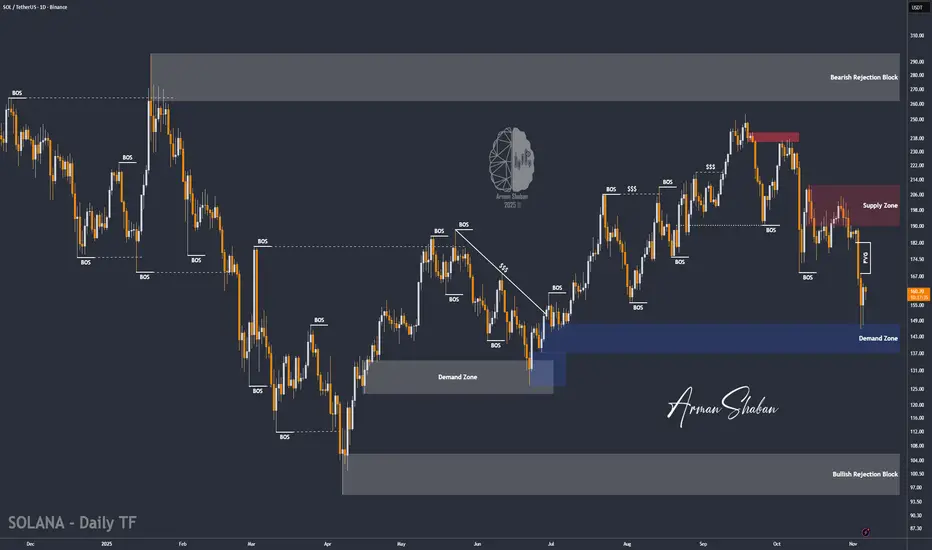
SOL/USDT | Solana Rebounds From $146 – Bulls Back in Control!By analyzing the #Solana chart on the daily timeframe, we can see that after correcting to $146, the price found strong demand and is now trading around $160.
If Solana manages to hold above the key demand zone of $137–$147, we can expect further upside movement. The medium-term targets are $168, $182, and $196. This analysis will be updated soon.
Please support me with your likes and comments to motivate me to share more analysis with you and share your opinion about the possible trend of this chart with me !
Best Regards , Arman Shaban
sol usdt pattern identified inverse head and shoulders with chan🧠 Technical Analysis (SOL/USDT – 4H Timeframe)
🔍 Pattern Identified: Inverse Head & Shoulders
Left Shoulder: Around $137
Head: Dipped to ~$126
Right Shoulder: Formed around $135
Neckline Breakout: Successfully broken near $148–$150 zone
This classic bullish reversal pattern indicates a potential trend shift from bearish to bullish.
📈 Trend & Channel
The price was previously trading inside a descending parallel channel (marked in yellow).
The breakout from the upper channel boundary confirms strength and momentum shift.
🚀 Price Targets (Resistance Levels Ahead):
$158.36 – First resistance level (short-term target)
$168.52 – Mid-level resistance (medium-term)
$187.56 – Key resistance (long-term target area)
✅ Bullish Confirmation:
Breakout with volume from both descending channel and head & shoulders neckline
Price holding above neckline now acting as support
⚠️ Risk Note:
A retest of the breakout zone ($148–$150) can occur before moving higher
Invalid if SOL drops back below neckline and fails to hold above $145 support zone


Solana, more down side to see? SOLUSDT / 1D
Hello Traders, welcome back to another market breakdown.
SOLANA is currently trading within a down trend, maintaining a bearish structure. I'll be looking for a short pull-back higher to get a position.
If the pullback holds and sell mode confirms, the next leg higher could target new lows.
Stay disciplined, wait for the market to come to you, and trade with confidence!
Trade safely,
Trader Leo.
