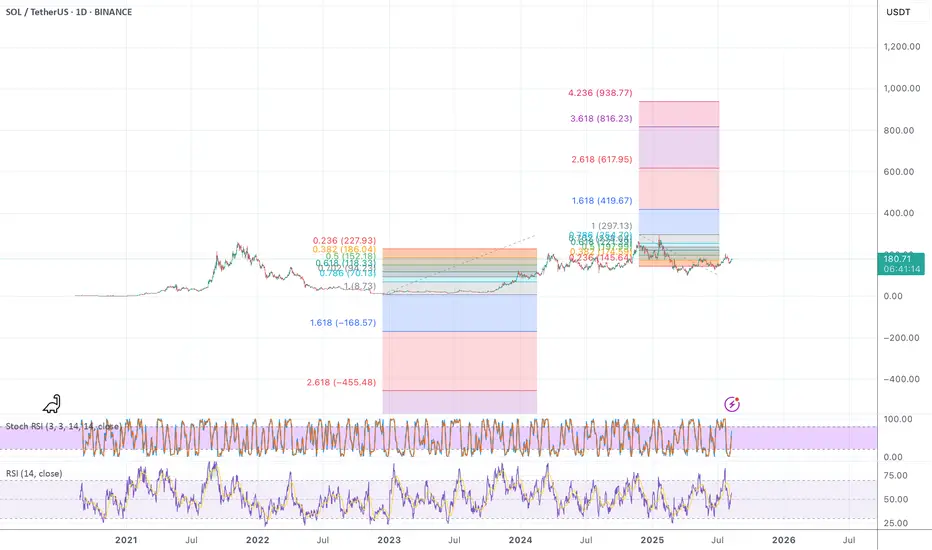
Solana · $420, $620 or $1,000? · 2025 or 2026 New All-Time High?Based on what is happening now we know September 2025 to be the month of Crypto. A local top. Next month is going to be something for the record books. The altcoins market will be wild and there will be millions and millions of people buying and selling cryptocurrencies. It will not be the end of the bull market, this is only a part.
Solana has been doing great. The chart looks good and we have five days green.
The last retrace lasted only 11 days. Compare this to the previous retrace that lasted 30 days. One long, one short. One flat, one rounded. One big, one small. Etc. The law of alternation.
What more can we extract from this law of alternation? A blow off top in 2025.
A blow off top not only means little time to sell, but it also means a crazy wick on wave 5. The next all-time high can go beyond $420 and hit $620 or even $1,000 or more. That is because once the top is in it will not be visited again for 2-3 years, and so the market will give it its all.
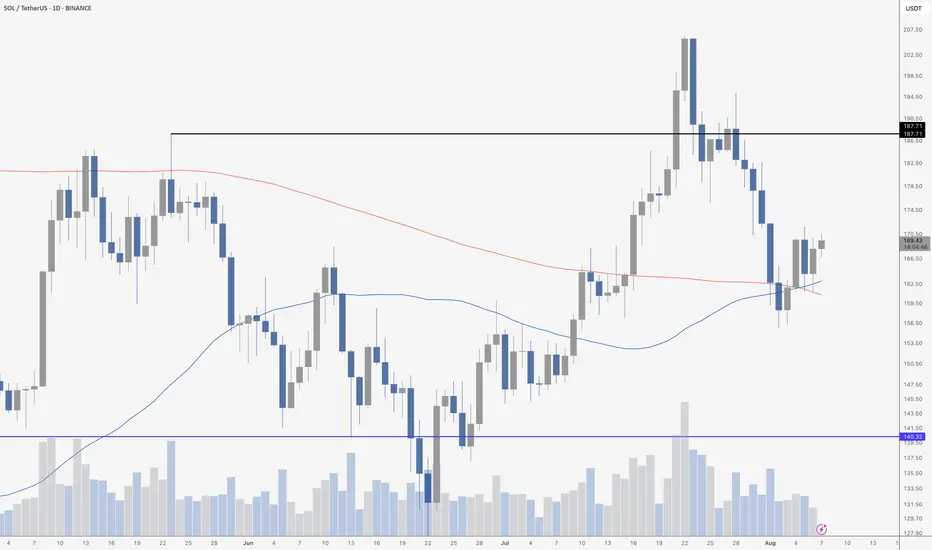
Solana is looking good, the chart has more to say. The action is happening above all moving averages—MA200, EMA277, EMA144, etc.—and since April we have a rising trend.
What you are seeing is a sort of bullish consolidation. Like sideways but with an upward bent.
The best is yet to come. Once the consolidation period is over, Solana will shoot straight up. $420 will be the main target for this move but is likely that the bull market will give us more. $620 or $1,000. Soon we will know.
Namaste.
Market insights

SOL - How high can this thing fly? 1000USD?? Checking the fibbs here I see what is possible.. is it really?
It looks to me like this thing hasn't even started yet.
Can it go to 1000USD? Tell me your thoughts
Solana bulish Have you ever stayed in a winning trade just to get more?
That voice whispering “keep it longer, this might be the big one”?
It’s the same voice that’s emptied thousands of portfolios...
Hello✌️
Spend 2 minutes ⏰ reading this educational material.
🎯 Analytical Insight on Solana:
SOLUSDT
has seen healthy volume recently and is testing key daily support along with an important trendline. Holding these zones could fuel a 15%+ rally toward the $199 mark 📊🚀
Now, let's dive into the educational section,
🧠 The Psychology of Greed: Profit’s Evil Twin 😈
When you enter a trade and it starts moving in your favor, your subconscious kicks in. Suddenly, your brain whispers: “Just a little more... hold it!”
That’s when the greed game begins.
No matter how well you planned before the trade, once you're in profit, your brain creates a fantasy. A future where profits double, triple... a dream world. And this dream is exactly what makes traders give back everything including their original capital.
Our minds are wired to crave the rush of winning again. It’s like a hit of dopamine. So you hold the position even when the chart is flashing reversal signs. That’s the setup for disaster...
📉 Take-Profit Levels: Why Getting Out Is the Real Win 📌
Here’s the cold truth
If you don’t exit when you planned to, that profit was never really yours
A take-profit isn’t just a number. It’s a psychological boundary that separates a disciplined trader from an emotional one. Many beginners think setting a TP means giving up potential gains but in reality, it means respecting your plan and your capital.
You’ll always have another chance to trade. Always
But if greed wipes out your funds, there’s nothing left for the next opportunity
Each trade is just a chapter, not your whole story.
🧪 The Social Media Trap: When Your Brain Stops Thinking 📱
Online hype is poison. From “X coin just did 100x” to “I made $50K in a weekend” your brain gets hijacked.
You start chasing fantasies, not trades
That illusion of overnight success makes you ignore your own strategy. You stop following your plan and start trying to copy people who probably aren’t even real.
This is how social media slowly pushes traders into ruin
You feel left behind and that fear pushes you into greedy irrational decisions.
🔧 TradingView Tools That Help You Beat Greed 🛠
Luckily, TradingView offers several tools that can help keep your greed in check and your head clear
Alerts
Set an alert at your take-profit zone so you don’t keep staring at the chart. Let the system notify you when it’s time.
Long/Short Position Tool
Use this to visually define your entry, TP, and SL. Seeing it on the chart makes it easier to stick to your plan.
Bar Replay
This is gold for practice. Rewind price action and practice exits. See how often greed would’ve destroyed your trades.
Notes
Add reminders to your charts. Write things like “Exit at 2500 don’t overstay.” When future-you sees that message, it helps stay on track.
These tools don’t just improve your trades. They show discipline. And that’s exactly the kind of analysis editors look for when picking Editor’s Choice posts.
🚪 Final Words: In and Out, That’s the Game 🎯
Taking profit is a skill but exiting on time is an art
If you learn to respect your plan and silence greed, you’ll protect your capital and your sanity
There’s always a next trade if you survive this one
✨ Need a little love!
We pour love into every post your support keeps us inspired! 💛 Don’t be shy, we’d love to hear from you on comments. Big thanks, Mad Whale 🐋
📜Please make sure to do your own research before investing, and review the disclaimer provided at the end of each post.

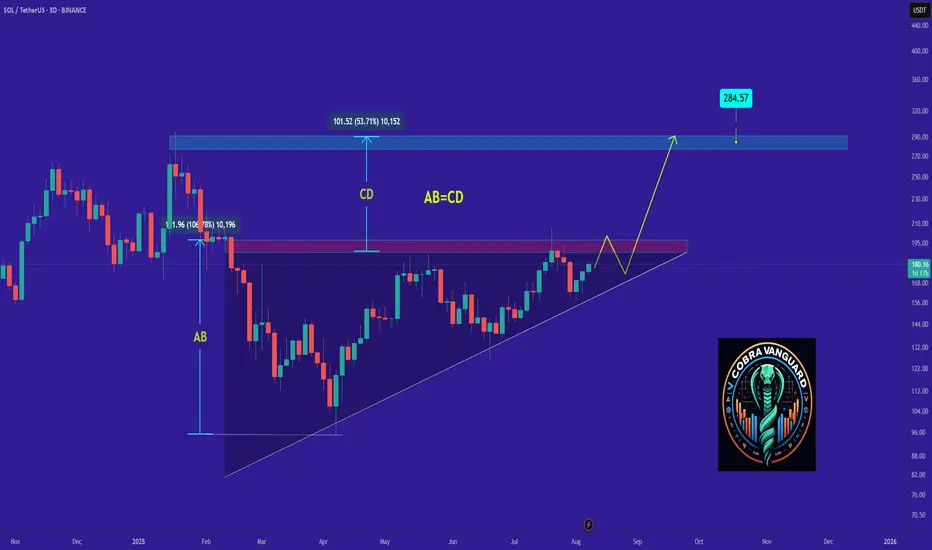
SOL's Situation, A Comprehensive Analysis !!!The price on the 3d timeframe is within an ascending triangle, which can be promising. If the price breaks this pattern with bullish candles, it could easily rise by the distance of AB=CD .
Best regards CobraVanguard.💚
SOL 4H Bounce From Support, Will Resistance Hold at July Highs?SOL has bounced cleanly from its ascending trendline, showing buyers are still defending key structure. Price is now approaching the 178–180 zone with the July highs near 208 acting as major resistance. A breakout above that level could fuel another leg higher, while failure to push through may invite another pullback toward trendline support. Bulls maintain control as long as the trendline remains intact.

SOLUSDT LONG- Signal: LONG
- Entry: SOLUSDT 178.55 ~ 178.70
- Take Profit: 179.32 / Stop Loss: 178.38

SOLUSDT LONG- Signal: LONG
- Entry: SOLUSDT 176.95 ~ 177.10
- Take Profit: 177.68 / Stop Loss: 176.78

SOLUSDTSOL reclaiming the 200 EMA with the 50–61.8% Fib zone as confluence — watching $181 for the breakout or rejection. 🚀📊

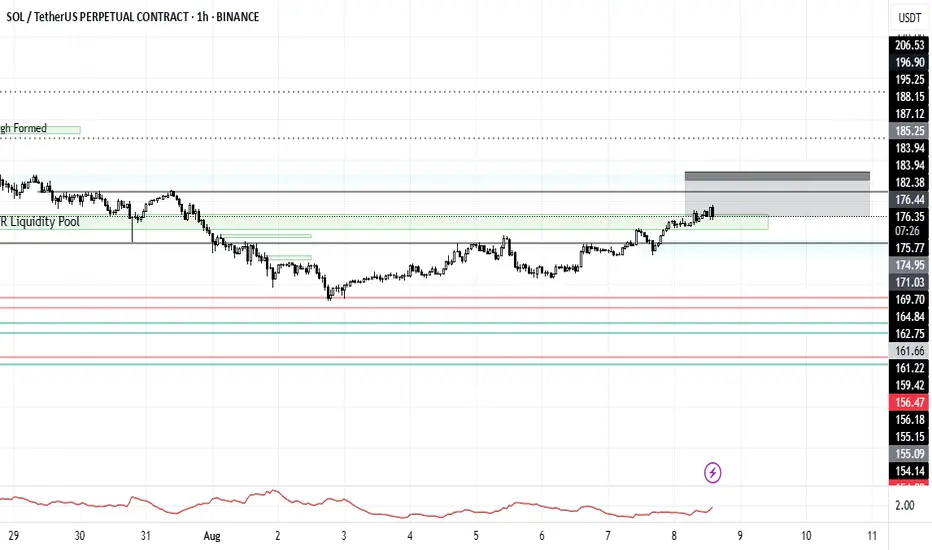
SOL short (Execution in <48 hours)After touching the 156 region, SOL has been in an uptrend trading back into the mid 170's
Here's my setup for the trade:
Reason : Order block slightly above previous resistance level.
Expecting a break through resistance, clearing stops before retracing to the mid 170's.
Entry : 184.5 - 186.7 ($2 spread depending on your broker/exchange)
Stop Loss : 187.5 (Anything above that invalidates the analysis)
Take Profit : 175 (Closest Liquidity Pool)
N.B;
This analysis is just my overview based on the current market outlook and is NOT FINANCIAL ADVICE!!!
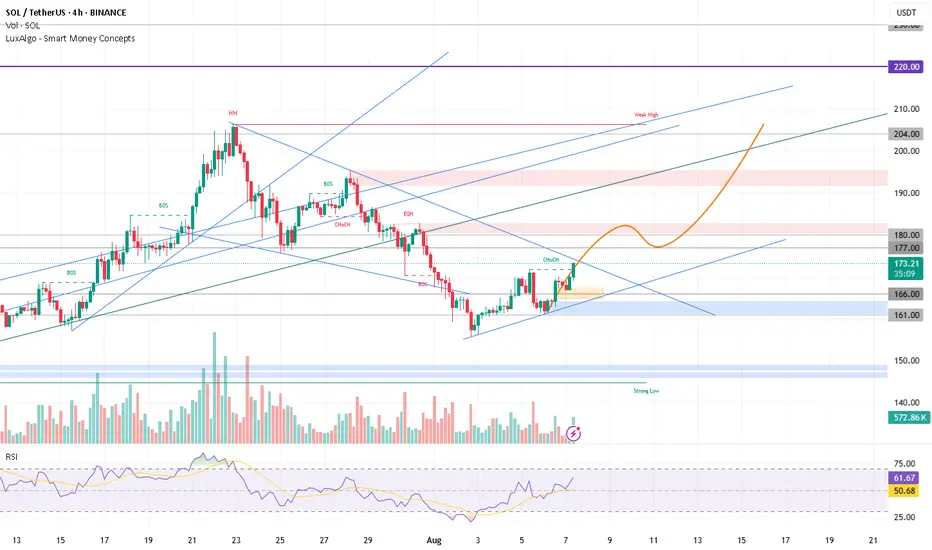
Solana consolidated above the descending wedge ┆ HolderStatBYBIT:SOLUSDT rotated higher after a swift corrective channel, reclaiming the mid‑range and pushing back toward the 195–205 supply. The chart highlights repetitive triangle resolutions and a strong sideway accumulation before the last impulse, suggesting ongoing demand. Immediate support sits at 176–180 and 168–170; holding above keeps attention on 195, then 205. A breakout through 205 unlocks 210–215 near the upper trend band. Only a daily close beneath 168 would compromise the structure and re‑open 155–160. Until then, dips remain buyable with targets at 195/205.

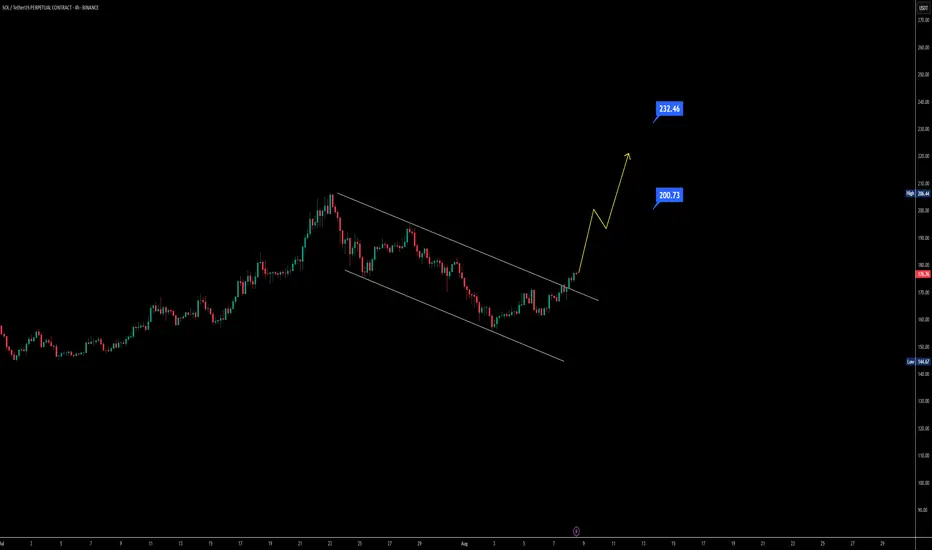
bullish signalif the next candle in next wee be a big green candle its become a morning star candle we know the trend is start bullish and we ready for 230 or 240 target

$SOL channel breakout could lead to a rally toward $260Solana has broken out of its recent downtrend on both the daily and 4-hour charts, showing clear signs of bullish strength. The price is pushing beyond its channel, and momentum suggests that the $200 liquidity zone is within reach.
If CRYPTOCAP:SOL can close above the $206 resistance, it could open the door for a rally toward $230–$260, revisiting the prime all-time high area. EMA structure is also supportive — the 21 EMA has crossed above the 50 EMA, while the 100 EMA has crossed over the 200 EMA, both reinforcing the bullish outlook.
With technical aligning and momentum building, Solana’s next move could be one of the most significant runs we’ve seen this year.
SOL LONG : Ready for the next move upPrice reversal for SOL looks complete .
Broke out of 172 resistance . Break jn structure now with a higher low and high.
Uptrend from here

SOL 1H – Trendline Break Holds, But Can Bulls Clear 178?olana has finally broken its multi-week descending trendline, with price reclaiming the 50/100 EMA cluster and showing strong momentum. The breakout point aligns with a potential change in market structure, but confirmation will depend on whether buyers defend the retest zone near 168–170.
If the breakout sustains, the next key hurdle sits in the 176–178 zone. Stoch RSI is currently in overbought territory, suggesting a possible cooldown before the next push.
Key watchpoints:
– Retest of breakout level for confirmation
– Holding above EMAs to maintain bullish bias
– Clearing 178 resistance to open room for continuation toward 185+

Solana Wave Analysis – 7 August 2025- Solana reversed from support area
- Likely to rise to resistance level 180.00
Solana cryptocurrency recently reversed from the support area between the pivotal support level of 160.00, lower daily Bollinger Band and the 61.8% Fibonacci correction of the upward impulse 1 from June.
The upward reversal from this support area stopped the previous short-term ABC correction 2 from July.
Given the clear daily uptrend, Solana cryptocurrency can be expected to rise to the next resistance level 180.00.

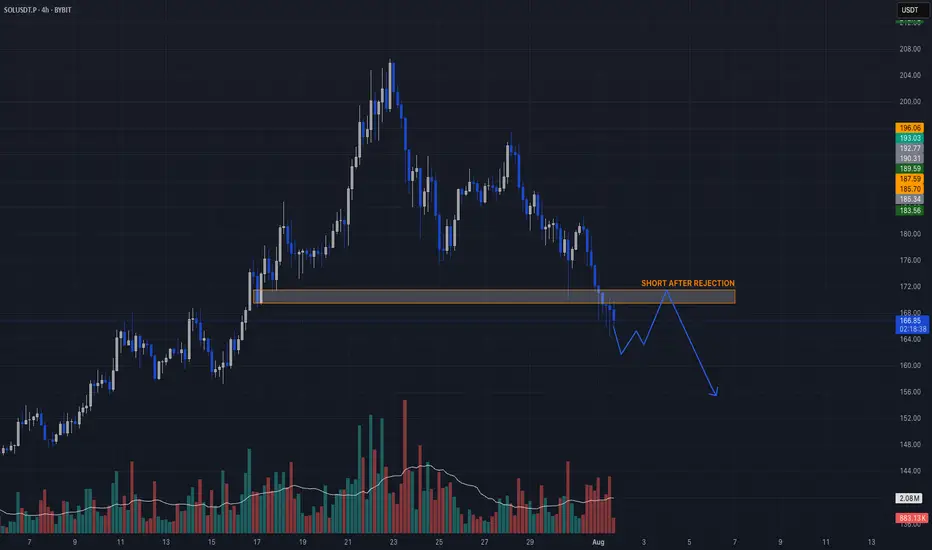
Momentum Continuation after Structural BreakdownHey Candle Fam,
We’re eyeing a clean short setup on SOL after structure broke down and buyers failed to hold key levels. Time to fade the bounce and let the market do the work.
🔥 SOLUSDT.P TRADE IDEA 🔥
Bias: Short
Strategy: Momentum Continuation after Structural Breakdown
Entry: 169.50 – 171.80
Stop Loss: 174.60
Take Profits:
▫️ TP1: 165.10
▫️ TP2: 161.30
▫️ TP3: 158.00 (extension target)
⸻
📊 Rationale:
– HTF structure: Sharp retracement from $215 top, lower highs forming
– LTF structure: Breakdown confirmed, no bullish CHoCH present
– Liquidity targeting: Clean sweep zones below $165 and $160
– Order flow: Sell-side delta dominance, funding positive = longs could unwind
– Volume profile: Imbalance between $172–175 now acting as rejection zone
🎯 Idea: Look for a minor pullback to $170–172, then ride downside liquidity flush. Protect profits fast if market spikes unexpectedly.
⸻
🧠 Stay sharp. Trade smart. Let the market come to us.
Candle Craft | Signal. Structure. Execution.
Solana formed the rising bottom ┆ HolderStatKUCOIN:SOLUSDT has respected the $158 key support following a structured pullback from recent highs. The setup features repeated bullish continuation patterns such as triangles and consolidation. Expect a potential move toward 184+ if support holds.

SolFun and memetokens on Solana: from chaos to structure
Solana — an ecosystem with a long-term vector
Solana occupies a stable position among the leaders in blockchain infrastructure. High speed, scalability, and minimal fees make it an ideal platform for both serious DeFi products and speculative activity. In recent months, interest in Solana has only grown, which has directly affected the number of new projects within the network.
One of the most notable trends has been memecoins. They are filling the blockchain at a tremendous rate, with dozens and hundreds of new assets appearing every day. This dynamic is largely explained by the ease of launching tokens through the Pump.fun platform.
The more popular Solana becomes, the more tokens will appear within it. This is a direct correlation: a strong foundation generates high activity at the second level of the ecosystem.
Memes as a reflection of the market
Meme tokens are not just chaos and humour. They are a separate form of local trading, with high volatility and instant reactions. This segment has become particularly active on Solana :
The absence of commissions makes trading convenient;
The speed of the blockchain allows for instant reactions;
The ease of launching tokens is a factor in mass adoption;
The community itself fuels trends.
But along with this came complications: scams, dumps, and mass bot participation. And here, the need for filtering comes to the fore.
The problem of selection and how traders deal with it
In a rapidly changing market, it is impossible to analyse every token manually. Therefore, most traders have long since developed a basic set of tools. These include things like auto-filters in Telegram, dashboards, and, of course, extensions directly within Pump.fun.
One of the most widely used is SolFun . It is built into the interface and displays key token metrics: reliability index, decentralisation, activity, holder concentration, presence of suspicious addresses, etc.
For most active participants in the Solana market, SolFun is not a ‘tool’ but part of the working environment. It has long been used by those who make dozens of trades per session.
What the trading logic looks like
In a hyperactive market, it is not the speed of entry that is important, but filtering. Successful traders do not try to catch every wave. Instead, they build a funnel: 80% of tokens are cut off at the analysis stage.
The scenario is simple:
Low reliability index — pass;
One of the holders owns too large a share — risk of dumping;
Suspicious activity from bot-like accounts on Twitter — pass;
If there are no red flags, the distribution is even, and the activity is lively, you can continue with the analysis.
These signals are immediately visible — many of them are displayed in SolFun . But perception comes not through the interface, but through habit — the eye catches familiar parameters. And if the picture does not match expectations, the trader does not enter.
Why technical analysis is not needed here
Memecoins on Solana are a market where technical analysis loses its meaning. There are no histories, patterns, or liquidity. Everything happens in minutes, and by the time any pattern appears, the movement is already complete.
Therefore, the approach here is fundamental — in its adapted form. This is not a study of the white paper, but a quick check:
How many unique holders are there?
Who are they?
How are the tokens distributed?
Is there activity from live users?
Are there any red flags — such as pBOT or sudden injections?
Such metrics are the basis of the logic that traders operate on. And tools like SolFun simply make this process faster.
Where is everything heading?
Solana is showing steady growth. This means that the ecosystem will continue to expand. And that means the meme market will only gain momentum. This is not just speculation — it is a reflection of demand and attention.
In such conditions, it is not the first to enter who survives, but those who know how to filter out the noise. SolFun , like other automated assistants, has simply established itself as part of this ecosystem. Not as a solution, but as infrastructure.
When Profit Comes, Leave Before It Vanishes Again. how??!!Have you ever stayed in a winning trade just to get more?
That voice whispering “keep it longer, this might be the big one”?
It’s the same voice that’s emptied thousands of portfolios...
Hello✌️
Spend 2 minutes ⏰ reading this educational material.
🎯 Analytical Insight on Solana:
BINANCE:SOLUSDT has seen healthy volume recently and is testing key daily support along with an important trendline. Holding these zones could fuel a 15%+ rally toward the $199 mark 📊🚀
Now, let's dive into the educational section,
🧠 The Psychology of Greed: Profit’s Evil Twin 😈
When you enter a trade and it starts moving in your favor, your subconscious kicks in. Suddenly, your brain whispers: “Just a little more... hold it!”
That’s when the greed game begins.
No matter how well you planned before the trade, once you're in profit, your brain creates a fantasy. A future where profits double, triple... a dream world. And this dream is exactly what makes traders give back everything including their original capital.
Our minds are wired to crave the rush of winning again. It’s like a hit of dopamine. So you hold the position even when the chart is flashing reversal signs. That’s the setup for disaster...
📉 Take-Profit Levels: Why Getting Out Is the Real Win 📌
Here’s the cold truth
If you don’t exit when you planned to, that profit was never really yours
A take-profit isn’t just a number. It’s a psychological boundary that separates a disciplined trader from an emotional one. Many beginners think setting a TP means giving up potential gains but in reality, it means respecting your plan and your capital.
You’ll always have another chance to trade. Always
But if greed wipes out your funds, there’s nothing left for the next opportunity
Each trade is just a chapter, not your whole story.
🧪 The Social Media Trap: When Your Brain Stops Thinking 📱
Online hype is poison. From “X coin just did 100x” to “I made $50K in a weekend” your brain gets hijacked.
You start chasing fantasies, not trades
That illusion of overnight success makes you ignore your own strategy. You stop following your plan and start trying to copy people who probably aren’t even real.
This is how social media slowly pushes traders into ruin
You feel left behind and that fear pushes you into greedy irrational decisions.
🔧 TradingView Tools That Help You Beat Greed 🛠
Luckily, TradingView offers several tools that can help keep your greed in check and your head clear
Alerts
Set an alert at your take-profit zone so you don’t keep staring at the chart. Let the system notify you when it’s time.
Long/Short Position Tool
Use this to visually define your entry, TP, and SL. Seeing it on the chart makes it easier to stick to your plan.
Bar Replay
This is gold for practice. Rewind price action and practice exits. See how often greed would’ve destroyed your trades.
Notes
Add reminders to your charts. Write things like “Exit at 2500 don’t overstay.” When future-you sees that message, it helps stay on track.
These tools don’t just improve your trades. They show discipline. And that’s exactly the kind of analysis editors look for when picking Editor’s Choice posts.
🚪 Final Words: In and Out, That’s the Game 🎯
Taking profit is a skill but exiting on time is an art
If you learn to respect your plan and silence greed, you’ll protect your capital and your sanity
There’s always a next trade if you survive this one
✨ Need a little love!
We pour love into every post your support keeps us inspired! 💛 Don’t be shy, we’d love to hear from you on comments. Big thanks , Mad Whale 🐋
📜Please make sure to do your own research before investing, and review the disclaimer provided at the end of each post.

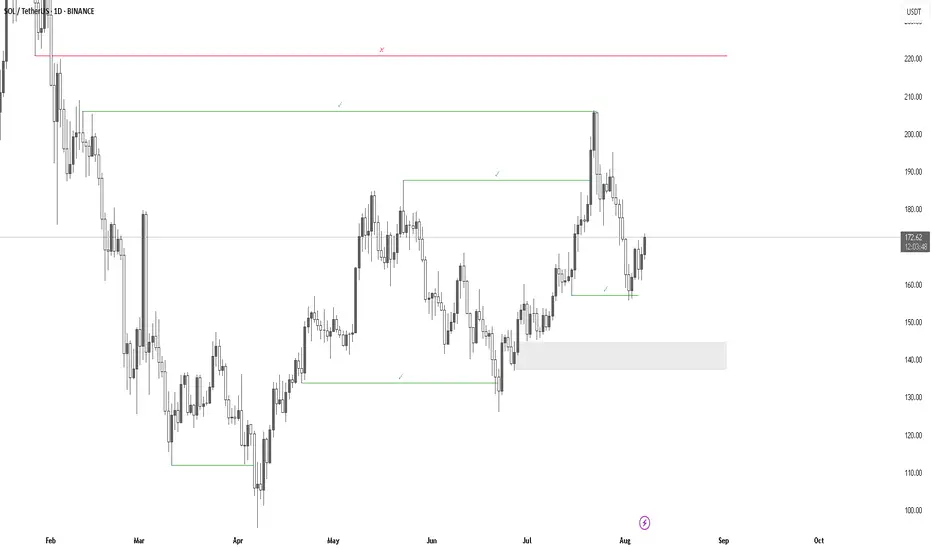
SOL will gain previous top in the near future. The last station I believe that 204$ would be the 50% margin save profit. In my point of view, 220-230$ could be the top of CRYPTOCAP:SOL in this cycle. And it's better to take out your margin from the Solana.
SOLANA Breaking Out?Solana look ready to rip. As you can see, we had a golden cross between the 50 MA and 200 MA (which I shared at the time), which is now acting as clear support on the last few daily candles. Price appears to be leaving the station.
It may not be full blown alt season, but it looks good for major with a narrative.
Phemex Analysis #103: SOL at $168—Bull Trap or Moon Mission?2025 has been a wild ride for Solana ( PHEMEX:SOLUSDT.P ). Its price soared from $189 on January 1 to an all-time high of $295 on January 19, only to crash over 65% to a low of $95 by April 4. Today, SOL has bounced back to around $168, sitting between a key support at $145 and resistance at $209.
Fundamentally, Solana is trending back into the spotlight. Institutional interest is up, with ETF filings from major players like Franklin Templeton, Grayscale, and VanEck. The launch of the REX-Osprey Solana + Staking ETF (SSK) in July—offering a 7.3% staking yield—has added fuel to SOL’s resurgence. On-chain activity remains strong, with over 22 million active addresses and growing developer engagement following performance upgrades like Alpenglow.
With fundamentals strengthening, institutional interest building, and price action showing renewed life, let's explore the possible near-term moves for Solana.
Possible Scenarios
1. Bullish Breakout to $209 and Beyond
SOL may continue its rebound and test the $180–$190 resistance zone. If that breaks with heavy volume, we could see a bullish continuation toward $200–$209, opening the path for a test of recent highs.
Pro Tips:
Entry Signal: Buy on a breakout above $180 with strong volume confirmation.
Profit Targets: Look to take gains near $200 and $209, while watching for further momentum toward $250+.
Risk Management: Place stop-loss just below $165 to protect against sudden reversals.
2. Consolidation Between $145–$180
If buying pressure isn’t enough for a breakout, SOL could consolidate within the $145–$180 range. This would allow the market to digest recent volatility and prepare for the next move.
Pro Tips:
Range Trading: Use grid bots or buy near support ($145–$150) and sell near resistance ($175–$180).
Breakout Watch: Wait for volume to increase at breakout or breakdown levels before taking a more aggressive position.
3. Bearish Breakdown Toward $145
If broader market sentiment shifts or ETF momentum fades, SOL could fail to hold above $145, triggering a correction toward lower support levels near $130 or even $100–$120 in a severe scenario.
Pro Tips:
Reduce Risk: Scale out of positions or go cautious if $145 fails decisively on high volume.
Dip Accumulation: Long-term investors may look to re-enter at stabilized price zones at $130–$120.
Conclusion
Solana remains in a critical phase where fundamentals—signal upgrades, active developer growth, and institutional ETF activity—align with technical bounce patterns. Whether SOL breaks out into a new rally, consolidates, or pulls back depends on upcoming price action and broader market sentiment. By using clear entry triggers, defined targets, and disciplined risk management, traders can effectively ride Solana’s next wave of volatility.
🔥 Tips:
Armed Your Trading Arsenal with advanced tools like multiple watchlists, basket orders, and real-time strategy adjustments at Phemex. Our USDT-based scaled orders give you precise control over your risk, while iceberg orders provide stealthy execution.
Disclaimer: This is NOT financial or investment advice. Please conduct your own research (DYOR). Phemex is not responsible, directly or indirectly, for any damage or loss incurred or claimed to be caused by or in association with the use of or reliance on any content, goods, or services mentioned in this article.

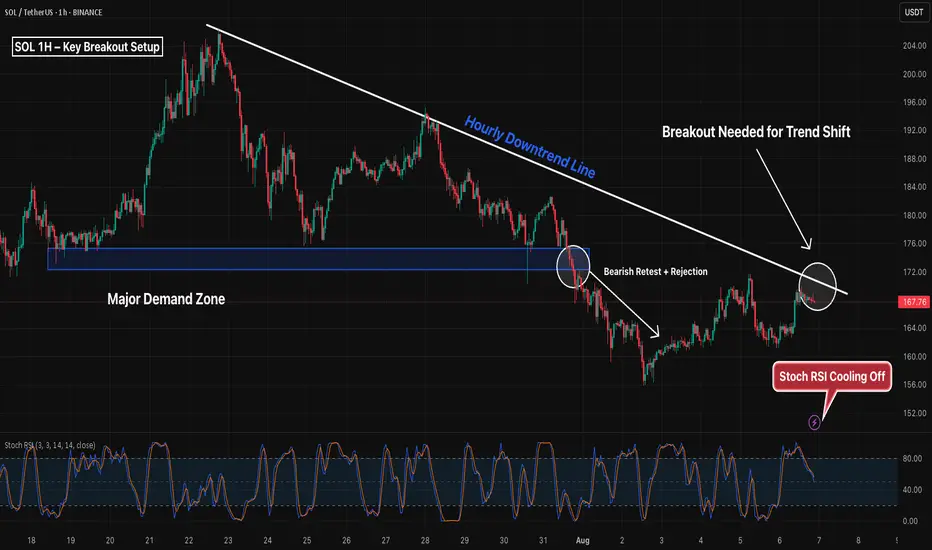
SOL 1H – Key Breakout Setup, But Will the Trendline Hold Again?Solana continues to trade within a sharp hourly downtrend, with price currently pressing up against the trendline after a clean bounce from the major demand zone.
The previous retest of the demand zone led to a bearish rejection from the same area (noted in the circled wick), followed by a clean continuation lower. Now, price is back near the trendline — but Stoch RSI is cooling off, suggesting short-term momentum may stall.
A confirmed breakout through the trendline would be the first real shift in trend structure — otherwise, another lower high could lead to fresh downside.
What to watch:
– Breakout above trendline = early reversal signal
– Rejection = continuation of hourly downtrend
– Demand zone remains key support
– Momentum fading slightly on Stoch RSI
This is a pivotal zone — wait for confirmation before jumping in.