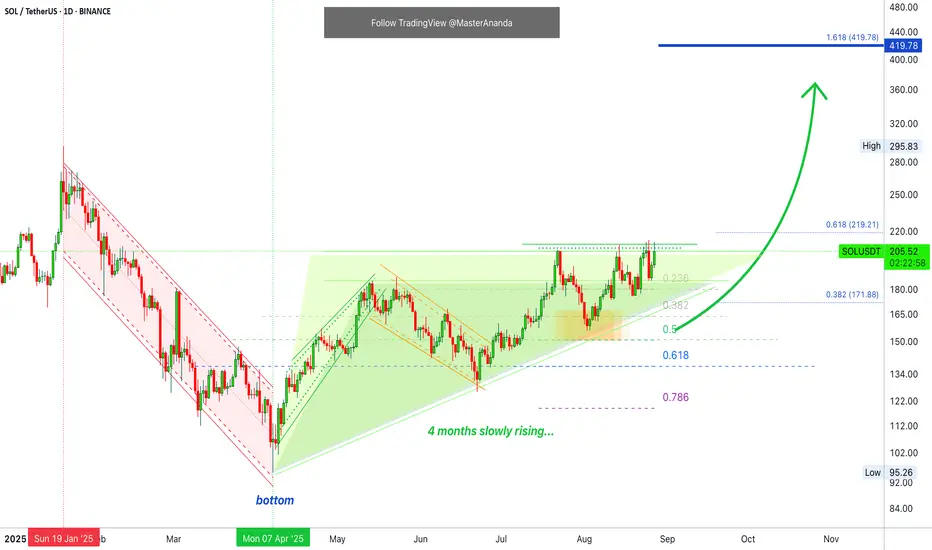
SOL/USDT | Solana Surges 43% – Is a 25% Bullish MoveStill Ahead?By analyzing the Solana (SOL) chart on the daily timeframe, we can see that the price held strongly above $171 as expected in our previous analysis and has already hit two major targets at $195 and $206, even spiking up to $212 — securing an impressive 43% rally so far! 🚀
After reaching this critical resistance zone, we’ve seen a wave of selling pressure, and SOL is currently consolidating around $204. As long as the price remains above $193 and doesn’t break below it, the bullish momentum is likely to continue, with renewed demand driving the next leg up.
The upcoming bullish targets are positioned at $220, $245, and $260, offering a potential short-term upside of over 25%.
Please support me with your likes and comments to motivate me to share more analysis with you and share your opinion about the possible trend of this chart with me !
Best Regards , Arman Shaban
Trade ideas
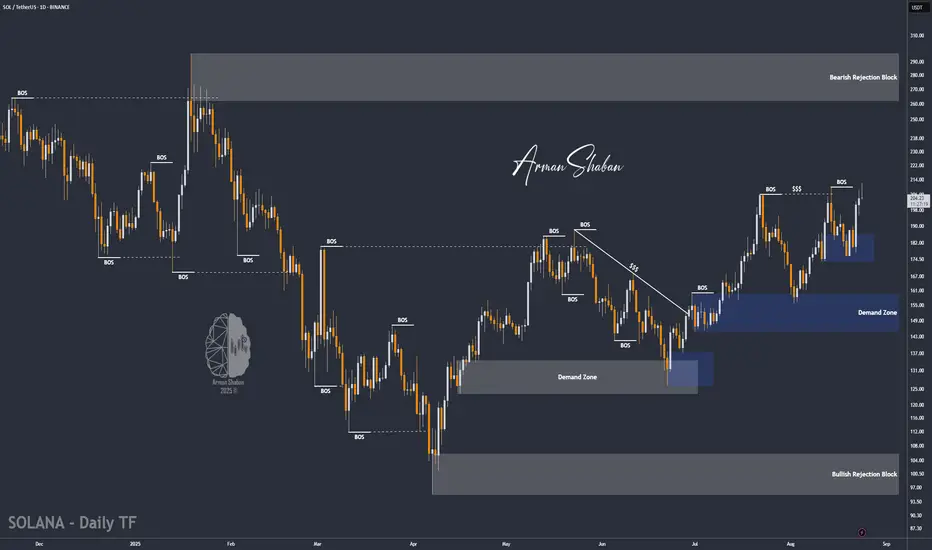
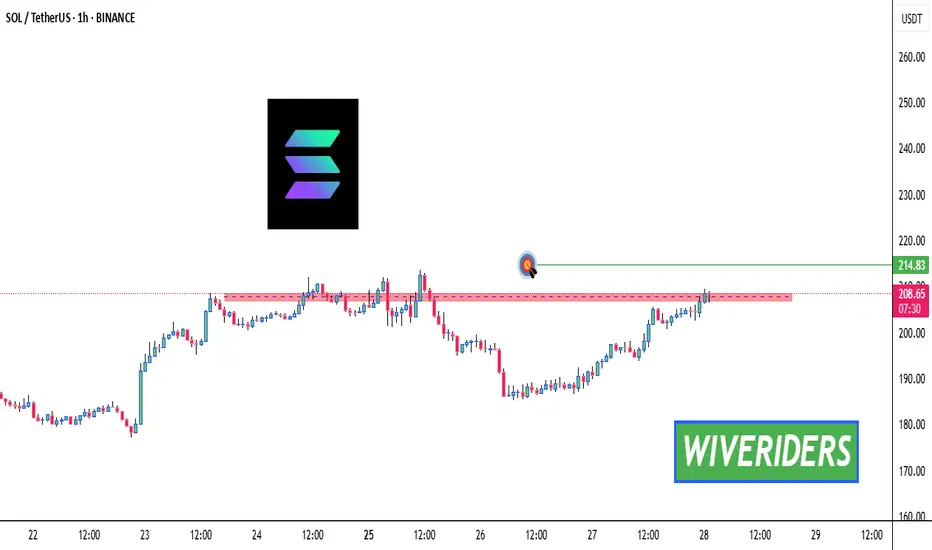
Solana DailyPrice is currently trading around $214, right below a strong resistance zone near $230–$235. In the past, this level acted as supply, pushing the price down.
The chart shows a short setup with a stop loss above resistance and a target around $130, which is the next strong support area.
In simple terms:
If the price fails to break above $230, it could drop towards $130.
If it breaks and closes strongly above $230, the bearish setup becomes invalid, and the next resistance is around $263.
This setup is based on the idea that price is retesting an important resistance after a big rally.

#SOL Don't worry until 240 $.but after that, 60 $ is coming.#SOL Don't worry until 240 $.but after that, 60 $ is coming.
#SOL Crash. We already warned when SOL is Trading above 240 $ ..
Past Analysis also attached.

Solana seeks to the $220 ┆ HolderStatBINANCE:SOLUSDT on the 6h chart shows a rebound after a -23% correction, confirming higher support around 170. The price structure remains bullish inside the ascending channel, and the focus is on resistance near 213–215. Buyers continue to step in on dips, maintaining the larger uptrend.

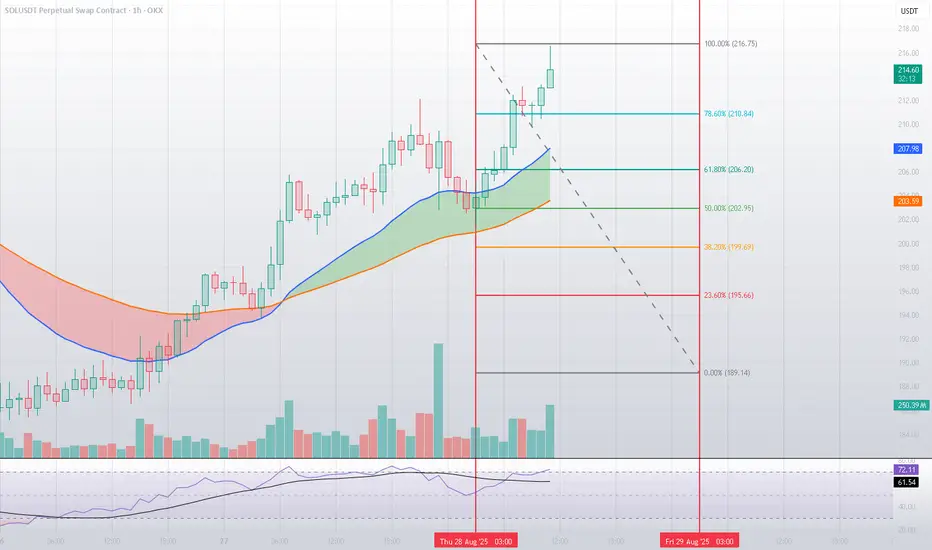
Technical Analysis for SOL/USDTBased on mathematical and statistical models, along with technical tools such as Fibonacci retracement levels and moving averages, Solana (SOL) continues to show strong bullish momentum after breaking key levels and trading around $215.
🔹 Resistance Levels
$216.75: The first major resistance, derived from the 100% Fibonacci extension. A confirmed breakout above this level would likely trigger a new impulsive move upward. 🚀
$225.61: A critical resistance zone. Surpassing this level would further validate the bullish trend and open the door for an extended rally toward $230+.
🔹 Support Levels
$213.38: The first support level. Holding above this zone reflects buyers’ strength, while a break below it could lead to a short-term correction. 🛡️
$210.84: A stronger and more decisive support aligned with the 78.6% Fibonacci retracement. Losing this level would weaken bullish momentum and potentially push the price down toward $206 – $202.
📈 Indicators
The RSI is hovering around 72, signaling overbought conditions ⚠️, which may trigger short-term corrections before any further upside.
The 20 & 50 EMAs remain in a bullish alignment, confirming the upward trend as long as price holds above key support levels.
🟢 Bullish Scenario
A successful breakout above $216.75 will pave the way toward $225.61, with potential continuation toward $230+ if momentum persists.
🔴 Bearish Scenario
Failure to clear resistance and a corrective pullback could test $213.38 first, followed by $210.84 as a decisive support level to avoid a deeper trend reversal.
✅ Conclusion
Solana stands at a critical juncture between strong resistances around $216 – $225 and solid supports near $213 – $210. A breakout or breakdown from these zones will define the next major move — either extending the bullish rally or triggering a deeper correction. ⚖️
SOLANA to $600Solana held $123 as support on the monthly timeframe, with the next resistance at approximately $640 in November.

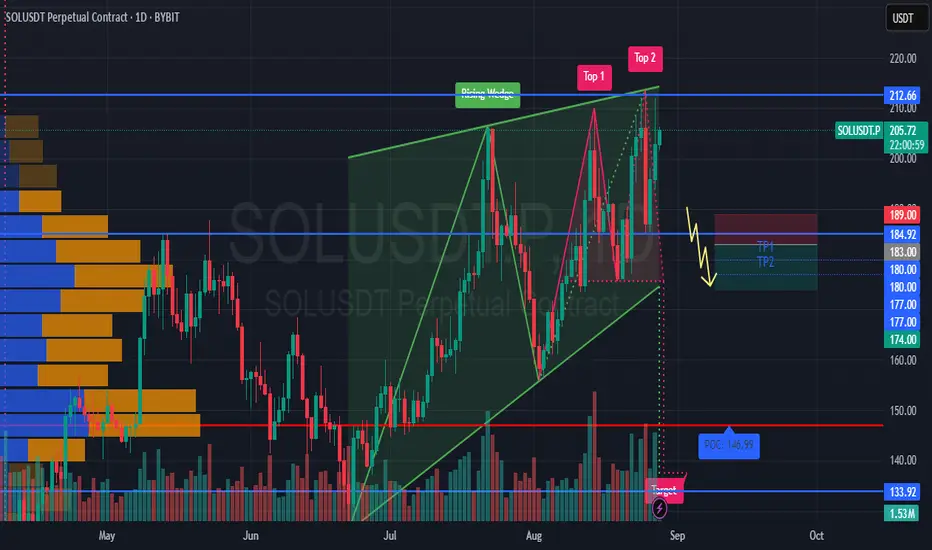
#SOLUSDT maintains a bearish setup📉 SHORT from $183.00
🛡 Stop loss $189.00
🕒 Timeframe: 1D
❗ If the price consolidates above $189, the setup becomes invalid.
⚡ Overview:
➡️ On the daily chart, a Rising Wedge has formed — a bearish pattern signaling potential reversal.
➡️ The $183.00 level is the key zone where the short scenario gets activated.
➡️ The POC at $146.99 remains a strong long-term magnet for price.
➡️ Increasing volumes on red candles confirm seller interest.
🎯 TP Targets:
💎 TP 1: $180.00
💎 TP 2: $177.00
💎 TP 3: $174.00
📢 Short entry is optimal from $183 with a clear stop at \$189.
📢 Focus on holding below $183 — this will confirm the bearish continuation.
📢 In the long term, if $174 breaks, the target could extend to the $147 (POC) zone.
🚀 #SOLUSDT maintains a bearish setup — as long as price holds below $183, expect a move toward $174 and potentially further downside.
$SOLUSDTSOLONA ready to pullback into the discount level for another ride to the upside.
Will be looking forward to enter the counter trend sell into the the bullish area

Solana · At The Top of The RangeI've been looking at many charts and seeing a repeating pattern; many pairs are trading right at resistance, at the top of the range.
This same rising triangle we see on SOLUSDT was present in another pair, and many other charts look similar.
The altcoins market is pushing higher, trying to break a local resistance zone. You know what happens when this level breaks don't you? Wave 3 of the bullish cycle, normally the strongest wave, starts.
Wave 5 is still missing of course but it normally tends to be an extension of the third. Sometimes wave 5 can become much bigger than wave 3 but right now we still don't know how things will develop in this current bullish cycle. In general, wave 3 is always the strongest one.
So there is the possibility that we are right in front of the strongest period of bullish action in the entire 2025-2026 Cryptocurrency bull market.
Summary
Solana is going up. Even if prices drop, the end result of the drop would be a higher low, which implies higher prices next.
Regardless of the short-term, SOLUSDT is set to move higher. This statement is supported by market data.
Thank you for reading.
Namaste.
SOL : I want to shop in these areas.Hello friends
Well friends, after a few hunts for the channel, the buyers finally broke the channel and the task was clear.
Now, with the price growth and correction we had in the areas identified as channel price pivots, I want to buy and move with it to the specified targets.
*Trade safely with us*

SOL Breakout Alert! 🚨 CRYPTOCAP:SOL Breakout Alert! 🚨
CRYPTOCAP:SOL is currently testing the red resistance zone 🔴
If price breaks out, the first target will be the green line level 🎯
A confirmed breakout would signal bullish continuation and could drive price higher ✅
Solana (SOL): Buyers Are Building Bullish Setup | Q4 BullRunHad minimal sleep today, hence the sleepy voice but had to make a video today—we are seeing good momentum building up for SOL coin, which could give us a decent buy entry here.
More in-depth info is in the video—enjoy!
Swallow Academy

SOL - 1H Elliott Wave Analysis - 27.08.25Greetings :)
Today we got two scenarios ready for you!
Scenario 1:
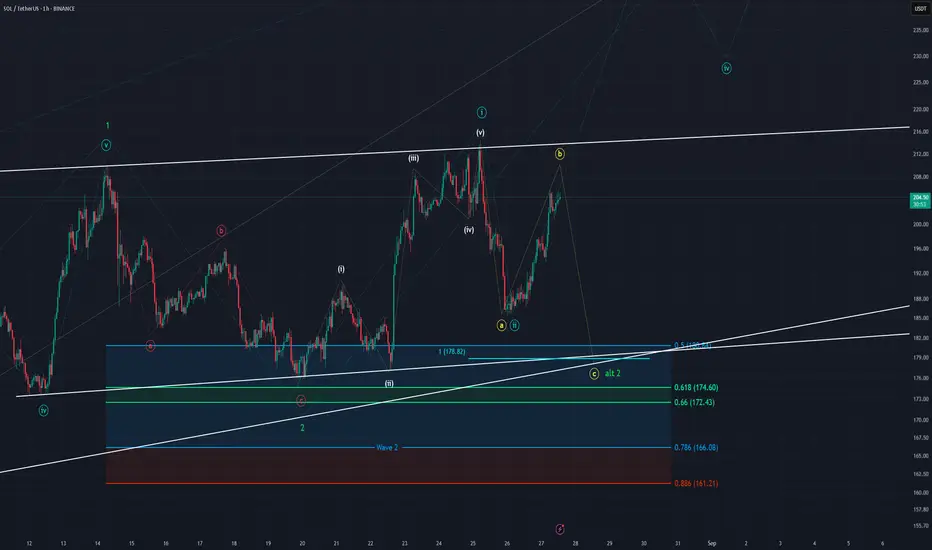
The low of the 20th August is the finished green Wave 2 and the bounce we saw from the support area can be counted as the white 5 wave move up which finished the blue Wave 1. It do be not the pretties 5 wave move up. The sharp drop after the high of the 25th August can be seen as blue Wave 2 and we started the 3rd Wave up.
Scenario 2:
The low of the 20th August was only the A Wave of a bigger correction and the bounce we saw was an overshooting B Wave which topped on the 25th of August and currently we are working on Wave C down which would then finished the green Wave 2. The next target for the C would be the 1 to 1 FIB at 178.82 USD which is in confluence with the two lower white trendlines we put on the chart.
The green Wave 2 support are lies between the 0.5 FIB at 180.84 USD and the 0.786 FIB at 166.08 USD. In either Scenario as long as we hold support we are looking for a aggressive Wave 3 to the upside which should take us to 300 USD+ respectively to a new ATH.
We think both scenarios are likely but we lean slightly to Scenario 1.
Thanks for reading.
NO FINANCIAL ADVICE.
Is SOL about to spike down? SOL was been in a upward channel for awhile now it’s now hitting a horizontal weekly resistance as well but has made a rising wedge pattern very close to the resistance from the channel and the horizontal resistance as well SOL I think that SOL will will go up temporary to around 206-216$ before going down to possibly around 150-140$ possibly less depending on the momentum of the trend

SOL Q4 2025 playAcumulate SOL during remainder of Q3 between 170 150 and aim for a 495 target in Q4.
Mainly DATs and people wanting to play the same game with the 3rd largest coin. 4th or 5th if you care about the semantics.

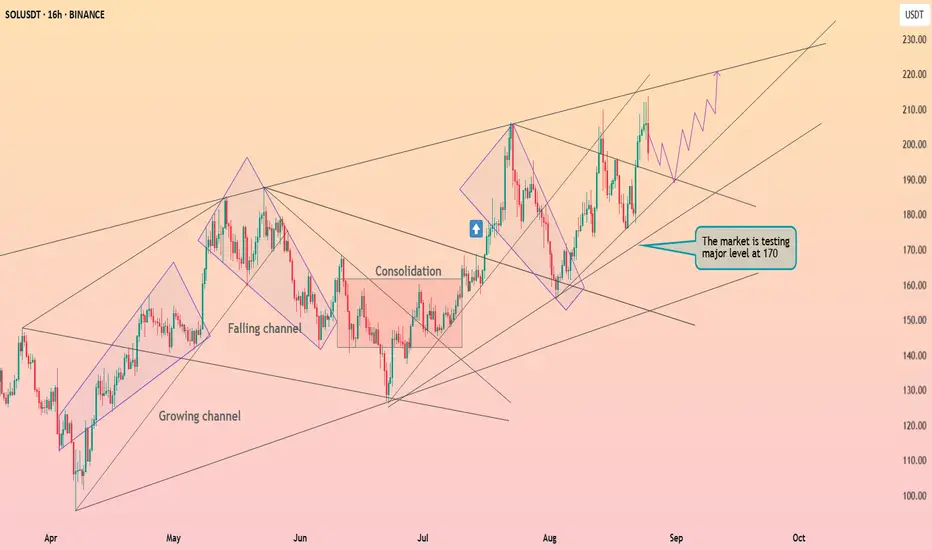
Solana fixed above the $175 ┆ HolderStatBINANCE:SOLUSDT on the 16h chart is testing the major $170 resistance level. Previous consolidations and falling channels have transitioned into higher highs, supporting the broader bullish structure. A breakout above $170 would confirm momentum toward $200, while $160 acts as the critical support for invalidation.
Weekly trading plan for SolanaLast week, Solana showed strong volatility following Ethereum. Now the price is also in a correction, and the plan for this week looks quite similar.
Locally, a trendline can be drawn — if it breaks, the downtrend will likely continue toward the first and possibly straight to the second support level. I explained this in detail in the video.
It’s also possible to see a bounce back to the pivot point after reaching S1 . If the pivot point breaks, the target will be a new high. If resistance holds, the correction will continue. Additionally, if 171 breaks, we could see a drop toward 161 .

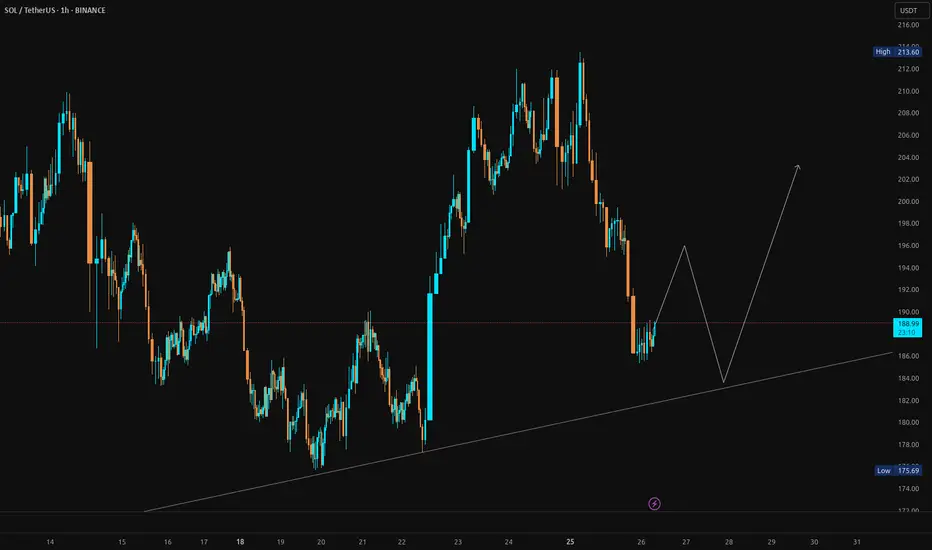
Solana (SOL/USDT) – Retest of Trendline Support for Potential UpSOL/USDT is consolidating around the $188 level following a corrective move from the recent $213 high. Price action is approaching an ascending trendline that has held as support in previous sessions. A potential scenario would be a retest of the $185–186 area, followed by a bullish rebound toward the $200–204 zone. A clean break below the trendline could invalidate this setup and expose downside toward $175.
bearish market for solanaGreetings to our dear friends.
After breaking the bottom and pulling back, Solana could fall to the specified bottom and we could witness a bear market.

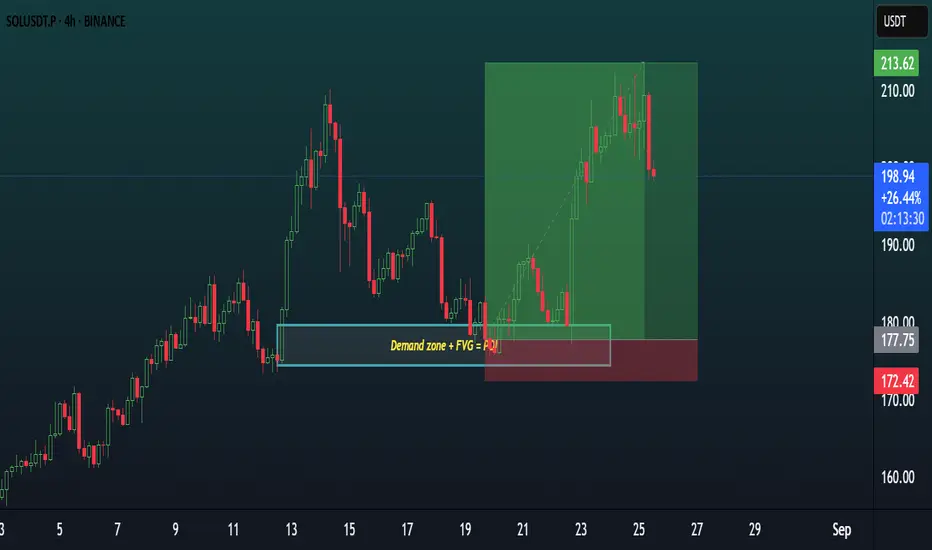
SOLUSDTSOLUSDT | 4H | Bullish Bias
🔑 Key Structure Update:
Price tapped into demand zone + FVG, marking a strong POI for potential reversal. Previous bearish leg may shift if buyers defend this level.
📍 POI Level (Demand Zone + FVG):
$175 – $178 range.
Reason: Overlap of demand zone + fair value gap, acting as liquidity zone.
📊 Trade Plan:
Wait for bullish confirmation (reversal pattern or BOS on lower timeframe) before entry.
🎯 Targets:
TP1: $190
TP2: $205
TP3: $220 (extended target if momentum sustains)
❌ Invalidation (SL):
Below $170 (clear demand failure).

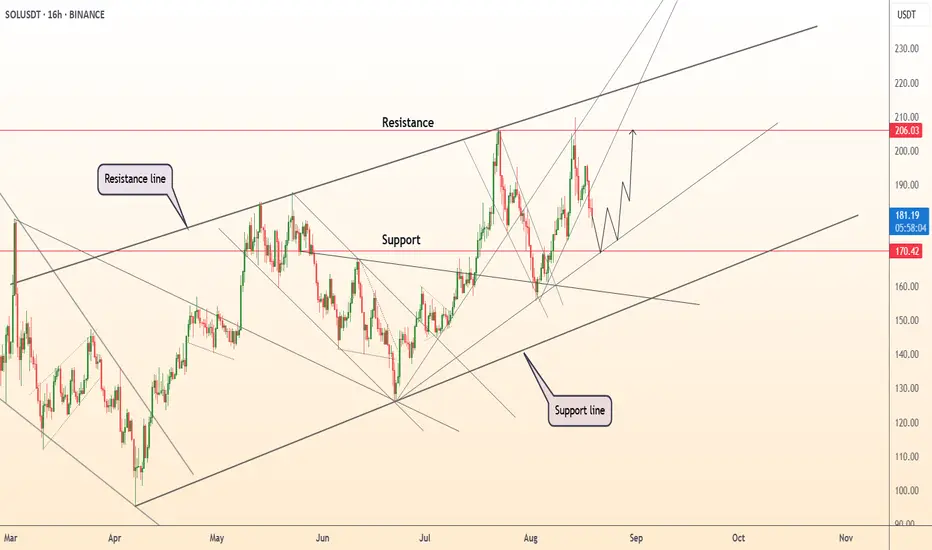
DeGRAM | SOLUSD repeated pullback from $205📊 Technical Analysis
● SOLUSD is consolidating near the rising support zone of 170–172 within a broad ascending channel, preparing for another attempt toward the 206 resistance level.
● A breakout above 206 would confirm bullish continuation, opening the path to challenge the channel top around 220–230, supported by higher lows and strong structural momentum.
💡 Fundamental Analysis
● Analysts now assign a 95% probability to spot Solana ETF approvals, boosting institutional interest, while Solana’s mainnet reached 100,000 TPS in stress tests, reinforcing scalability.
● Corporates like BIT Mining and Upexi are making direct multi-million-dollar allocations into Solana, underscoring growing confidence in its long-term adoption.
✨ Summary
Bullish above 170; breakout trigger at 206. Targets 220 → 230. Invalidation on a close below 170.
-------------------
Share your opinion in the comments and support the idea with a like. Thanks for your support!