The Next Explosion, Hidden Clues in Price BehaviorCan you really feel the next Bitcoin explosion just by reading the charts?
The market looks calm, but deep down something big is shifting.
When everyone expects a crash, history shows that’s when the biggest moves begin.
Hello✌️
Spend 2 minutes ⏰ reading this educational material.
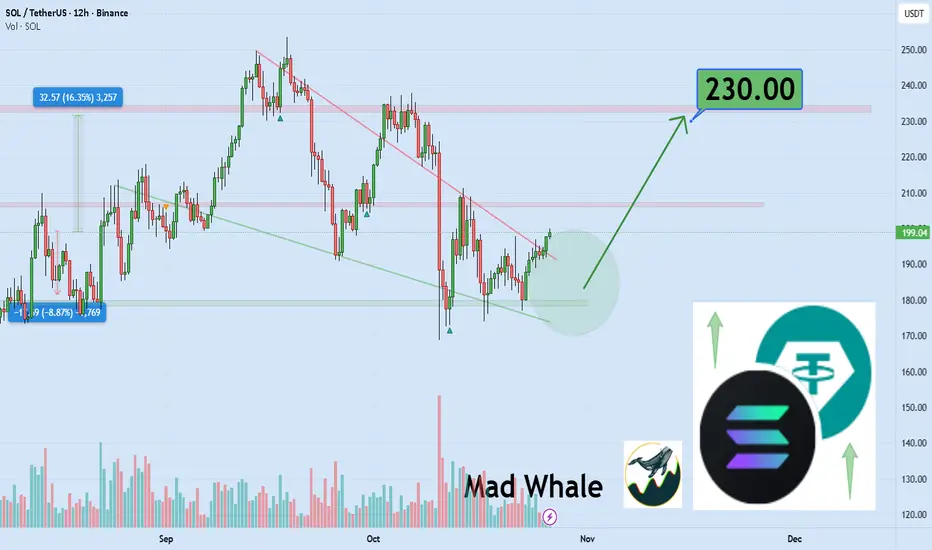
🎯 Analytical Insight on Solana:
BINANCE:SOLUSDT is testing a key daily support; holding this zone could spark a 16% rally, targeting $230. 📈🛡️
Now , let's dive into the educational section,
🌋 The Calm Before the Storm
The crypto market is like the ocean before a tsunami quiet but full of hidden energy. On higher timeframes, candles look small and boring, yet trading volume is rising. That mix of silence on the surface and pressure underneath is exactly what happens before every strong bull run.
💡 Hidden Clues in Price Behavior
Bitcoin’s price has been building quiet support for weeks, while big transactions are slowly increasing in the background. This usually means that smart investors are buying without drawing attention. Rising volume with little price movement is often the first signal that accumulation has started.
🚀 Bitcoin The Engine of the Next Explosion
In every cycle, Bitcoin moves first. Breaking major resistance levels and holding above them is a sign of growing confidence. When Bitcoin dominance starts to drop and altcoin volume goes up at the same time, that’s when the whole crypto market gets ready for a collective takeoff.
🧠 Trader Psychology During Market Silence
Most traders fear a quiet market, but experienced ones see it as the best setup. When the media talks about stagnation and panic, the big players are quietly building long positions. The difference between average and professional traders is simple: one sees silence as danger, the other as opportunity.
🔍 The Path to Spotting the Next Big Move
To catch the move early, start with volume. When volume rises at support levels without breaking previous lows, it usually means smart money is buying. A positive divergence between price and RSI often appears right before momentum flips. Then watch for a bullish MACD cross on the daily chart when all three signals align, the explosion is close.
⚙️ TradingView Tools That Reveal Market Explosions
TradingView offers powerful tools that can help you detect big moves before they happen.
1. Volume Profile
Shows where most buying and selling happened. Heavy zones are usually where whales make their decisions.
2. MACD
Reveals when market momentum is changing direction. A bullish cross in the negative zone often signals the start of a reversal.
3. RSI
Measures the strength of buyers versus sellers. When RSI breaks above 50, a new bullish phase is often beginning.
4. Alert System
Highly underrated! Set alerts for your favorite indicators so when they align, you get notified instantly.
5. Multi-Timeframe Analysis
Use multiple timeframes to avoid fake signals. Comparing daily and 4-hour charts gives a much clearer picture of big moves.
⚡ Summary
All signs point to a massive move ahead. Bitcoin’s calmness is deceiving, but the data doesn’t lie. Stay patient, follow your signals, and you might witness one of the strongest uptrends in years.
🧭Golden Tips for Smart Traders
Patience beats excitement. The biggest profits go to those who wait for confirmation, not those who rush in
Ignore the crowd’s emotions. When the mood is darkest, opportunities are often the brightest.
Trust the chart, not your fear. The market always tells the truth if you take the time to listen.
✨ Need a little love!
We pour love into every post your support keeps us inspired! 💛 Don’t be shy, we’d love to hear from you on comments. Big thanks, Mad Whale 🐋
📜Please make sure to do your own research before investing, and review the disclaimer provided at the end of each post.
Trade ideas
SOL/USDT Holds 185 USD – Waiting for Next Breakout Momentum?Hello everyone,
BINANCE:SOLUSDT is pausing around 185 USD after a corrective pullback from the 200 USD area. This is not a negative signal but a market rebalancing phase following the prior uptrend. The bullish structure remains intact with a sequence of higher highs and higher lows, showing no signs of a trend break. Currently, price is retesting the key support at 185 USD, which aligns with a Fair Value Gap (FVG) that attracts liquidity and often triggers renewed buying interest.
If this zone holds, SOL is likely to rebound towards 190 USD before challenging the psychological 200 USD level. Conversely, a clear break below 185 USD could see deeper FVG zones around 180 USD or 175 USD acting as the next equilibrium points. Trading volume is declining while price moves sideways – indicating an accumulation phase awaiting a new catalyst rather than a sell-off.
From a fundamental perspective, the Solana ecosystem continues to attract capital from DeFi and AI sectors, with no negative news suggesting a reversal. Current volatility largely depends on general market sentiment and Bitcoin’s behavior. The sensible strategy is to monitor price reaction at 185 USD: a clear bounce may warrant trend-following buys targeting 190–200 USD, while a break should prompt patience until the 180 USD zone before making any decisions – avoiding FOMO at all costs.
Do you think 185 USD represents a buying opportunity or a signal of deeper downside? Share your perspective below!

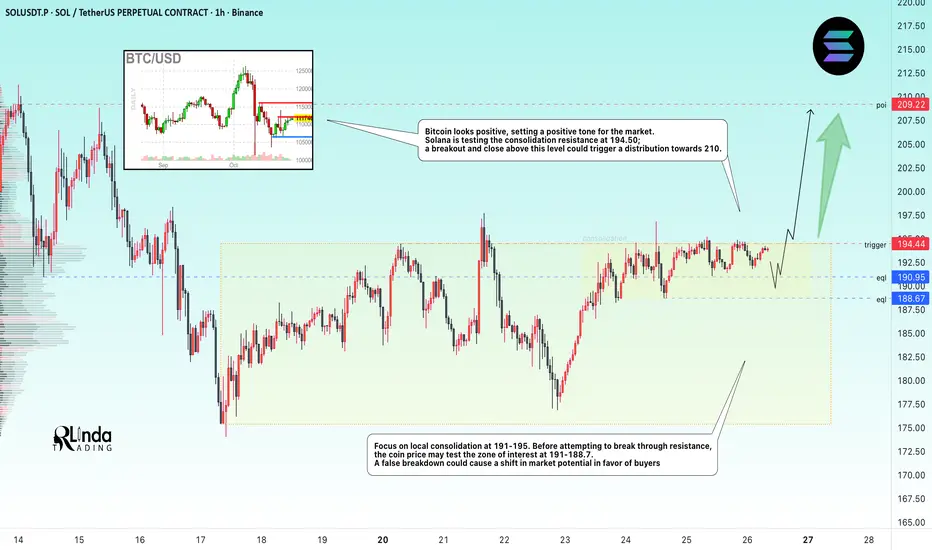
SOLANA → Consolidation before resistance. An attempt at growth?BINANCE:SOLUSDT.P is testing the resistance of the trading range, with pre-breakout consolidation forming, indicating that buyer interest in the coin is emerging.
Bitcoin looks positive, which sets a positive tone in the market. Solana is testing the resistance of consolidation at 194.50; a breakout and close above this level could trigger a distribution to 210.
Focus on local consolidation at 191-195. Before attempting to break through resistance, the coin price may test the zone of interest at 191 - 188.7. A false breakout could cause a shift in market potential in favor of the buyer, which in turn could trigger a breakout of 195 and growth.
Resistance levels: 194.5, 209
Support levels: 190.1, 188.7
A retest of resistance, consolidation after growth, and no reaction to bears are positive signs that a breakout attempt may be realized. A close above 194.5 - 195.0 would be a good sign for growth.
Sincerely, R. Linda!
SOLUSDT: Technical Factors Remain Bearish👋Hello everyone, let’s take a look at BINANCE:SOLUSDT !
SOLUSDT is currently trading around $181, continuing its multi-day correction. This pullback comes as the overall crypto market weakens following Bitcoin’s sharp decline and broad profit-taking among major altcoins. Market sentiment remains cautious as investors await the upcoming U.S. PCE data and clearer signals from the Federal Reserve’s interest rate policy.
On the technical chart, SOL is moving within a falling wedge pattern. The $190–$200 area serves as the main resistance zone, while momentum indicators like EMA34 and EMA89 are still pointing downward, confirming that sellers remain in control. The current structure suggests SOL may continue consolidating near the lower boundary of the wedge before a possible technical rebound.
However, from a fundamental perspective, the Solana ecosystem remains resilient. Capital inflows in DeFi and NFT sectors are stable, and trading volume stays above average — signs that investor interest is still strong. The $175 zone could be an attractive area to watch for price reactions. Once the broader market stabilizes, Solana is likely to be one of the first altcoins to recover.
What about you — what’s your outlook on SOLUSDT? 💬Share your thoughts in the comments below!

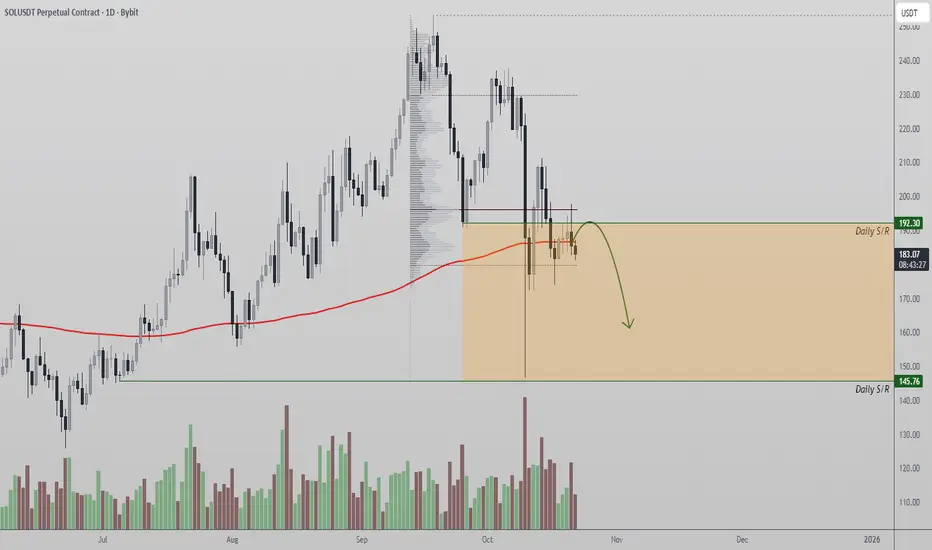
Solana Faces Strong Rejection at $192 ResistanceSolana price action is struggling to gain momentum above the $192 level, a critical zone packed with strong technical confluences. This region houses both the 200 Exponential Moving Average (EMA) and the Point of Control (POC), making it a decisive battleground for market participants.
The inability to reclaim this region suggests that bullish momentum remains limited in the short term. A rejection from this resistance could invite a deeper corrective phase, especially if buying pressure continues to fade near current levels.
Key Points:
- Major Resistance: $192, aligning with both the 200 EMA and POC, acting as a technical ceiling.
- Structural Weakness: Failure to reclaim this level limits upside continuation.
- Downside Target: Next high-timeframe support sits near $145, offering potential re-entry interest.
From a technical standpoint, Solana must close decisively above $192 to confirm strength and invalidate the current rejection bias. Until then, price remains vulnerable to a retracement toward lower liquidity zones.
What to Expect:
Expect further consolidation or minor pullbacks while below $192. A rejection from this region could accelerate a rotation toward $145, whereas a confirmed breakout would reestablish a bullish trajectory toward $210–$220.
SOL/USDT (3h timeframe)....SOL/USDT (3h timeframe), here’s what’s visible:
Im showing a symmetrical triangle breakout pattern.
The price has broken above the descending resistance line (around $198–$200).
My already marked two target points on the chart:
1. First Target Point ≈ $216
2. Second Target Point ≈ $236
So my price targets after the breakout are:
🎯 Target 1: $216
🎯 Target 2: $236
These targets align with the measured move from the height of the triangle (around $20–$30) added to the breakout level.
✅ Bonus tip: Watch for a retest of the breakout area (~$198–$200). If price holds above that and volume confirms, those targets remain valid.

SOL: One More High… or Goodbye?The Solana bull run that started in December 2022 most likely finished in January 2025. It was a textbook five-wave impulse (extended iii, with i ≈ v). From Jan → Apr 2025 we saw the first leg down (A), and the rally Apr → Sep was merely a corrective (B) move; base case is C down toward $80–50. An alternative allows for one more pop within B (even a small over-throw), but downside resumes after.
Full cycle & proportions
Dec ’22 → Jan ’25: clean 1–2–3–4–5.
Wave 3 shows a classic extension.
Waves 1 and 5 are nearly equal in length.
The run from the bottom is roughly 30–35× (about +3,000%), which statistically argues for a meaningful mid-term correction.
Base correction targets from the whole impulse: 0.382–0.5 Fib → $80–50, aligning with monthly/quarterly imbalances (FVG).
What 2025 looked like
Jan → Apr: first downward leg — wave A.
Apr → Sep 18 (high ~$253): a double zigzag W–X–Y — typical wave B, not a new trend.
Alternative (expanded flat, EFL)
A: Jan → Apr 7 down.
B: Apr → Sep as (A); now forming (B); then (C) up (a minor higher high is possible).
After that, a larger C down into $80–50.
Why I think the rally is done (market context)
TOTAL and BTC likely trace end-phase bull structures (distribution/terminal patterns).
Volume profile on COINBASE:SOLUSD : the heaviest trading sits around $120–200 (HVN/POC) — classic distribution; price often moves below POC afterwards.
Price Action (weekly/monthly): $216–260 is a major resistance that launched the bear market back in Nov 2021. Repeated tests without a weekly/monthly hold above it argue against an immediate breakout.
Fundamentals in two lines
Why a correction now: cycle overextension, liquidity saturation near the top, sensitivity to DXY/real yields and risk-off in US indices.
Why the long-term case survives: high throughput, latency improvements (e.g., Firedancer), growing DeFi/stablecoin/consumer activity. After leverage clears, BINANCE:SOLUSDT historically recovers with high beta.
Levels & invalidation
Base (correction) holds until we get a weekly close > $260–270.
Downside waypoints: $150 → $120 → $95 → $80–50.
Invalidation: sustained hold above $270 with expanding volume — I’d concede an early start of (3) without a deep (2).
Bottom line. With high probability, SOL’s medium-term rally is over; we are in a corrective phase targeting $80–50. The long-term bullish story can resume later — but first the market likely needs to deflate.

SOL ; What can be done?Hello friends
Given the decline we had, the price has been moving in an ascending channel for some time now, and now that the price is at the bottom of the channel and is on an important move, we can buy one step with risk and capital management, and in case of further correction, we can buy another two steps down and move with it to the specified targets.
*Trade safely with us*
SOLANA BUSSING n SETTING UP sol play : Get IN wif me : we going higher after this lil shake out : THANKS CZ N TRUMP:

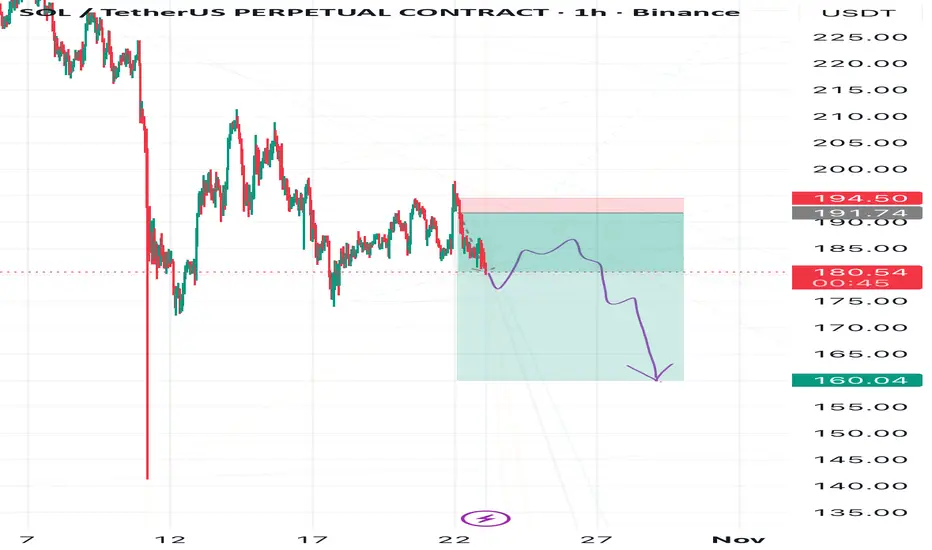
Don’t Trust the Twist — Solana’s Fall May PersistBe careful with Solana — the market might trick you into thinking a bullish reversal is forming.
In reality, the downtrend hasn’t finished yet.
A descending triangle is forming, and the breakout could be strongly to the downside.
🎯 Targets:
1️⃣ 164
2️⃣ 156
3️⃣ 138
❌ Invalidation: if price reaches the red zone marked on the chart
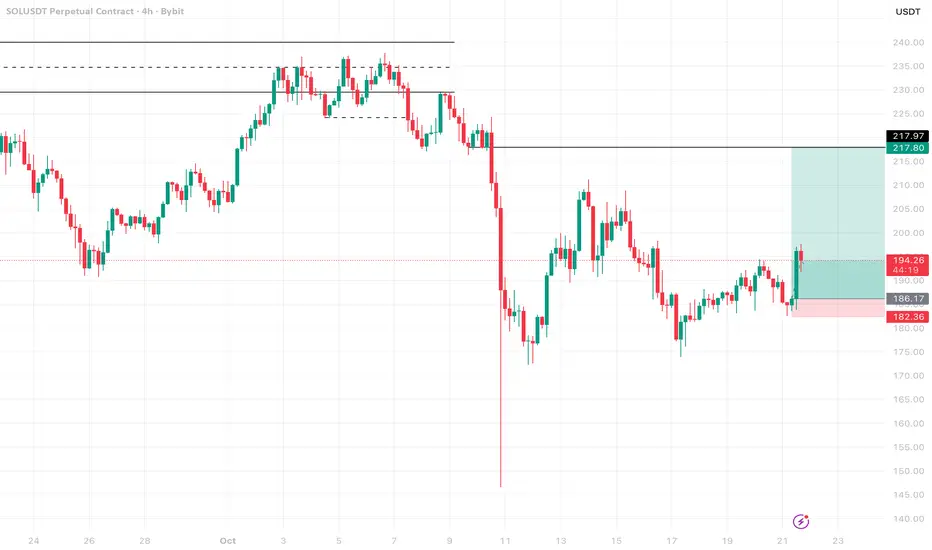
SOLUSDT – Bullish Trend Supported by Technical Structure and NewAfter a brief correction, SOLUSDT is showing strong signs of a continued upward movement. The ascending triangle pattern on the H4 chart indicates that SOL is building a solid base, with higher lows and testing the resistance at 200.00 USD. The price is currently above the EMA34, signaling strong buying momentum.
Notably, the price has recently broken through the important 200.00 USD resistance and is now approaching 216.00 USD. If SOL continues to hold above the 200 USD mark and confirms further upward movement, the next target would be 216 USD.
With positive news surrounding Solana and increased investment interest, SOL is likely to maintain its bullish momentum in the short term.
Strategy: Buy around 200.00 USD, target 216.00 USD, stop loss below 195.00 USD.
Summary: The short-term bullish trend remains strong, and SOLUSDT may reach the 216 USD target if it holds above the 200 USD support level.

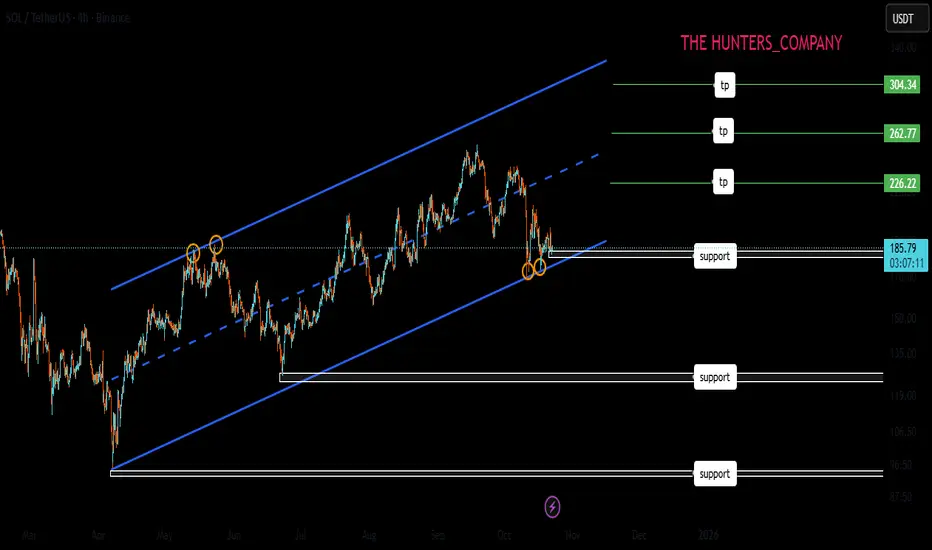
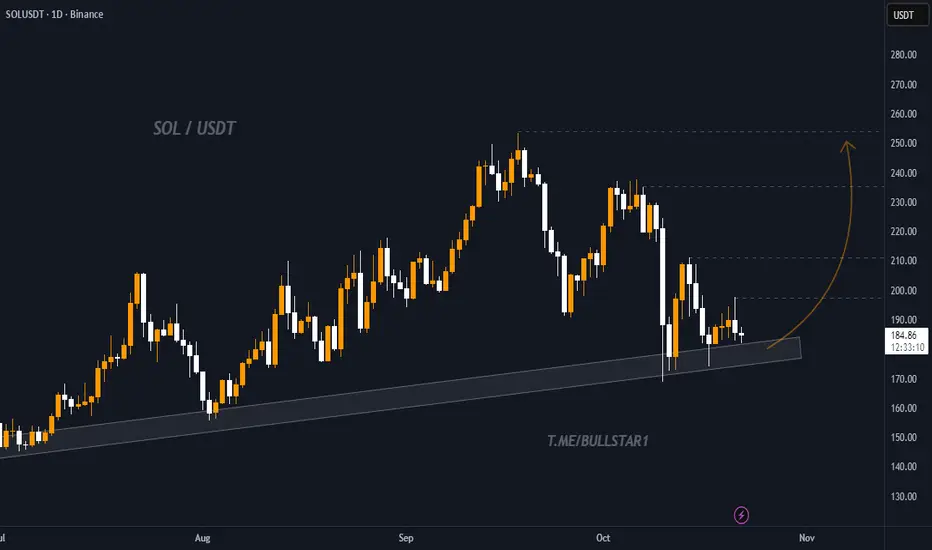
SOL / USDT – Retesting Key Trendline Support, Potential ReversalSolana (SOL) is currently retesting a strong ascending trendline that has held as support since mid-2024. The price recently bounced around the $175–$185 zone, which has acted as a major demand area multiple times in the past.
If the trendline holds, SOL could start a new upward move targeting:
- $210 – first resistance and short-term target
- $230 – medium-term resistance
- $250 – potential swing target
A daily close below the trendline or under $170 would invalidate the bullish scenario and open room for a deeper correction.
Overall, SOL remains in a long-term bullish structure as long as it stays above the trendline support.
$SOL - LONG - ABOUT TO POP?Analysis:
Following up on my Oct 14th BTC note — “Wait for arbitrage to balance spot markets” — we’re now nearing that blue box. As BTC approaches equilibrium, I’m eyeing CRYPTOCAP:SOL for a clean long setup.
Here’s why 👇
AVWAP Confluence Zone:
We’ve got the lower band of a HTF auction colliding with the VWAP line from another HTF auction — strong mean reversion and liquidity overlap. (Didn’t draw them out to keep the chart clean.)
Fibonacci Confluence:
A completed AB=CD right at 175.0, perfectly inside the HTF golden pocket (0.618). That’s a key structural retrace aligning with measured move completion.
Bullish Harmonic (4H):
A textbook bull harmonic forming — early signs of reversal pressure building.
No position yet. Waiting for SOL (CME) to close the gap at ~174.7 — that’s my trigger to go long.
🎯 Target: 223 — with a possible sweep of the 229–230 zone where shorts are stacked. Expecting a short squeeze flush through that region.
Seeing solid order flow confluence across the board.
Will update this post as things unfold.

Solana on the Edge: Will the Downtrend Continue?Solana has broken its key long-term uptrend, signaling increased selling pressure.
In the short term, the coin remains in a dynamic downtrend, and any minor rallies face resistance.
Indicators suggest the possibility of further correction; short-term traders should stay cautious and manage risk carefully.
Crypto markets move fast—always prioritize risk management.

SOL – Strength Isn’t Noise, It’s Signal.Most traders hesitate when price pulls back. I look for confirmation.
SOL held structure, reclaimed momentum, and showed real strength.
Break and retest ✅
Momentum shift ✅
Tight risk, strong upside ✅
I’m long — small risk, high reward.
This isn’t guessing, it’s execution.
Would you have caught this move or waited for someone else to call it?
SOL Long-Term View — Target $228SOL is maintaining a bullish structure with higher highs and higher lows.
📊 As long as key supports hold, the long-term target remains $228

Solana Resumes Uptrend After Bullish BreakoutSolana Resumes Uptrend After Bullish Breakout
SOLANA has come out of a strong consolidation that lasted almost 2 weeks.
The breakout looks strong and sustainable, indicating increasing bullish momentum.
If the markets in general do not face any strange manipulation during the FOMC meeting on Friday, then SOLANA could resume the uptrend in a clear way, as it is indicating.
I am looking at short-term targets near 210.70; 223 and 235.
You may find more details in the chart!
Thank you and Good Luck!
❤️PS: Please support with a like or comment if you find this analysis useful for your trading day❤️

SOL at Support, History Could Repeat$SOL/USDT Analysis
SOL continues to respect its long-term rising support line beautifully. Each time it has accumulated around this trendline, we’ve seen a strong rally follow, and the same pattern seems to be forming again.
Right now, SOL is in another accumulation phase, holding well above the key support zone. If history repeats itself and the price sustains this level, we could see another explosive move toward new highs.
DYOR, NFA
Thanks for reading! Appreciate your support and engagement 🙏

SOLANA - SHORT - THE WICK AND THE WHISPERTraders,
This is how I see SOL.
1. The level I care about
For me the key area is 205 to 207. Call it VAH, call it range high, call it supply. It is the place where price got stuffed before and where a lot of trapped memory lives.
What I expect is simple.
Wick it. Slip it. Fade it.
In other words I am looking for SOL to run into that 205 to 207 pocket, spike through it, clean the liquidity resting above those highs, and then fail to hold. That failure after the wick is the trigger for me. That is where I want to be heavy.
If SOL trades above that range high and then instantly falls back inside, that is a swing fail pattern at the high of the range. That is the same story I am hunting on BTC at 117.5k. Liquidity first, conviction second.
2. The downside path
If the wick and slip happens, my downside path is not small. My next meaningful target sits all the way down at 150 to 155. That zone is not just a guess.
It is where the last real demand block sat before we impulsed higher.
It is also where liquidity was never fully re balanced after the violent breakout.
Call it unfinished business. Call it imbalance that still needs to close.
The market eventually comes back to drink from the well it skipped.
3. Now we look under the hood
Price has pushed up into 200 again, yes. But the flow behind the move tells a different story than the candles.
Spot CVD
Spot CVD is bleeding down hard. Real buyers paying cash are not supporting this move. Spot is distributing into strength, not accumulating under it.
Stablecoin margined CVD
Stablecoin perp flow is also down. That means most of the USDT perp side is either taking profit into this move or outright selling into it. They are not chasing it. They are leaning against it.
Coin margined CVD
This is the biggest one. Coin margined CVD is aggressively down. That tells me coin collateral traders are smashing into the bid, basically leaning short into this push.
So ask yourself. If spot is selling, and perp flow is selling, and coin margined flow is selling, then why is SOL still pressing up
4. Open Interest is the answer
Stablecoin OI is grinding up.
Coin margined OI is going vertical.
That means positions are being added at the top, not closed. New size is entering into this level.
When coin margined OI spikes like that while coin margined CVD is negative, the usual read is this. People are opening fresh short exposure using SOL itself as collateral, hitting the bid all the way up, and still not getting the breakdown.
They are trying to fade the move. The move refuses to die. That is short fuel.
This is why SOL can still squeeze into 205 to 207. Shorts are stepping in early, and if you squeeze them one more time you get the wick.
But here is the catch. After the wick and slip, once that last round of shorts is blown and once fresh late longs FOMO in above VAH, there is nothing under price.
Spot buyers did not build a floor.
Perps did not build a floor.
The whole thing is hollow.
That is how you get air pockets.
5. How I am trading this
I am not here to wave a bull flag or scream bear. I am not interested in labels.
I am here to execute around the level.
My plan is to stalk shorts on a failed breakout of that 205 to 207 key. I do not need to nail the exact top tick. I want to see the wick into VAH, and then the rejection back inside the range. That is my trigger to build size.
Will I hold it all the way to 150 No blind loyalty. But that is where I believe the next true re balance sits, and that is the map I am working with.
If SOL breaks through 207, accepts above, and starts building structure above VAH, then this idea is invalid. I step aside. No ego. Survival first.
6. Summary
SOL is approaching a thin ceiling where liquidity sits. I believe we get a final run of that high near 205 to 207, a wick and slip, and then rotation lower. The flow supports that view.
Spot is not bidding.
Perps are selling into the move.
Open Interest is exploding at the highs.
That is the recipe for a squeeze candle into resistance, followed by a rug.
My destination if this plays out is 150 to 155, the next pool of imbalance where the market still owes a visit.
The chart is loud, but the flow is louder.
The candles brag.
The data whispers.
I listen to the whisper.

Solana (SOL): Waiting For Ideal Buy Entry | Could Bounce +30%Looking for a long on SOL coin with our most famous strategy—wait for a break of structure/retest/another break of structure.
More in-depth info is in the video—enjoy!
Swallow Academy

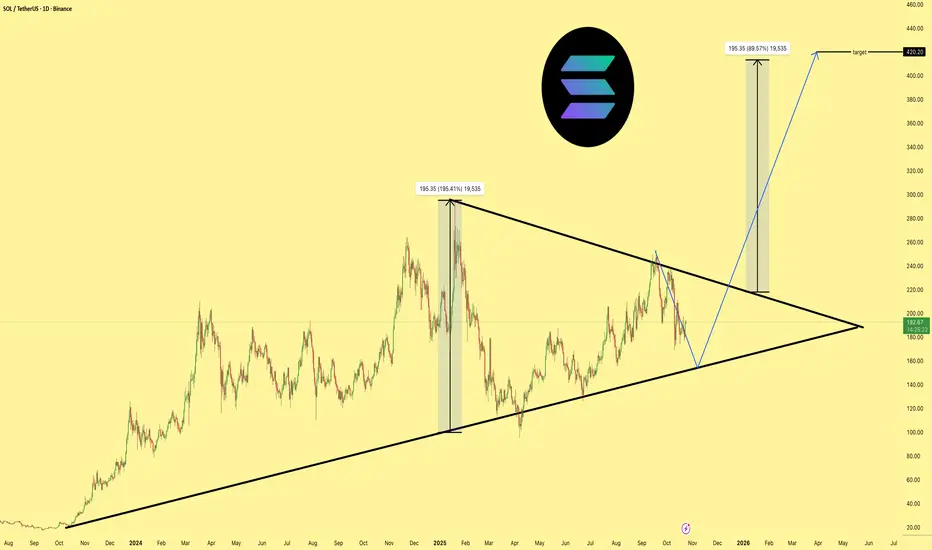
SOLCRYPTOCAP:SOL price action is tightening up with a solid base forming at support, looking strong each time it’s tested. This compression phase usually precedes a breakout. $420 remains the clear target and looks highly achievable within the next 200 days.

SOLCRYPTOCAP:SOL target remains $420, but there’s still room for a dip toward the $150 zone before the next leg up. Placing limit orders between $130–$160 is a smart move to DCA into your spot position. This strategy helps smooth out volatility and gives you a strong average entry.
SOLUSDT: Bullish Persist, Aims For $211 And Above ?Here is why..
SOLUSDT have been trending in a long upward channel for the past few months, as we can observe in the chart formation. the pair has repeatedly respected the higher lows region.
Currently the price is rising slowly, heading towards $211 which seems to be the next potential target. however it might extends its bullish move above the anticipated level, in regards to the trendline.
Follow up and share your thoughts on this..
Thanks for reading.
