SOLUSDT H2Hello
We can see the price chart of Solana that the price has been engulf the price of 133.5 and now we have determined an entry point in the retracement in the specified area.
SOLUSDT.P trade ideas

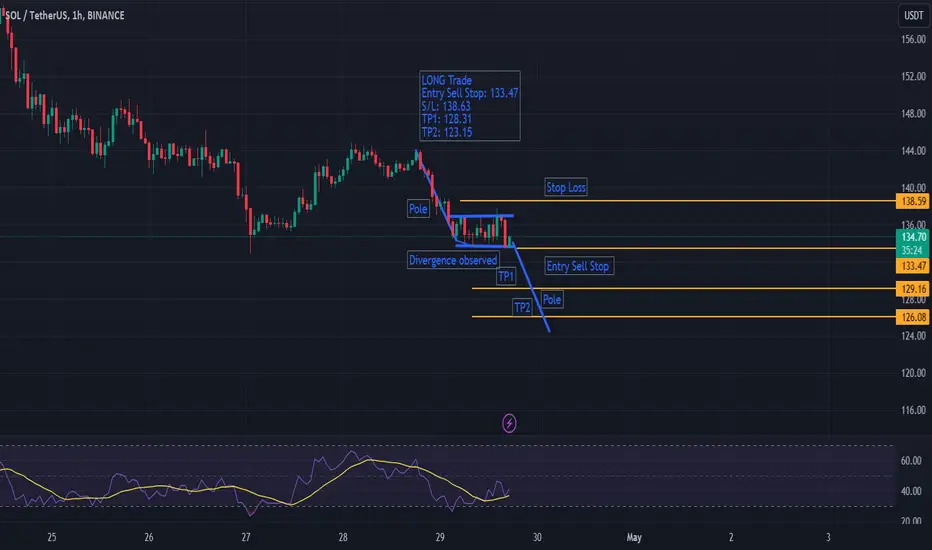
SOL/USDT - SHORT Trade Bearish Rectangle formingOn 1 H scale bearish trend is prevailing. Although market is sideways but is forming bearish Rectangle. One can also see it as bearish flag. Earlier divergence was observed but it was normalized (did not play). Therefore, bearish trend will continue.
Taking trade as mentioned on chart.
📉 SOL Trading Plan 🚀Observation:
SOL faced rejection at $160 and retraced to a supportive zone. Potential correlation with BTC's performance.
Trade Setup:
Entry: $126 - $140.
Take Profit: $160 - $170 or $200 - $220.
Stop Loss: Tight below $120 or BTC's $60,000 support loss.
🚨 Risk Management:
Trade is against BTC's downtrend on higher time frames.
Monitor BTC closely; any loss of support prompts trade exit.
📊 Strategy Rationale:
Anticipate SOL's recovery if BTC maintains $60,000 - $61,500 support.
Tight stop loss minimizes potential losses in uncertain market conditions.
📉🔍 Stay attentive to BTC's movements for trade adjustments! #SOLTrading #BTCAnalysis 📈🚀

SOL Need to bounce nowSolana entered a key zone. It need to bounce now, otherwise it will be hard. Price crossed below main trendline, and it's entering daily support zone. If this level will not hold ($133-126) we could probably see the price to be traded again around $100

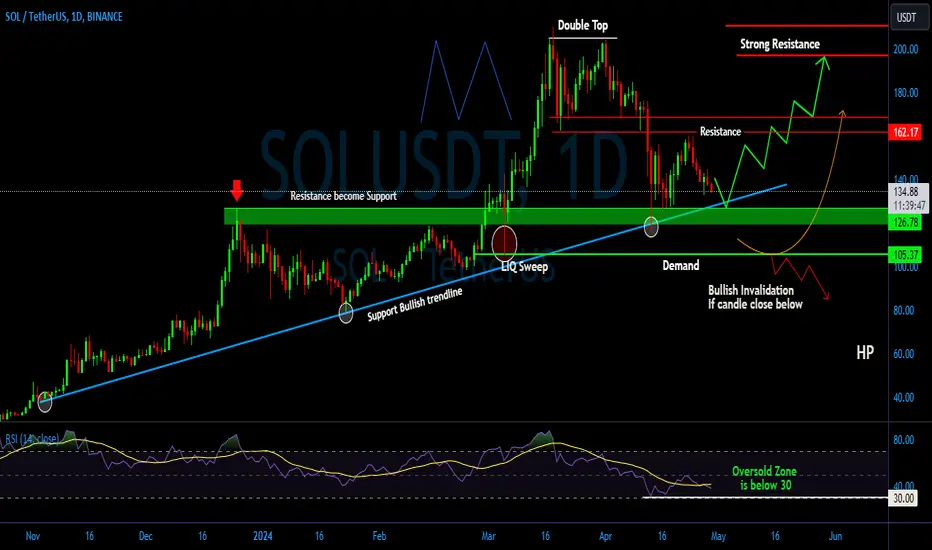
SOL/USDT It shows will be back test on the support trendline!💎 Paradisers, #SOL is indeed attracting attention as a coin worth keeping a close eye on.
💎 After facing rejection at the resistance area, SOL appears poised to retest the support zone around $127 - $116. This zone not only represents a local support but also coincides with a support trendline.
💎 A successful bounce from this area would signal bullish strength, potentially propelling the price upward to reattempt breaking the resistance around $162 - $169.
💎 If this resistance is breached with a successful bounce, it could pave the way for further upward movement, ultimately aiming for our target strong resistance area.
💎 However, should SOL fail to find support and instead break below the support area, it would raise concerns as it would not only invalidate the local support but also breach the bullish trendline support.
💎 In such a scenario, the price could descend towards the last bullish stronghold at the demand zone around $105. This could lead to SOL entering the oversold territory on the RSI indicator, typically below the 30 RSI mark. If SOL bounces from this oversold condition, attention would shift to reclaiming the $127 support area to resume the upward trajectory.
💎 However, if SOL breaks down below the demand area, it would confirm a bearish trend in the short term, signaling further potential downward movement.
MyCryptoParadise
iFeel the success🌴
SOL/USDT - LONG Trade CallOn 1 H scale divergence is observed on RSI. Therefore, trend reversal is expected. Wait till break of last LH and then take entry through Buy Stop. Put S/L at previous Lower Low. Keep Risk reward at 1:1 and 1:2 respectively. My trade prices are mentioned on the chart.

Solana/ USDT_ Under Binance Venue Trading_ X - Right Price. Solana/ USDT_ Under Binance Venue Trading_ X - Right Price.
We have some data we can calculate the mid prices. We will be using 26th, lower data of 27th, mid level of 27th and engineer them with 28th to get to 29th X - Right prices!
Next price:
$145.73
$146.74
$147.84
$148.12

SOLUSDT current Techenical Analysis Hi, SOLUSDT is currently on very critical point holding the trendline, If it breaks there will be a short time down trend in the price action. GOOD LUCK

ICT Short Setup Intraday SOLUSDTHello Traders,
Our AI system detected that there is an ICT short setup in SOLUSDT as scalping,
Please refer to the details Stop loss, Supply Zone(Sell Zone), TP 1 and TP2 for take profit.
For more ideas, you are welcome to visit our profile in tradingview.
Have a good day!
Please give this post a like if you like this kind of simple idea, your feedback will bring our signal to next better level, thanks for support!

SOLUSDT IDEA#SOLUSDT
UPDATE
The Descending Channel Formation In 12H Timeframe✅
Incase Of Successful Breakout Expecting Massive Bullish Wave In Coming Days✍️

SOLUSDT IDEAHello Traders Hope You Are Enjoying Our Analysis. Today We Will Discuss About SOL
(Update)
The Descending Channel Formation In 12H Timeframe✅
Incase Of Successful Breakout Expecting Massive Bullish Wave In Coming Days✍️

#SOL/USDT looks promising on the daily chart, with $300 as a pot#SOL/USDT looks promising on the daily chart, with $300 as a potential target✈️
Entry opportunities: current levels or after a clean bounce🔺
Bullish targets: $159, $175, $200, $250, and $300🎯

Solana Breakout - $250+ IncomingIf we see a pattern repetition, we can clearly make out that Solana is about to fly, and fly high. The similar pattern happened previously which resulted in up to 140% increase in price. And this time, I think it will be roughly 89% Gain from the current price.

SOLANA - $600 on the Cards?👀📉Hi Traders, Investors and Speculators of Charts📈
Solana has made some great increases, and it's retraced back to support levels. I've been bullish on Solana since the beginning of 2024, when SOL was still sub $100. Take a look here at other altcoins that we've been watching:
By looking at the Drop-and-Pop fractal we've been watching, we can conclude that for the short term, the support zones should hold at $140, with wicks as low as $120. When incorporating this into Elliot Wave Theory, our next impulse up (wave 4-5) should take us to roughly $290.
But it doesn't end there. When we zoom out, and view the chart from a macro perspective, we see a different structure of Elliot waves... We're possibly still in wave 0-1! And if we use the same Elliot wave ratios to calculate wave 5, (% of wave 1 OR 161.8 x wave 1 length) then wave 4-5 takes us even beyond $600.
It's important to note though, that this is a multi-month and potentially multi-year target. Although SOL has previously increased 500% in a few weeks, the markets are more mature than they were in early days with many more adopters and institutional investors joining the game.
If you found this content helpful, please remember to hit like and subscribe and never miss a moment in the markets.
_______________________
📢Follow us here on TradingView for daily updates📢
👍Hit like & Follow 👍
CryptoCheck
COINBASE:SOLUSDT BINANCE:SOLUSDT

SOLUSDT LONG PROJECTION ✅You snooze you lose, checking my past analysis on SOLUSDT you'd notice how I ate the market.. is time for SOLUSDT to go long, we have the BOS, price has filled Imbalance and we expect price now to go long. Don't forget to check for CHOCH on The 15MTF..no confirmation,no entry.

SOLUSDT 1HInterval ChartHello everyone, let's look at the 1H SOL to USDT chart, as we can see the price has entered a sideways movement and is breaking sideways from the local downtrend line.
Let's start by setting goals for the near future that we can include:
T1 = $154
T2 = $162
T3 = $168
AND
T4 = $175
Now let's move on to the stop-loss in case of further market declines:
SL1 = $142
SL2 = $137
SL3 = $130
AND
SL4 = $112 - $105
When we look at the RSI indicator, we will see that we are bouncing off the downward trend line, but we can see that the lateral price movement results in an increase in the indicator, which may again translate into an attempt to drop the price.

📊#SOL will rise according to the double bottom structure📈🧠We entered the correction phase after completing the cup and handle structure goal. The double top short goal has been fully achieved, and we once again obtained good support after returning to the buy zone, and successfully constructed a double bottom structure near the buy zone. There is a high probability that we will use this structure as a supporting force to continue to rise.🚀🌕
⚠️Don’t forget risk management💯
✔️Trade safe✔️
🤜If you like my analysis, please like 💖and share it💬
💕 Follow me so you don't miss out on any signals and analyze 💯

SOLUSDTBINANCE:SOLUSDT is all set.
We've got strong support at the 0.618 Fibonacci level.
Looking back at the Fibonacci extension from the start of the first wave in early 2021 and the correction down to $19.21, we can see a crucial support zone that NYSE:SOL has consistently held.
In my view, this marks the start of a new upward trend for NYSE:SOL , suggesting potential upward momentum and bullish opportunities for SOL in the near future

📈 SOL Trading Analysis 🚀Support & Resistance Strategy:
SOL has retraced to a support level, suggesting a potential bounce. Anticipate movement towards upper resistance levels.
Trade Setup:
Entry: $140 at current support.
Take Profit: $160-$170 or $200-$220.
Stop Loss: Just below $135.
Market Observation:
Recent market activity shows a range-bound pattern.
If SOL struggles to breach the next resistance, consider exiting to secure profits.
📊🔍 Stay alert for SOL's movements! #SOLTrading #CryptoAnalysis 💰📈

My Advise is not invest in Sol Right nowIn my Previous analysis, i told you that the sol has entered in the sell zone and it might fall from here,
Now #sol Is moving into downtrend, it has made a fakeout and had got rejected from the Resistance.
The short term plan Im seeing #solana Near 100$, I would advice not enter in sol here for now.
Well Do your own Research.
Looking for a partnership work, Dm Directly.

SOL Solana Technical analysis and Trade IdeaSOL has broken structure to the downside. Do we see a retrace and then further bearush price action? In the video we take a close look at a couple of possibilities. Info is educational in nature and not financial advice.

SOLUSDT ReversalSOLUSDT has formed an inverse head and shoulder pattern along with the presence of divergence signal, which indicates a trend reversal.

$solana longCRYPTOCAP:BTC has found support at 62800, i expect alts to recover here , invalidations are clear .
