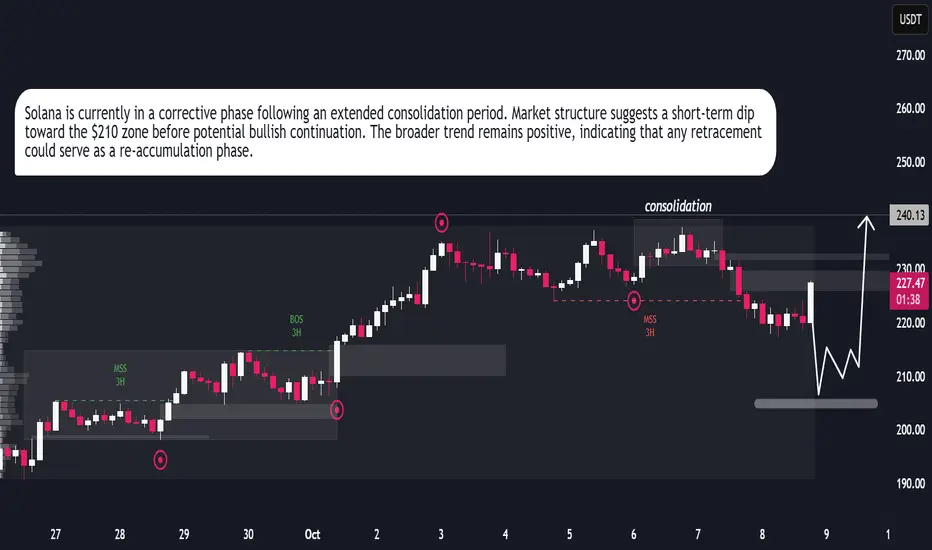
SOLANA SOLUSDTSolana (SOL) ETF PENDING
There is widespread optimism that the U.S. Securities and Exchange Commission (SEC) will approve a spot Solana ETF in 2025. Multiple filings from major firms like VanEck, Fidelity, Grayscale, Canary, and Franklin Templeton are under review.
Analysts put the approval odds high ,anticipating billions in new institutional inflows that could boost SOL’s price significantly to over 500$
The REX-Osprey Solana Staking ETF (SSK) launched in July 2025 has shown strong investor interest, demonstrating early institutional appetite.
However, progress has been delayed due to the partial U.S. government shutdown starting October 1, 2025. The SEC has halted many normal functions, including ETF approvals, causing uncertainty and delaying final decisions.
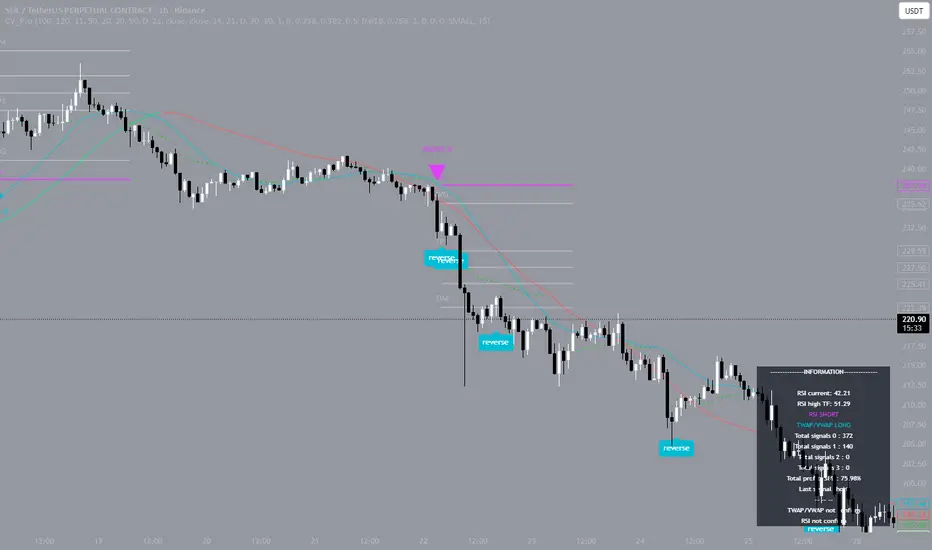
Reasons for the Drop This Week FROM 214.62 after the break of the neckline of the double top structure on daily time frame and on the retest we sell
key support will be the daily pivotal and psychological support floor at 86.86-84$ zone
US Government Shutdown Impact:
The ongoing partial US government shutdown since October 1, 2025, has caused delays in regulatory decisions, including ETF approvals that many expect to boost Solana. This uncertainty hit investor sentiment and liquidity.
Broader Crypto Market Volatility:
General weakness in the cryptocurrency market amid geopolitical tensions, US-China trade conflicts, and macroeconomic uncertainty have pressured crypto prices, including SOL.
Profit Taking After Recent Rallies:
After significant gains approaching the yearly highs, some investors took profits, leading to sell-offs and price corrections.
ETF Approval Delay:
The anticipation of a Solana spot ETF approval has fueled recent rallies. With delays caused by regulatory pauses, the momentum stalled, feeding into the price drop.
Analysts expect approval likely once the government reopens and regulatory processes resume.
#sol #solusdt #crypto #btc #ethusdt
Trade ideas

$Solana $250+ or DOWN 216?In our recent post, we perfectly predicted the touch of 250 and 190.
Price has now reversed off the supply zone and is making its way back up, lets see what the potential out come for the next two weeks are!
Solana (SOL/USDT) 1H Chart Analysis
Current Price: ~$232
Trend : Price is was inside a clear ascending channel, respecting support and resistance lines - however has now breached resistance.
Key Levels
Support Zones:
$225 → Psychological support + 4H FVG.
$216 → Deeper 4H FVG and strong volume node. ( + 4 Hour Fib GP )
$200 → Major psychological level + prior supply zone flip.
Resistance Zones:
$250 → Psychological resistance + demand zone.
$275 → Next major resistance if $250 breaks.
Bullish Scenario
If SOL holds above $225 and consolidates within the trend channel, price could retest $250.
Break and close above $250 may extend rally toward $275.
Bearish Scenario
Failure to hold $225 could drag SOL to the $216 FVG or even $208.
A breakdown of $208 increases risk of revisiting $200.
Summary
Market structure remains bullish as long as price respects the rising trendline.
$225 is the key short-term pivot: holding above favors $250+, losing it opens downside risk toward $216–200.
Let me know what you think!

Posted Solusdt for yall check my recent post When I posted SOL some said it won't happen that crypto if going up
And here we are
I'm entering the weekend with mad profit and if you took the trade when I posted it
Congratulations🩷💥💥💯

SOL - PERFECT PLAY.#SOL - MEDIUM TERM OUTLOOK - ON POINT 🔥📉
7.5% dump since this update.
Zooming on my macro time frame view, this could be the final dump before to see a huge move upward! 📈
(valid if 196 - 198$) act as key support.
Level by level.
Local support: 205 - 206$. (expecting some bull reaction soon, likely before the next dump?).
Also Keep an eye on the daily uptrend. 👀

SOL | Network Strength Meets Market MomentumSolana (SOLUSDT) continues to show resilience as both technical and fundamental factors align for potential upside. On the technical side, the market has completed a controlled correction phase, suggesting liquidity buildup below recent lows. The structure remains bullish, with increasing volume and price stability hinting that buyers are regaining control. Fundamentally, Solana’s network growth and strong developer activity have reinforced investor confidence, supported by rising on-chain activity and ecosystem expansion in DeFi and NFTs. This combination of solid fundamentals and technical structure indicates the possibility of another bullish leg, with SOL positioning itself for a gradual climb toward the $240–$250 range in the near term.
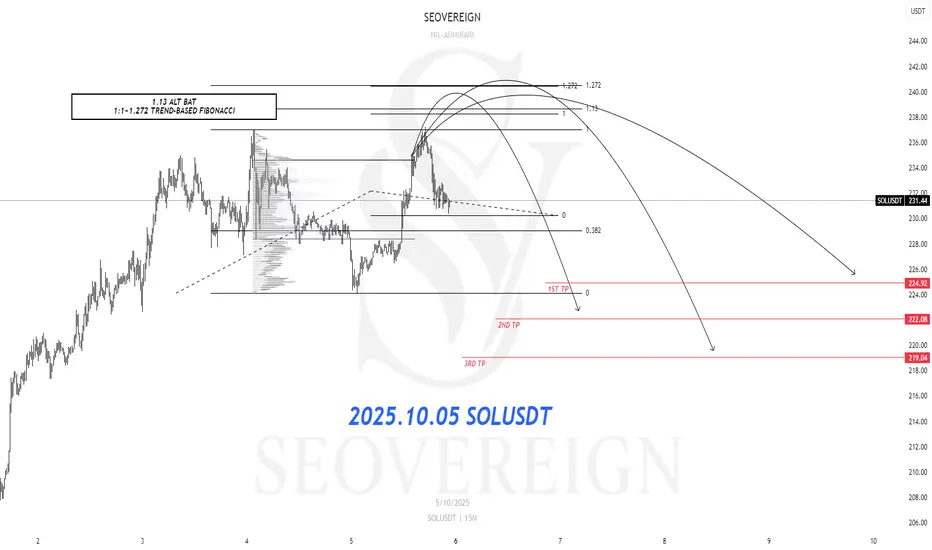
[SeoVereign] SOLANA BEARISH Outlook – October 05, 2025Hello everyone.
I hope you are all having a peaceful day.
Today, I am writing to share my short position perspective on Solana as of October 5th.
The first basis is the 1.13 Alternate Bat (ALT BAT). The Alternate Bat is a variation of the harmonic pattern established by Scott Carney, and its core principle lies in defining the PRZ (Potential Reversal Zone) where point D is located at 1.13 times the XA leg (=1.13XA). The convergence of these ratios creates a relatively narrow and reliable retracement (or reversal) zone, so when D is positioned around 1.13XA, it is necessary to carefully observe the potential for a short- or mid-term reversal.
The second basis is that an arbitrary wave N forms a 1:1 length ratio with another arbitrary wave M. Among Fibonacci ratios, 1:1 is one of the representative standards used in Elliott Wave and harmonic analyses for measuring wave length and retracement. When one wave exhibits approximately a 1:1 length with another, that point tends to act as a natural retracement or termination zone, and the reliability increases especially when it overlaps with other technical grounds.
Accordingly, the average target price is set around 222 USDT.
As the chart movement unfolds, I will provide updates on position management through revisions to this idea.
Thank you for reading.
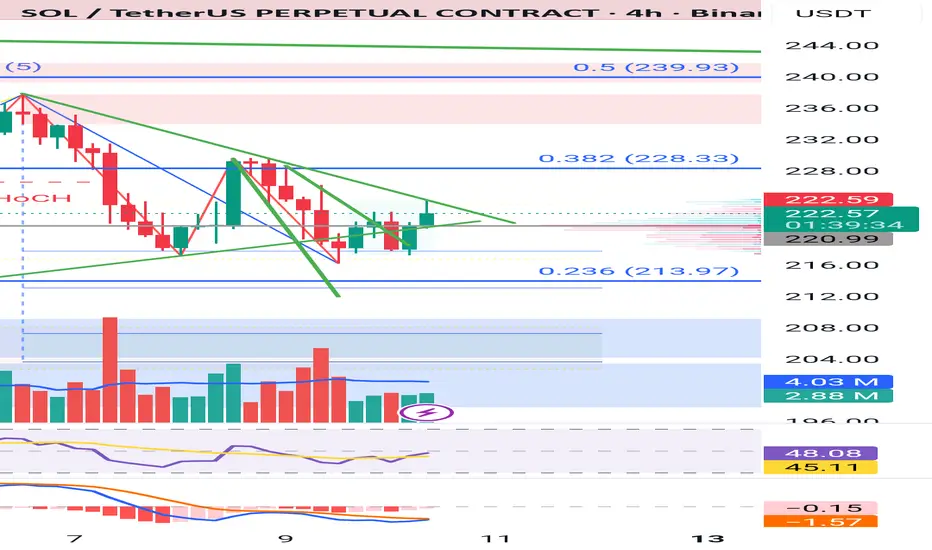
The trend is your friend until it isn't! Looking at the 4 hr chart, we're still looking bearish while we're under that trendline. Lets see how the next 2 hrs play out. There's liquidity around 215 and 230. Im leaning to a short to around 215, there's a nice FVG that should be filled bf it goes back up. If this reverses at the trend line or it taps 230 ill try shorting. What are your guys thoughts? Id love some input 👍😁
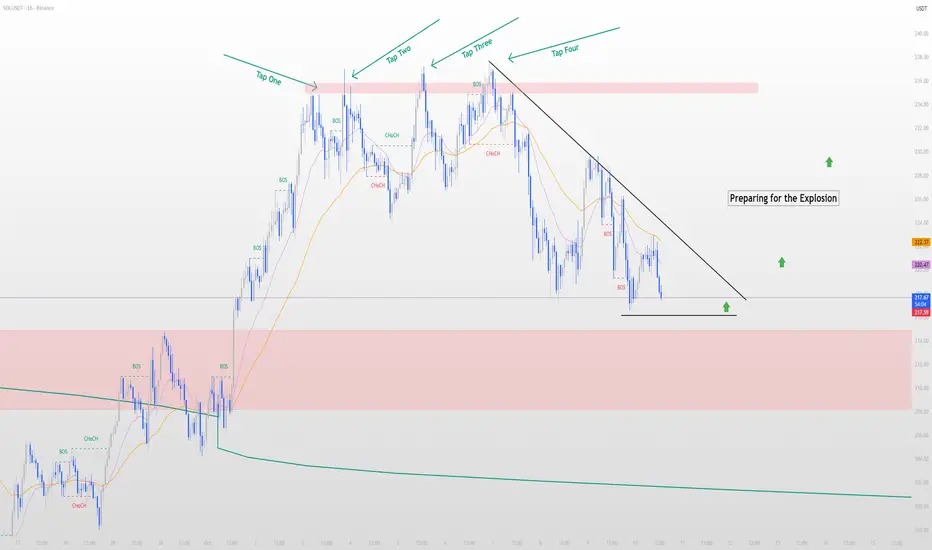
SOLANA (SOL/USDT) – Preparing for the ExplosionSOLANA (SOL/USDT) – Preparing for the Explosion 💥
Solana is gearing up for a major breakout.
It has tapped the resistance line four times, showing strong testing pressure on the upper trendline — and has now pulled back for a healthy correction.
The structure has formed a perfect symmetrical triangle, indicating strong accumulation before the next explosive move. When momentum builds, a decisive breakout above resistance is highly likely — potentially setting the stage for a new all-time high.
This setup is independent of Bitcoin’s current price movement.
Many BTC holders have already taken profits — and if liquidity flows into SOL, we could see the momentum intensify dramatically.
I also have other technical tools that support this idea, but everyone is free to use their own preferred tools for confirmation.
📈 Key idea: Solana is preparing for the explosion — the compression before expansion.
SELLS*)Market Structure-MSS
*)POI/Key Level- Supply
*)Quasimodo(QM)
Note: the market is all about probabilities which also makes my analysis a probability.

SOLUSDT LONG TRADE TO ATHSuper Bullish on SOL.
This gem is going to renew ATH very soon.
Now is a good point of entrance for Long position.
DYOR.

SOLANA LONGSOLUSDT is approaching a strong demand zone around 216–217 where previous liquidity sweep and accumulation took place. CVD and OI suggest short exhaustion, and funding rates have normalized, indicating a potential shift in momentum.
Long setup targeting 237 zone, with confirmation on bullish structure break and sustained volume recovery.
Entry: cmp
dca : 216 to 217
Target: 237
Stop-loss: Below 215
Bounce from 215 area before the run!So from what I can see based on liquidity heatmaps and market sentiment right now. Looks to me that we'll pull back to around 215 or so then run hopefully with tomorrow's ETF approval and rate cuts at the end of the month.
coinank.com

DeGRAM | SOLUSD is holding the support zone📊 Technical Analysis
● SOL/USD is consolidating above the dynamic support near $220 after rebounding from the lower channel line, signaling potential continuation toward $248 resistance.
● Price action shows higher lows and tightening structure, indicating accumulation within a bullish continuation pattern. Holding above $220 keeps momentum intact for an upward breakout.
💡 Fundamental Analysis
● SOL benefits from rising DeFi activity and growing adoption of Solana-based projects, while investor sentiment strengthens amid broader altcoin recovery.
✨ Summary
● Long bias above $220; targets $248. Consolidation supports bullish continuation amid improving market sentiment.
-------------------
Share your opinion in the comments and support the idea with a like. Thanks for your support!

SOL-USDTThere was a pullback to the $226 level 🔽
If the trend line is broken, the correction could continue to the two green supports
The main and important support is around $200

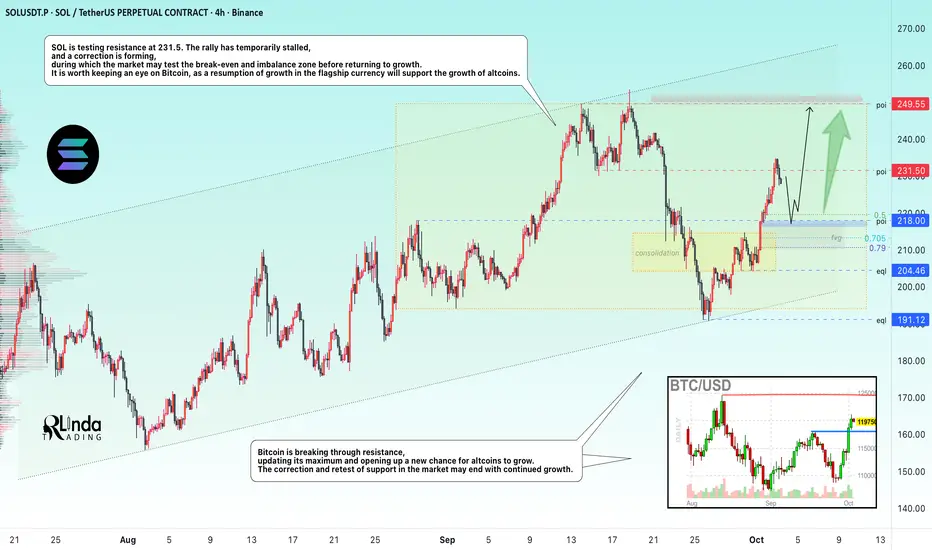
SOLANA → Retracement for consolidation before growth to 250.0BINANCE:SOLUSDT bounces off trend support, forms a reversal pattern, and enters a distribution phase, during which it updates its maximum but encounters strong resistance. What's next?
Bitcoin breaks through resistance, updating its maximum and opening up a new chance for growth for altcoins. Correction and retesting of support in the market may end with continued growth.
SOL is testing resistance at 231.5. The rally has temporarily stalled, and a correction is forming, during which the market may test the break-even and imbalance zone before returning to growth. It is worth keeping an eye on Bitcoin, as a resumption of growth by the flagship will support the growth of altcoins.
Resistance levels: 231.5, 235, 250
Support levels: 218, 205
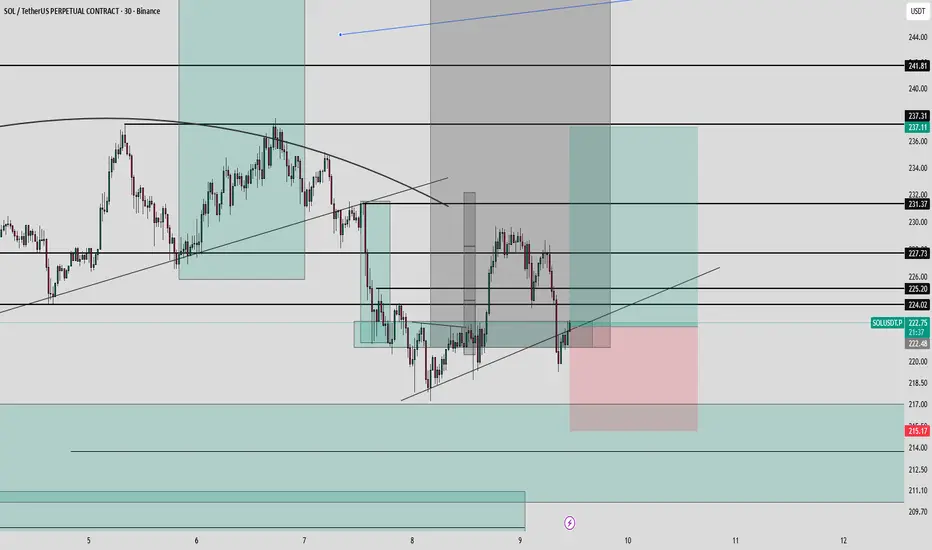
A false breakout of 231.5 is provoking a pullback. It is necessary to monitor the further halt in price. I expect a retest of 220-218 before the price returns to growth.
Sincerely, R. Linda!
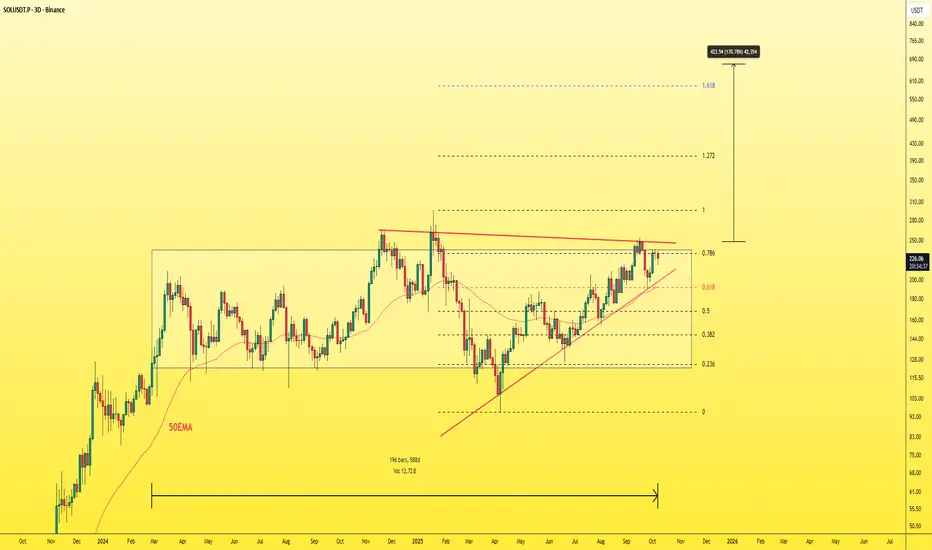
SOLUSDT - Smart Investment!If you missed the Ethereum rally, don’t miss Solana’s.
The 3-day chart looks insanely bullish — the coin has been consolidating for 588 days, almost 20 months.
Right now, it’s forming a massive triangle pattern with a minimum target of $650.
Trust me, you don’t need to put your money into crazy coins and risk losing it.
You’ve got SOL — with a strong chart and a solid market cap.
Forget those who say high market cap coins don’t move much.
Look at BNB, ETH, and BTC — they’ve all had massive runs and hit new all-time highs. It’s a much safer and smarter investment than chasing random volatile tokens.
Best Regards:
Ceciliones🎯
BUY AND HOLDHello friends
Due to Solana's ATH and the Solana network becoming wider every day, big money is entering this currency, and considering the pullback we made, it is a good opportunity to enter with risk capital management and buy in steps in the specified areas.
Note that the holding period is at least 3 months, so be patient and observe capital management.
*Trade safely with us*

SOL Bull RunPrice finds support at 0.38 fib after bullish move to 230.
This retracement following the impulse move and support at that key fib point is a hall mark of bullish up trends.
I think this is the beginning of the SOL bull run . All bets are long

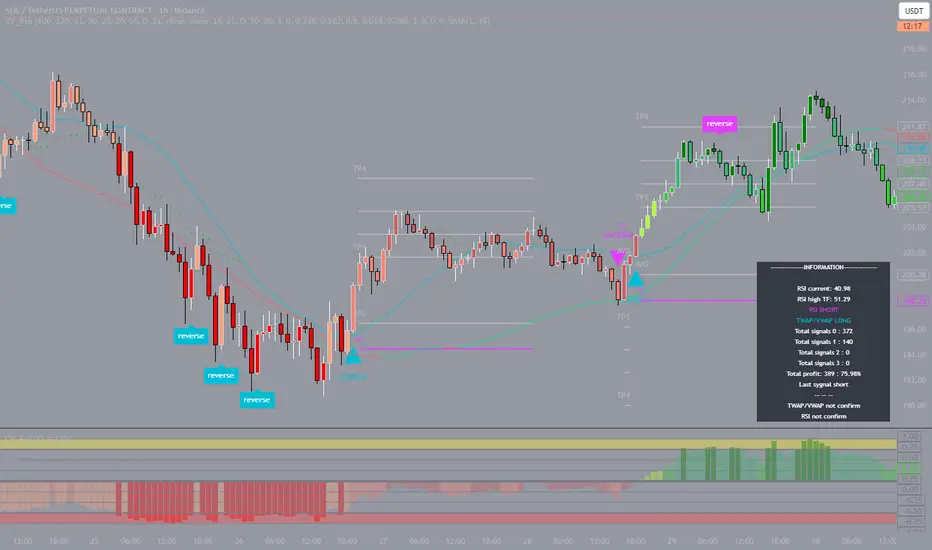
SOL: level by levelOn Sept 26, 1H SOL, I entered long at 199.37. Price hit all four targets: 201.73, 203.33, 205.26, 207.87 and eventually printed a peak at 237.68. Watching it run further stings, but that’s no reason to break the plan. Traded with 10x leverage: level map, scenarios, risk control — all in place.
My strategy keeps SOL’s 1H win rate above 85% — it’s about consistency, not guessing.
Yes, the move from 199.37 to 237.68 teases that fear of missing out. But when structure leads you through levels, emotions fade. I end up with repeatability over randomness: planned entry, calm management, level-based exits. Next setup — same rules.
We do not enter trades against the trend, even if we receive a clear signal to do so.
SOL: move down from $232On September 22, Solana turned into a clear downtrend on the 1H timeframe, starting from the $232.12 area. Price sequentially passed all four take-profit levels: $229.68, $227.66, $225.50, and $222.52, then printed a low at $190.78. The move offered over $40 per coin in potential, amplified by careful use of 5x leverage.
The trade was managed step by step: levels were mapped in advance, “take/hold” scenarios were defined, and decisions followed market structure. This removes haste and emotions—leaving only plan execution.
Observation: the win rate on SOL in the current market regime on 1H is notably above average - thanks to trend filtering and risk management. It’s not about guessing; it’s about math: volatility becomes measurable metrics, and metrics translate into consistent actions.
When discipline and structure are built into the process, trading stops being chaotic. Results become a function of consistency, not luck.
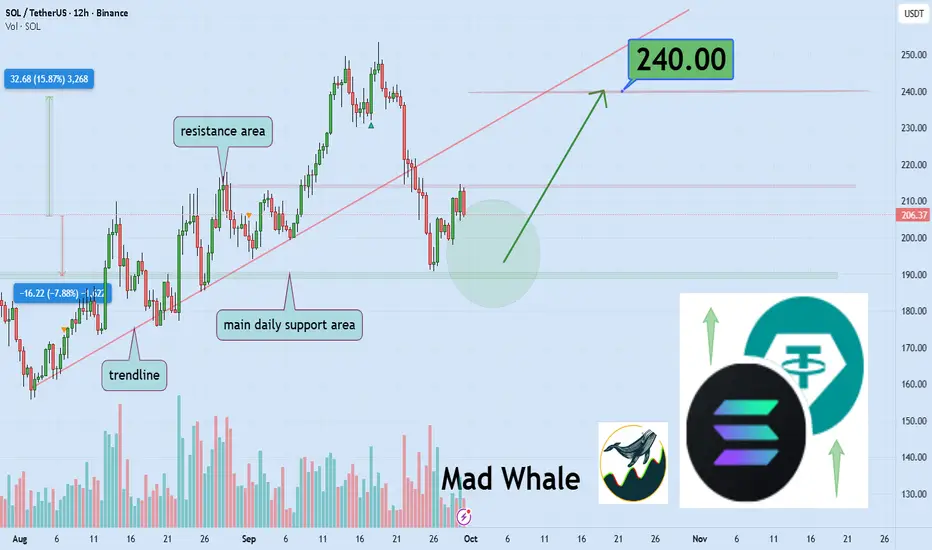
Solana Tests Key Support Could Jump 15% Target 240$Hello✌️
Let’s analyze Solana’s price action both technically and fundamentally 📈.
🔍Fundamental analysis:
Nine firms just filed for Solana (SOL) ETFs, and the SEC is fast-tracking reviews till mid-October.
Analysts expect up to $1.8B inflows in Q4, using ETH ETF history as a guide.
If approval comes, SOL could attract big institutions.🚀📊
📊Technical analysis:
BINANCE:SOLUSDT is testing a key daily support; holding this zone could spark a 15% rally, targeting $240. 📈🛡️
📈Using My Analysis to Open Your Position:
You can use my fundamental and technical insights along with the chart. The red and green arrows on the left help you set entry, take-profit, and stop-loss levels, serving as clear signals for your trades.⚡️ Also, please review the TradingView disclaimer carefully.🛡
✨We put love into every post!
Your support inspires us 💛 Drop a comment we’d love to hear from you! Thanks, Mad Whale
Solana (SOL): Price Still In Bullish Momentum SOL has been holding strong within the ascending channel we’ve been tracking. Buyers are still reacting well to each trendline touch, keeping the overall structure bullish.
We’re now watching for either a clean breakout continuation or a retest toward $200–205 before another push higher. As long as the EMAs hold and the structure stays intact, our major target at $280 remains on the table.
Patience is key—buyers still have momentum here.
Swallow Academy

SOL Chaser?🧩 Every candle is another clue in the ever-changing puzzle.
🔥 CRYPTOCAP:SOL continues to ride hot narratives—first memecoins, now tokenized stocks. Momentum never sleeps.
💵 SOL/USD:
Flipped key resistance into support.
March 2024 ATH at $210 now acting as a floor, with a retest on the horizon.
Current resistance sits near $228.
📌 Game Plan:
No adds yet. Waiting for that $200–$195 demand zone, a cluster of swing highs, swing lows, and weekly closes. That’s where the real decision point lies.
🚨 Until then, patience. The next big move will be built on these levels.
