DeGRAM |SOLUSD will test the support level📊 Technical Analysis
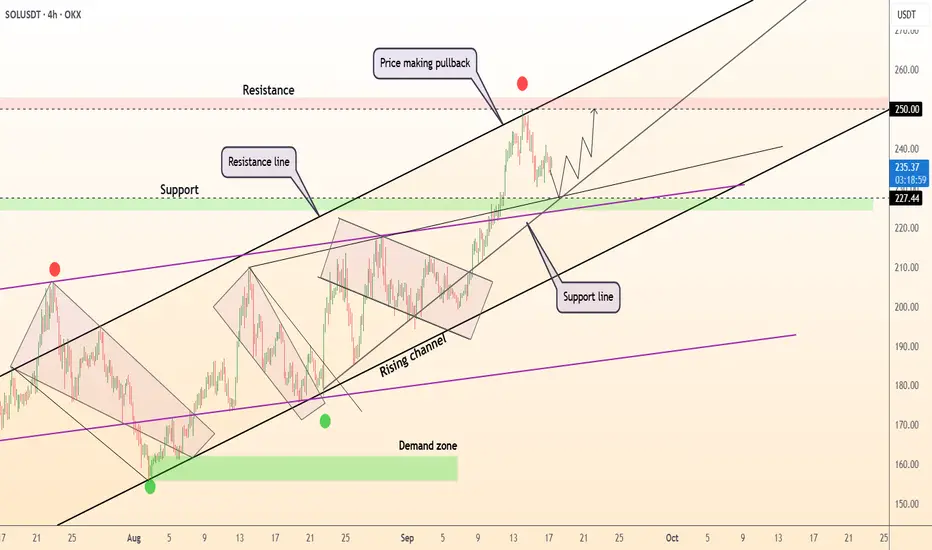
● SOL/USD is trading inside a rising channel, with price pulling back toward 227 support after rejecting 250 resistance.
● Structure shows continuation potential, with higher lows along the support line keeping momentum intact and targeting a retest of 250 if buyers hold.
💡 Fundamental Analysis
● Solana’s ecosystem strength is supported by growing NFT volumes and DeFi activity, while recent whale inflows highlight institutional interest in altcoins.
✨ Summary
Bullish above 227; targets 240 → 250. Invalidation on a close below 227.
-------------------
Share your opinion in the comments and support the idea with like. Thanks for your support!
Trade ideas
SOL ShortsPrice rejected cleanly from the weekly rejection block at 249–252 and is now failing to hold minor intraday structure. The selloff broke lower, and every retest into 246 → 249 is now acting as supply.
The next liquidity pool sits at 242.6, and if that level gives way, the clean draw is the imbalance resting at 230.1. The market already showed willingness to reject the weekly block, so until that zone is reclaimed, bias remains lower toward these liquidity levels.
Why this happens:
• WRB rejection capped the rally.
• Intraday mitigation blocks forming lower highs.
• Liquidity magnets below at 242.6
The chart is showing displacement + mitigation → continuation lower.

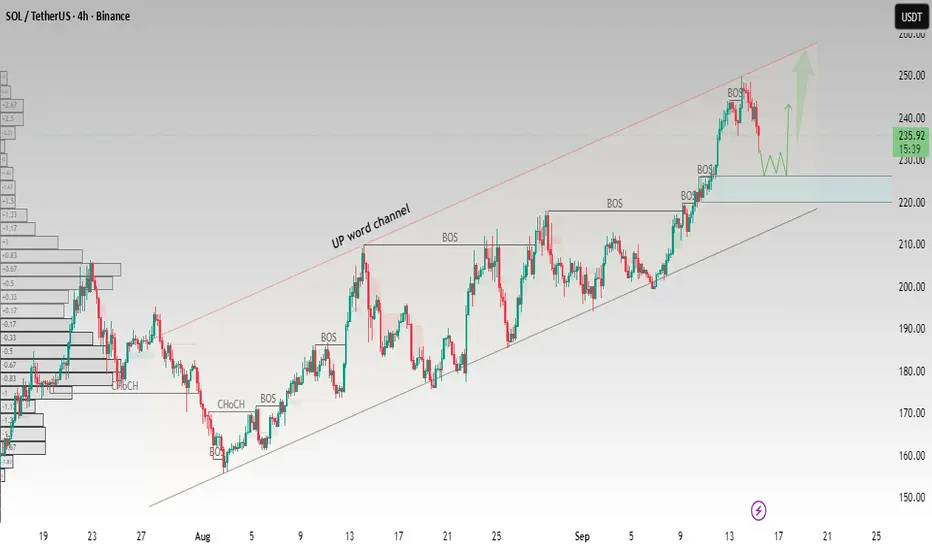
SOL/USDT – Testing Support Within Upward ChannelSOL is moving inside a clear upward channel on the 4H timeframe. After multiple Breaks of Structure (BOS), the price is now pulling back from the upper channel resistance.
Key zone to watch: $225 – $230 support area. If buyers defend this level, SOL could bounce and retest the $245 – $250 zone at the channel top.
Price holding below $225 may signal deeper retracement toward the lower boundary of the channel.
This setup highlights how structure, BOS levels, and channel dynamics can guide potential trade decisions.
Educational purpose only. Not financial advice
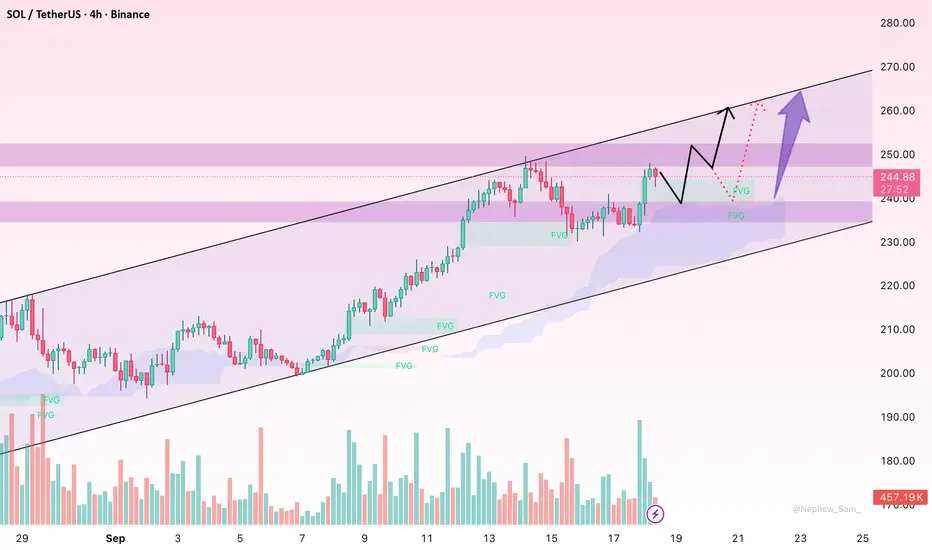
SOL/USDT: Keep Rising or Time for a Correction?Hello everyone, recently SOL/USDT has seen a strong upward movement, and now it’s at a quite sensitive price zone. The big question now is: will the uptrend continue, or is the market due for a correction before pushing further?
On the chart, SOL is still holding above the Ichimoku cloud, a sign that the bullish trend is intact. The Fair Value Gaps (FVG) formed during the rise could act as "stepping stones" of support, providing opportunities for price to bounce when it comes down to retest. The volume spike on September 17th also shows real market participation, indicating that this is not just a “fake breakout.” The 240 USD zone is currently an important support level— as long as the price stays above here, the chances of reaching 250 USD, or even 260 USD, are quite high.
Recent news also supports SOL. The crypto market, in general, is benefiting from new funds pouring in from large institutions, and Solana is no exception. The Solana development team also released updates that improve speed and reduce transaction fees, which certainly strengthens confidence in the project. Additionally, the Fed maintaining stable monetary policy creates a favorable environment for risk assets, including altcoins.
I still lean towards a continuation of the uptrend, as long as SOL doesn’t break below 240 USD. If it holds, the next target is 250 USD, and potentially even 260 USD. However, traders should also prepare for a potential correction to avoid being caught off guard.
What about you? Do you think SOL will hit 260 USD soon, or does the market need a breather before going higher? Share your views!
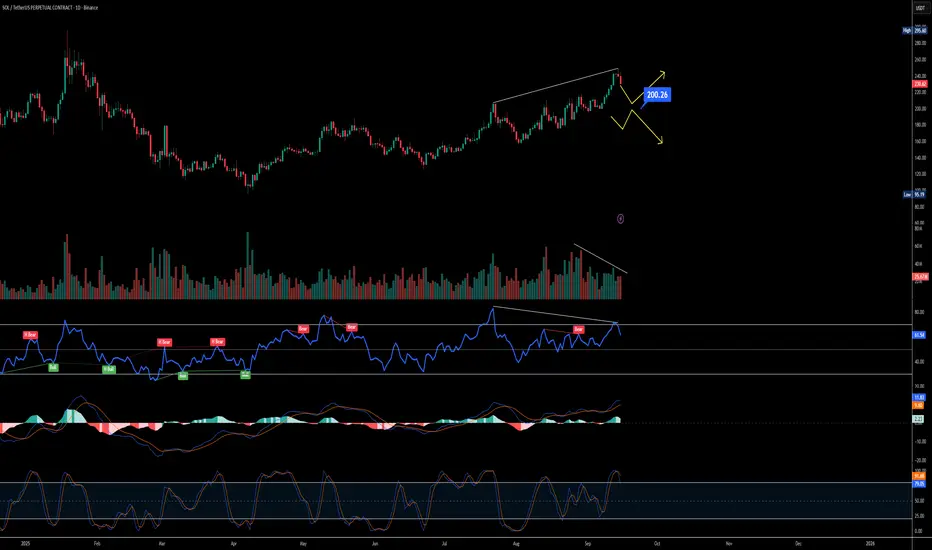
Solbat pattern on the SOL/USDT 4H and 1D charts appears solid , based on the visible trendlines and labeled points (A, B, C, D) connecting the swings. The structure aligns with a classic bearish bat harmonic pattern: it starts with an initial downmove (X to A, potentially from the higher swing around 260+ implied by the chart scale), retraces upward to B (around the 0.382-0.50 Fib of XA, near the 220-231 zone based on the horizontal lines), extends to C (0.886-0.886 Fib retrace of AB, fitting the lower color lines around 210-220), and projects to D (the PRZ at 0.886 Fib extension of XA, The ascending trendlines from X-A and B-C, plus the converging resistance (color lines), give it a clean, non-overlapping look without deviation. On the 1D timeframe, it scales up well, reinforcing the pattern across higher timeframes for confluence. Minor nitpick: The volume labels (e.g., 0.69, 0.79) and some wicks might slightly offset exact Fib precision, but it's visually coherent and not over-drawn.Yes, this setup looks valid for a short position if confirmed at the PRZ (D point). Recent analyses confirm SOL forming a bearish bat around these levels in mid-September 2025, with the pattern signaling exhaustion after the rally from 220 lows. Current price (248 USDT as of Sept 18) is hovering just below the C-D leg, and the overall structure suggests reversal potential at D, especially with neutral-to-bearish oscillators (RSI ~55-60, MACD flattening) and resistance clustering at 250-255. Key invalidation would be a clean break above 260 but if it respects the bat's 88.6% extension, target downside to 230 (38.2% Fib of XD), 220 (50%), and 200 (61.8%)—aligning with broader support zones.
Risk: High volatility in perps, so use tight stops.
For DCA entries into the short as price touches 253 (ideal PRZ rejection zone), focus on scaling in on pullbacks or confirmations within the leg up from current levels.
Aim for 3-4 entries to average ~
248-252 average entry,
with 25-30% position size per layer. Best spots:Entry 1: 250 USDT (First resistance test; —
enter 25% if rejection candle forms, e.g., shooting star or doji with volume spike).
Entry 2: -253-257
USDT (Core PRZ; add 30% on bearish divergence or breakdown below 251 hourly—watch for failure at the converging trendlines).
Stop loss, Breakout and close above 259
Tp
246
243
238
232

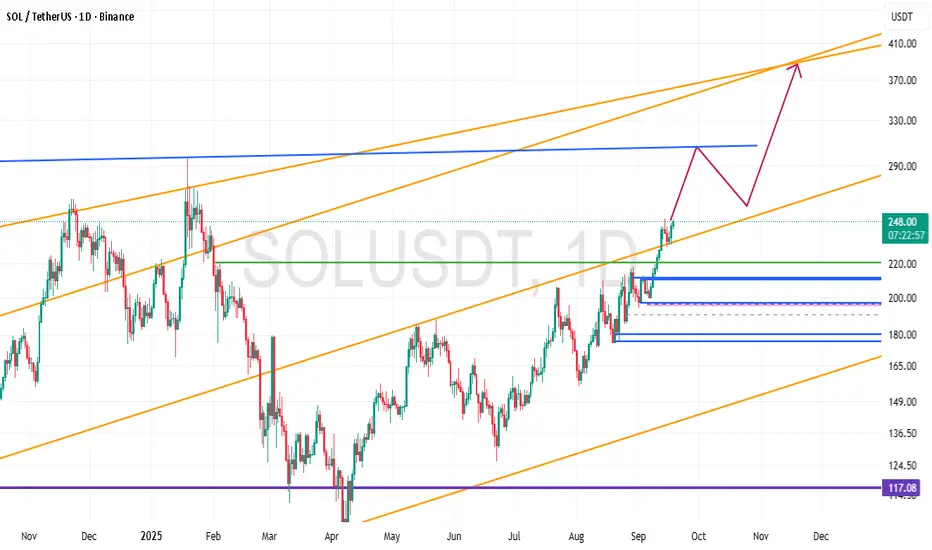
Technical Analysis Report: Solana (SOL/USDT)Current Price: ~$248
Solana is currently trading within a bullish ascending channel on the daily timeframe. The overall mid-term trend remains positive, supported by higher highs and higher lows.
🔑 Key Levels
Support Zones:
$220 → psychological support and trendline retest
$200 → major structural support (critical level)
$180 → strong support in case of a deeper correction
Resistance Zones:
$290 → short-term resistance and potential rejection area
$370 → upper boundary of the channel and main bullish target
📈 Possible Scenario
Price may extend its rally toward $290.
A corrective pullback to the $250–260 range could follow.
If momentum holds, the next bullish target lies around $370 at the channel top.
⚠️ Risk Notes
As long as SOL holds above $200, the bullish trend remains intact.
Losing the $200 support could trigger a decline toward $180.
Risk management and stop-loss placement are essential due to possible short-term volatility.
📌 Summary
Solana maintains a bullish outlook while trading inside its ascending channel. The medium-term upside targets stand at $290 and $370, with key supports at $220–200. Short-term corrections are possible, but the overall structure favors further upside as long as $200 holds.
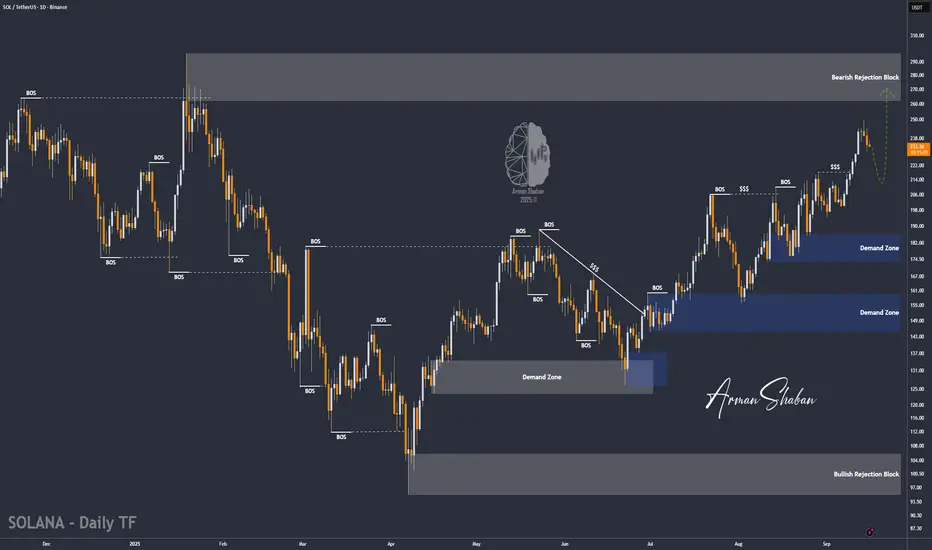
SOL/USDT | Solana Correction Over? Big Rally Loading Soon!By analyzing the Solana chart on the daily timeframe, we can see that after a correction, the price is now trading around $234. In the short term, I expect a small pullback, followed by another strong bullish move from this coin.
The key demand zone is between $210–$220, while the possible upside targets are $250, $260, and $296.
Please support me with your likes and comments to motivate me to share more analysis with you and share your opinion about the possible trend of this chart with me !
Best Regards , Arman Shaban
Long trade
4Hr TF overview
Trade Journal Entry
Pair: SOLUSDT (Perpetual Mix Contract)
Type: Buyside trade
Date: Sunday 6th July 2025
Session: NY Session AM (00:00 am)
Timeframe: 4H
Trade Parameters
Entry: 147.797
Profit Level (TP): 289.421 (+95.82%)
Stop Level (SL): 145.025 (-1.88%)
Risk–Reward (RR): 51.09
Narrative
Market structure confirmed a macro bullish reversal, with price breaking above previous bearish ranges. Entry taken at discounted accumulation zone around 147.80, just above higher timeframe demand. Stop Loss is placed just beneath the structural low at 145.02 to protect against invalidation. Target projected into premium pricing at 289.42 — aligning with historical resistance & Fibonacci extension levels.
RR extremely favourable (51:1), reflecting asymmetric reward potential.
Trade captured continuation of NY session momentum, backed by strong volume inflows.
Mapping SOLUSDT since July 2025, and thought to share at this point for the community.

SOLANA LONGFed rate cut finally came in as expected with more on the way going forward.
All the 401k money is about to flood in to the market and most people are betting on Solana.
Ascending triangle breakout fully complete. Going long from here
Minimum price target from here is 480-500 zone .
SL below 185

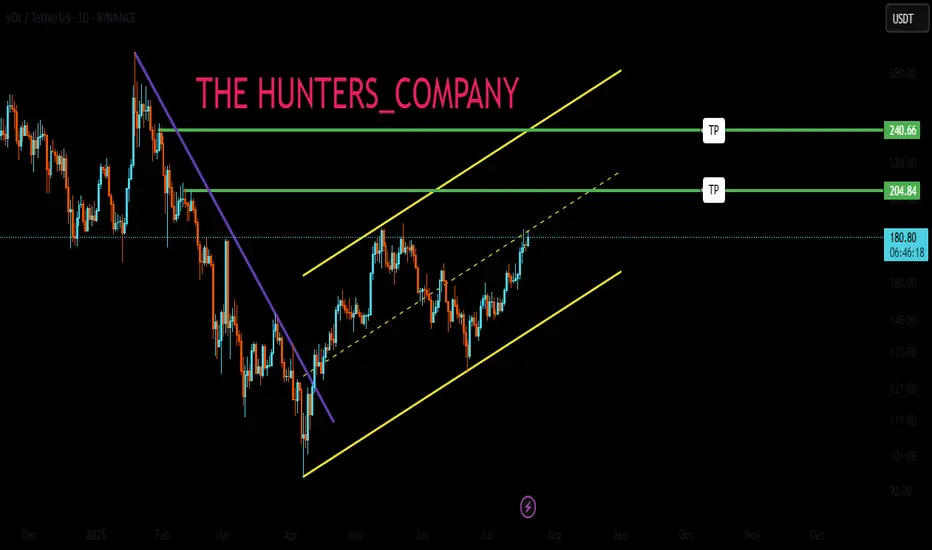
SOL – Bulls Holding the Channel!SOL has been overall bullish, trading inside a clean ascending channel. Price broke above the $215 – $220 structure zone and pushed higher, but is now pulling back for a retest.
This zone is key 🔑 . It aligns with channel support, making it a strong confluence for buyers to step in. If bulls defend it, momentum could continue, and SOL may push toward higher levels inside the channel 🚀.
If the zone fails, a deeper correction could follow before another attempt from the bulls. Until then, the bias remains bullish as long as structure holds.
What do you think — will the bulls 🐂 step in and send SOL flying again, or will bears take over for a deeper pullback? 🤔
⚠️ Disclaimer: This is not financial advice. Always do your own research and manage risk properly.
📚 Stick to your trading plan regarding entries, risk, and management.
Good luck! 🍀
All Strategies Are Good; If Managed Properly!
~Richard Nasr

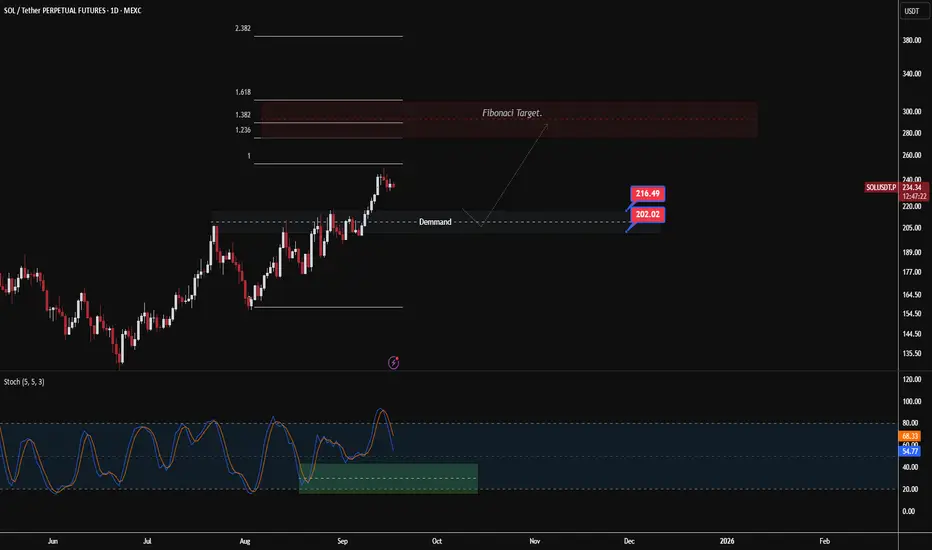
SOL/USDT – Daily OutlookSolana continues to trade within a bullish structure after breaking above key resistance. Momentum indicators suggest short-term exhaustion, opening room for a potential retracement.
The nearest demand zone lies between $216 – $202, which could serve as a re-entry area if price corrects lower. As long as this zone holds, the medium-term outlook remains bullish.
Fibonacci projections point towards $280 – $300 (1.236 – 1.618 extension) as the next upside targets, aligning with a potential strong resistance area.
In summary, while a short-term pullback is possible, the broader trend remains bullish with clear demand support below and Fibonacci targets above.
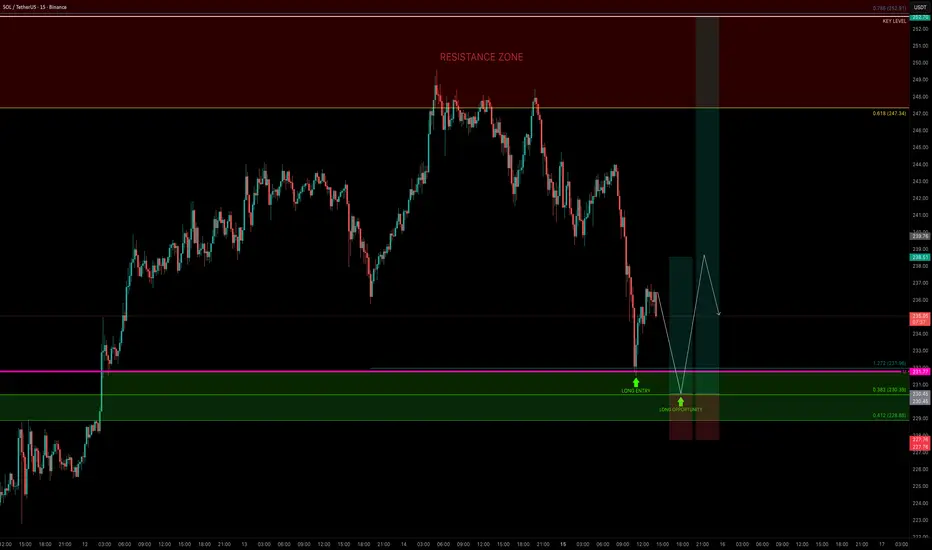
SOL — Bulls Need to Defend $230 for ContinuationSOL had a strong bullish week, almost tapping the $250 psychological level before rejecting down into the monthly level at $231.77, where price found support and bounced. This level also aligned with the 1.272 Fib extension ($231.96), making it a valid long opportunity.
🟢 Next Long Opportunity
The 0.382 Fib retracement ($230.39) of the move from the $199.32 low is the next key level to watch.
A retest here would:
Sweep liquidity from the current low
Offer a low-risk entry
Help fill some imbalances
📌 Overall, $230 is the level that must hold for bullish continuation.
Targets
TP1: $238 → R:R ~1:3
TP2: $252.91 (0.786 Fib retracement) → R:R ~1:8+ if momentum continues
Risk Management
Stop-Loss: Below $229 (clear invalidation)
Risk: Only 1% on this trade setup
Quick Take
If $230 holds, SOL could set up for another leg higher. This zone offers a clean, low-risk, high-reward long setup with clearly defined invalidation and attractive targets.
SOL There is No time to Give up! Change your life now!The initial target is to break 255 then 295-300 to break the all time high, then it will immediately fly to 420 - 450, here will start crazy volatility until 600 and above, then retail will enliven the Sol market, the price you need to be aware of is the price above 1000 - 1300 USD, because it is possible to get there, but volatility will be very fast, therefore the target price that we need to secure is around 600-800, for me I will aim for 630-730 from what I have analyzed.
Notes:
FED CUT RATES
SOLANA FIREDANCER
SEEKR
SOLANA ETF EARLY OCTOBER
PEACE WORLD UKRAINE_RUSSIA
FOMC CUT RATES TIL 1%
thank you and good luck

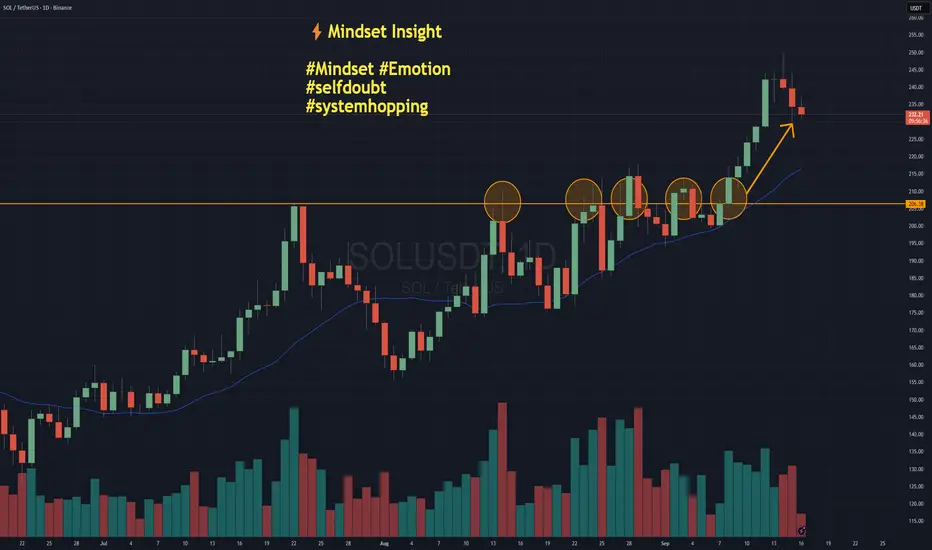
System Hopping - The Hidden Cost of Self-DoubtNOTE – This is a post on Mindset and emotion. It is NOT a Trade idea or strategy designed to make you money. If anything, I’m taking the time here to post as an effort to help you preserve your capital, energy and will so that you are able to execute your own trading system as best you can from a place of calm, patience and confidence.
Here’s a scenario:
You take a loss.
Then another.
Suddenly, the system you trusted yesterday feels broken today.
On this chart of Solana, imagine you were trading a breakout system. You may have had four false breaks that didn’t really follow through before the market finally broke higher. When do you give up on the idea or the system altogether?
How self-doubt shows up:
You start thinking: “Maybe another system would have worked better…”
You switch, tweak, reinvent mid-cycle.
You lose patience with the method you worked so hard to design.
You are in danger of system hopping.
Emotional side:
Self-doubt often disguises itself as “rational analysis,” but underneath it’s uncertainty, frustration, even a tightening in the chest. You hesitate to pull the trigger, second-guess your plan, or overcorrect with a brand-new approach.
It’s rarely your system that’s broken.
It’s the lack of trust in yourself to see it through.
Shift your mindset
Every system has drawdowns. If you abandon yours too soon, you never let it prove itself. So the task really is to find a way to collect the data without blowing out / over extending yourself.
Practical tips … the How:
Write down your system rules and keep them visible, so you trade what’s planned, not what you feel.
Track results over a proper sample size (50–100 trades) before judging performance.
Make sure you are position sizing sensibly. This is an art in and of itself. The key being - do not risk what you can not afford on any one trade / series of trades. Paper trade if you need to to start with just to collect the data on the system.
Journal emotions separately from trade outcomes — so you see when doubt is about you, not the system.
Set a “no system changes” rule during drawdowns. Only review at scheduled intervals.
Closing thought:
Your edge doesn’t come from finding the perfect system.
It comes from trusting a good one long enough to let it work.
Solana: Selling Pressure Hits 6-Month High as SOL Price Nears $2Currently, Solana trades at $235, sitting just 6% below the $250 milestone. Over the weekend, SOL attempted to reach this target but failed. However, it has managed to hold steady above the $232 support level.
If bullish momentum continues, Solana could rebound from $232 and test resistance at $242. A successful breach, particularly if long-term holders slow their selling. This could push SOL toward reclaiming $250 in the near term.
However, if selling pressure from long-term holders accelerates, Solana may struggle to defend $232 as support. This scenario could result in a correction toward $221, undermining bullish momentum and invalidating near-term upward projections.

SOL – Demand zoneIncredible run on that last leg up, fueled by DAT buying.
We took some HTF internal liquidity, now I'm looking for price to bleed back into the demand zone marked on the chart.
Another scenario is that we might get another push up first, but it looks like that could trigger some more sellers to step in so I'll be patient for the demand block.
Ultimately, new highs are not out of the question I think.
$Sol Daily Bearish Divergence with Key Supports at $220Solana is flashing some important signals across multiple timeframes right now.
On the daily chart, a clear bearish divergence has formed while buying volume is steadily declining. This setup usually points toward a healthy correction phase. At the moment, SOL looks like it could slide toward the $225–$220 zone, where we might see the first reaction.
If SOL manages to hold above $200 support, this pullback could simply turn into a higher low, setting the stage for continuation upward. But here’s the caution: losing $200 means breaking the last structural support, which could flip the trend and open the doors for a new lower low — potentially triggering a much larger dump.
👉 In short: Watch the $225–$220 range for short-term correction targets. Keep a close eye on the $200 level, because that’s the line between a healthy pullback and a bearish breakdown.
Trade safe and don’t chase candles — let the levels confirm the story.
SOL The Whales are Selling at This Strong Resistance Level 230$SOL Current Market Update
The coin is now facing a very strong resistance around $230 .
This presents a great short opportunity .
After carefully monitoring buy and sell orders on-chain, I noticed a strong confirmation for the short setup:
Whales and Market Makers sell orders are clustered heavily around the $228 – $230 resistance zone.
✅ My Personal Strategy:
Short Entry: Resistance zone between $228 – $230
🎯 Target 1: $220
🎯 Target 2: $216
Please note:
This is not financial advice – I’m only sharing my personal trades.
Always do your own research before taking action.
👍 Don’t forget to like if you found this useful, and feel free to follow me for more analysis of this kind.
Best of luck 🌹

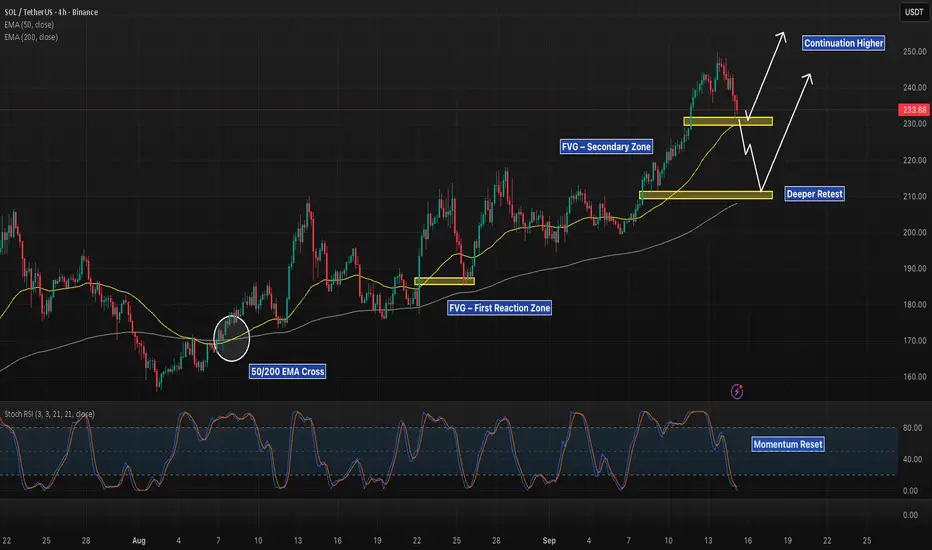
SOL 4H – FVG Reaction at 230 or Deeper Fill to 210?Solana’s trend remains bullish following the August 50/200 EMA cross, but price has pulled into a key FVG at 230. This first zone aligns with the 50 EMA, making it an important test for continuation.
FVG 230 Zone: Holding here could trigger a bounce toward 250+.
FVG 210 Zone: A deeper fill into this gap, confluenced with the 200 EMA, still keeps the broader structure intact.
Stoch RSI: Resetting at oversold, suggesting potential upside momentum if support confirms.
The next move depends on whether buyers defend the 230 FVG or allow price to dig into the 210 gap before continuation.
SOL SHORT TERM SHORT : 200 USD FIRST BEFORE WE RESUMESOL Price hit expected target between 245-250 area.
Looks like short term reversal of price is underway as traders take profits.
Next area of interest for bulls is $200 support.

SOLANA UPDATEHello friends🙌
📉Given the decline we had, you can see that buyers came in and supported the price and were able to change the trend and create an ascending channel.
📈Now, considering that the price is hitting higher ceilings and floors, we can expect an ascending wave until the ceiling of the channel.
Don't forget risk and capital management.⚠
🔥Follow us for more signals🔥
*Trade safely with us*
Up or down?Hello friends
Well, considering the growth we had, the analysis of which we have already given you and it was full target, now we needed to go for another update.
Well, considering the price growth, there is an important resistance area on our way that they have determined for us.
If this resistance is validly broken, the price can move to the specified targets, but what if the price cannot break the resistance?
Well, don't worry, we have another scenario where if the price fails to break the resistance and falls, we have identified good support areas that if reached, the price can grow well to the set targets. Finally, it must be said that given the large number of buyers and the buying pressure we have in Solana, sooner or later, I think this resistance will be broken and we will see higher numbers.
*Trade safely with us*

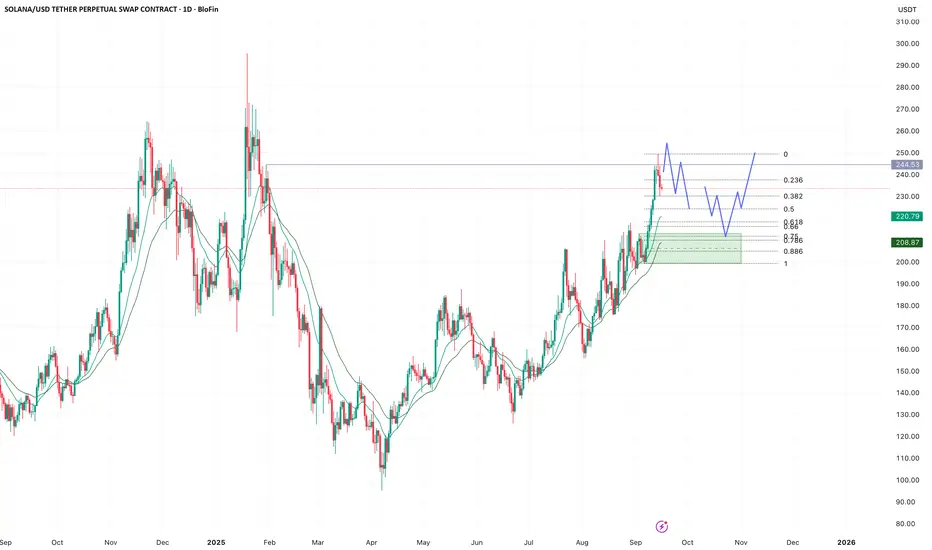
$SOL Skyrockets to 240: Catch the Bull Run! BINANCE:SOLUSDT
CRYPTOCAP:SOL Skyrockets to 240: Catch the Bull Run!
Entry Level: Marked at 1 (240.00 USDT), suggesting a potential buy point near the current price.
Take Profit (TP) Levels:TP1: 0.786 (228.33 USDT)
TP2: 0.618 (219.17 USDT)
TP3: 0.5 (212.73 USDT)
TP4: 0.185 (185.46 USDT)
Stop Loss (SL): Set at -1.272 (254.84 USDT), indicating a level to exit if the price moves against the trade.
Dead Cat Bounce (DCB): Marked at -1.135 (247.36 USDT), possibly indicating a minor reversal point.
RSI (Relative Strength Index)Current RSI: Around 80.93, which is in the overbought territory (above 70), suggesting the asset may be overvalued and could be due for a pullback or consolidation.
Trend: The RSI has risen sharply in recent days, aligning with the price surge, indicating strong momentum but also potential overextension.
Key ObservationsThe chart indicates a bullish breakout with significant upward momentum, but the overbought RSI suggests caution. Traders might consider taking profits at the marked TP levels or waiting for a pullback to the entry or lower TP levels.
The SL is set above the recent high, providing a buffer against a potential reversal.
The analysis appears to use a Fibonacci-based strategy, with levels derived from a recent swing high and low.
