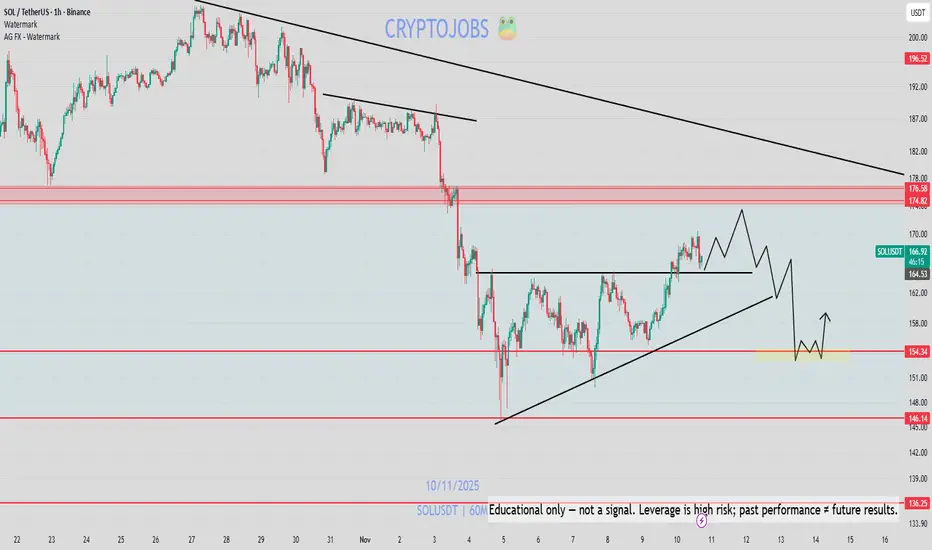
#SOL/USDT — Critical Retest at Demand Zone vs Long-Term Downtr#SOL
The price is moving within an ascending channel on the 1-hour timeframe and is adhering to it well. It is poised to break out strongly and retest the channel.
We have a downtrend line on the RSI indicator that is about to break and retest, which supports the upward move.
There is a key support zone in green at the 158 price, representing a strong support point.
We have a trend to stabilize above the 100-period moving average.
Entry price: 159
First target: 161
Second target: 164
Third target: 168
Don't forget a simple money management tip:
Place your stop-loss order below the green support zone.
Once you reach the first target, save some money and then change your stop-loss order to an entry order.
For any questions, please leave a comment.
Thank you.
Trade ideas

Important range: 161.79-163.73
Hello, traders!
Follow us to get the latest information quickly.
Have a great day!
-------------------------------------
(SOLUSDT 1D chart)
The HA-Low indicator, the DOM(-60) indicator, and the M-Signal indicator are forming around 161.79-163.73.
Therefore, the key is whether the price can break above the 161.79-163.73 level.
To continue the uptrend by breaking above this key point or level, the StochRSI, TC (Trend Check), and OBV indicators must show upward trends.
- The StochRSI indicator should not have entered the overbought zone.
- The TC (Trend Check) indicator should remain above zero.
- The OBV indicator should remain above the High Line.
Currently, the OBV indicator is near the Low Line, and is in a reversed state with OBV < EMA 2 and EMA 1.
Therefore, if the price breaks above the 161.79-163.73 level, we need to watch for a reversal where OBV > EMA2 and EMA1.
The StochRSI indicator appears to be rising from the oversold zone, and appears to have shifted to a K > D state.
The TC (Trend Check) indicator is trending upward, but since it's below the 0 level, we can see that selling pressure still dominates.
Therefore, if the TC indicator breaks above the 161.79-163.73 level, we should also check to see if it can rise above the 0 level.
If it fails to rise above the 161.79-163.73 level, we should check for support around 126.36.
Since the HA-Low indicator has been created, even if it shows a stepwise downward trend, it is expected to eventually turn upward.
Therefore, we should focus on finding the right time to buy.
-
Thank you for reading to the end.
I wish you successful trading.
--------------------------------------------------

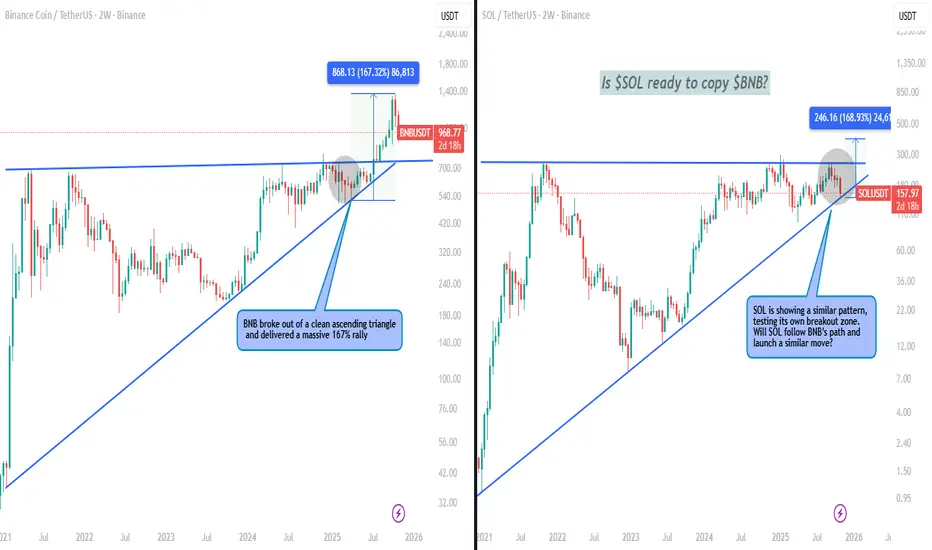
$SOL vs $BNB – History repeating?CRYPTOCAP:BNB broke out of a clean ascending triangle and delivered a massive 167% rally. Right now, CRYPTOCAP:SOL is showing a similar pattern, testing its own breakout zone.
Will SOL follow BNB’s path and launch a similar move? A structure like this could set the stage for a big run if support holds. Share your views—is CRYPTOCAP:SOL ready for its breakout moment?
#SOLANA Bear Market Hello everyone, I hope you're all doing well.
This is my prediction for the price of Solana in the coming weeks and months. I previously shared this idea when the price was $16, and I predicted it would rise to the top. Take a look below
This is not investment advice; please take full responsibility for your buying and selling decisions.
Warning: Be careful not to use this idea with leverage, as you could lose all your money

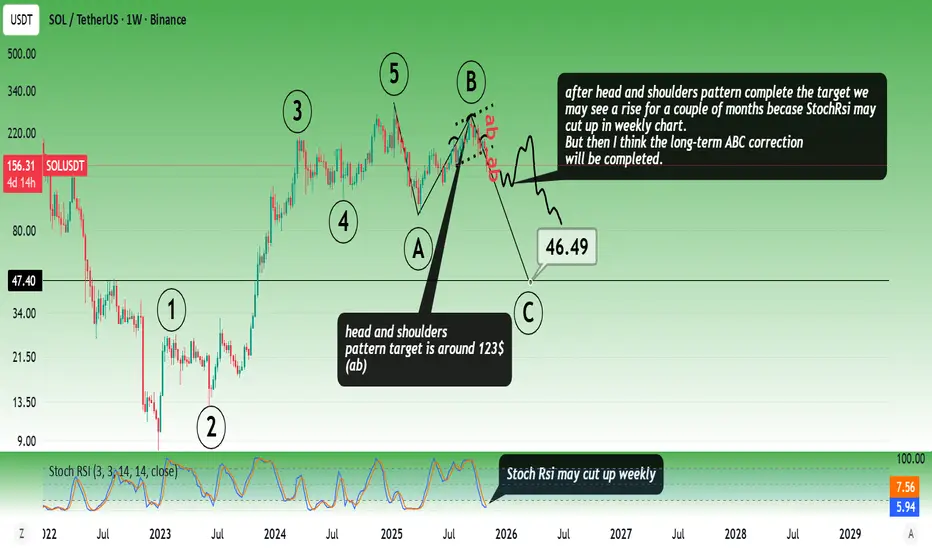
Solana RoadmapAfter the head and shoulders pattern complete the target we
may see a rise for a couple of months becase StochRsi may cut up in weekly chart.
But then I think the long-term ABC correction will be completed.
* The purpose of my graphic drawings is purely educational.
* What i write here is not an investment advice. Please do your own research before investing in any asset.
* Never take my personal opinions as investment advice, you may lose your money.
SOLANA WEEKLYSOLANA after 291.47 all time high,buyers attempted to reach same high but failed after been rejected at 291.47 critical supply roof .
all thing working in favor of sellers and they could hold sell till 82k-78.44-74k zone
Solana Ecosystem and Applications
Solana remains one of the fastest, cheapest blockchains, supporting a diverse range of projects:
DeFi platforms: Marinade Finance (staking solutions), Raydium, Orca (decentralized exchanges)
NFT marketplaces: Magic Eden, supporting digital art and collectibles
Gaming: STEPN (move-to-earn app), Genopets, and blockchain-based gaming with NFT utilities
Real-world asset tokenization: Transforming ownership models with fractionalization
Decentralized identity and privacy: Blockchain-based secure identity solutions
Supply chain transparency: Enhanced traceability and accountability
IoT integration: Secure data sharing between Internet of Things devices
Web3 social media and content platforms: Rewarding user participation with tokens
Why Solana’s Price is Falling
Market Sentiment: General crypto market volatility and risk-off sentiment affect Solana like other altcoins.
Regulatory Pressure: Increased scrutiny on crypto in major economies raises investor caution.
Network Issues: Past network outages and technical challenges still weigh on confidence despite improvements.
Competition: Intense competition from Ethereum, Avalanche, and emerging Layer 1 chains affects investor appetite.
Macro Factors: Broader macroeconomic headwinds including slowing tech sector, rising interest rates, and inflation concerns stunt speculative demand.
#solusdt

Solana Price Action Turns BearishSolana’s market structure shows a gradual weakening of bullish momentum after an extended upward phase earlier in the month. The asset experienced a breakout that temporarily fueled optimism among traders, but recent sessions indicate a loss of strength as sellers began to dominate. The volume profile suggests that market participants are shifting focus from accumulation to potential distribution, reflecting caution ahead of broader market developments.
Price movements over the past few weeks show that Solana has transitioned from impulsive bullish waves into a corrective environment. This phase reflects uncertainty and potential repositioning by large holders. The consolidation seen mid-cycle indicates a period of balance before a directional move resumes. Current activity implies that short-term liquidity adjustments are occurring, and volatility may expand in the coming sessions.
Market sentiment remains sensitive, with investor confidence depending largely on macroeconomic flows and digital asset liquidity trends. Solana’s performance continues to mirror broader crypto risk appetite, where speculative behavior is being tempered by cautious profit-taking. If momentum continues to decline, extended corrective movement could unfold as participants await new catalysts.
Overall, the report indicates that Solana is entering a controlled phase of distribution where institutional participants may be preparing for another medium-term adjustment in valuation.

Solana’s pause after the causeHi friends!
How are you doing after the recent Bitcoin–Solana drop?
I hope you didn’t lose anything — and maybe even managed to make some profit instead! 💪
📉 My next targets on the downside are around $144 and $124, but at the moment, Solana seems to be taking a breather from the fall.
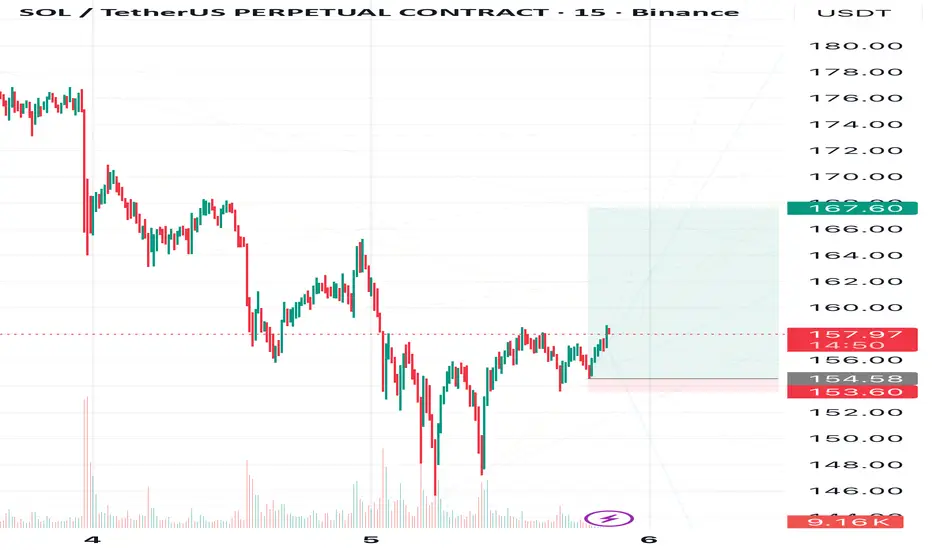
After a long and deep decline, even below my earlier expectations, Solana is finally showing some signs of a small correction to 167,60 📈
🎯Target - 167,60
❌Invalidation zone are marked on the chart - 153,60
💬 What do you think — is this the start of a reversal, or just a short pause before another move down? Share your thoughts in the comments. I always enjoy reading your views!
🔔 Follow me to stay updated on Solana and other crypto market analyses.
SOL-USDTIt reacted again on the same $150 support,
but we can only see a reversal on the chart 🚨📣
if the static resistance at $165 is broken.
That way, the first target will be $175 and then $185.

Why SOL is my bet for the next leg of the cycle Where some people are afraid and selling, others see an opportunity. Moments like this allow us to accumulate spot positions at good prices. They also help identify obvious market leaders — those who hold stronger than others. Today I will explain why, after analyzing the market, I came to the conclusion that SOL currently looks stronger than Bitcoin and why I’m placing my bet on it.
Last week there were days when SOL dropped less in percentage than BTC. Which is basically nonsense for crypto.
➡️ This is primarily related to the newly launched SOL ETF, which has seen inflows from the very first days. And, you know, this is actually the most successful start for a crypto ETF. Because BTC and ETH saw only outflows during the first weeks.
➡️ What we see on the chart: first — yes, a liquidity divergence on the Money Flow has formed. But this is not a secret to anyone, liquidity really leaves the market during such periods and starts returning closer to the bottom.
➡️ Next — the drop was extremely uneven. Despite the lack of major selling volumes, there are a lot of rumors about liquidations and market makers exiting the market, which in turn removed liquidity and now the price moves 10% per day.
➡️ Also, we see harmony in the selling volumes throughout the entire correction. This means the correction is not near its end and sellers are still in control. But no one said SOL will rocket tomorrow.
The first thing to look at — where the price may potentially reverse. And the first of such levels is $147. This is a key level of one of the ATHs of the current cycle, which later became an important support level.
Below that, there is an order block on the daily timeframe at $135–132. This is where the new impulsive move started back in April this year, therefore the level is important.
➡️ The Supply & Demand indicator shows that major demand has formed around $154–146, confirming the first target where a reaction may occur.
I expect Bitcoin to at least retest $99,000 before showing any meaningful bounce. Therefore, the current target levels for SOL look logical.
Drop a comment if you’re still alive in this market! 👇

SOLUSDT 1H | Bullish Continuation Setup following last weeks reversal , we have a continuation setup here
🟢 Market Structure
Price trading above Alligator (166.81 > 165.76 > 164.27)
Bullish alignment intact with expanding mouth
Weekly sell-side liquidity taken below
🔵 Alligator Support Levels
Lips: 166.81 (immediate support)
Teeth: 165.76 (primary support)
Jaws: 164.27 (strong support)
🎯 Entry Zones & Targets
🟡 Primary Entry: 166.80 - 167.20 (Lips retest)
🟠 Secondary Entry: 165.70 - 166.00 (Teeth retest)
🔴 Stop Loss: Below 164.00 (Jaws break)
💰 Take Profit Targets
TP1: 168.21 (immediate resistance)
TP2: 175.00 (marked resistance)
TP3: 180.00 - 185.00 (momentum extension)
⚡ Trade Management
Scale entries on Alligator retests
Move SL to breakeven at TP1
Trail stop for TP3 runner
Bullish continuation active - buying dips toward Alligator support

SOLUSDT Breaks Out and Aims for $200!BINANCE:SOLUSDT is trading above the 50 EMA on the 4H chart. a strong sign for short-term momentum. If you look closely, it has also broken out of an ascending triangle pattern and is moving upward with solid volume.
We’re expecting a potential upmove from here, with a short-term target around $200.
Always remember to set your stop loss and manage your risk wisely.
BINANCE:SOLUSDT Currently trading at $167
Buy level : Above $165
Stop loss : Below $154
Target 1: 175
Target 2: 200
Max leverage 3x
Always keep stop loss
Follow Our Tradingview Account for More Technical Analysis Updates, | Like, Share and Comment Your thoughts

SOLANA - Swing long (7.11.25)TP1 = 7/11/25.VAH + Selling Tail + Fibonacci Confluence x2
TP2 = 6/11/25.VAH + Fibonacci Confluence x3
Stop Loss = Below Buying tail

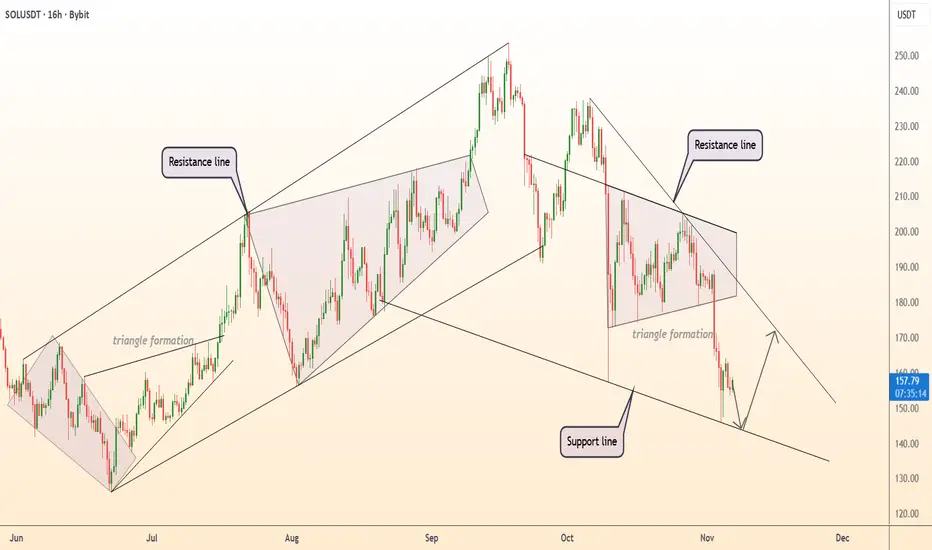
DeGRAM | SOLUSD will test the support line📊 Technical Analysis
● SOL/USD is testing the lower boundary of the descending channel near $150, a key support aligning with the broader bullish trendline from June. The pattern suggests a potential rebound within the channel toward $175–$180 resistance.
● Multiple triangle formations indicate prior consolidation phases before upward moves, reinforcing the likelihood of another medium-term recovery if support holds.
💡 Fundamental Analysis
● Growing institutional activity in Solana’s DeFi and NFT ecosystems continues to support long-term investor confidence, despite short-term volatility.
✨ Summary
● Support: $150. Resistance: $175–$180. A sustained bounce from the lower trendline could trigger a rally toward $190.
-------------------
Share your opinion in the comments and support the idea with a like. Thanks for your support!
SOL-USDTWith these Bitcoin drops, Solana also broke the $175 level and reached its key support at $155 🔽📉
These levels of 155 and 141 are important short-term supports, not important medium-term supports ⭕️💰
Maintaining these supports could push Solana towards resistances of $175 and then $185

SOL - UPDATE: CRYPTOCAP:SOL - update: 🟥
Remember, I posted this view few days ago.
Prices retested exactly the previous breakout (key support) around 170 - 175$.
If this level act as resistance, we could see another dump & lower low! 📉
Prices could move sideway for a while, but:
My initial outlook called for the 130$ level as bottom.
Judging by my weekly & daily view, For now this setup is valid under key resistances.
Daily = Bearish
Weekly = Neutral
At the opposite:
155$ must hold on daily basis to expect a downtrend reversal & breakout📈.
A downtrend breakout would surely lead to a push toward 180$ or even 200$+ 🟩
More infos & data in my charts! #dyor - H1 possible setup
SOL USDT LONG SIGNAL ---
⚠️ Disclaimer
This analysis represents personal technical opinion only and is not a buy or sell signal.
Please review the chart carefully and use proper risk management before entering any trade.
---
📢 Signal Alert
🔹 Pair: SOL / USDT
📈 Trade Type: Long
💰 Entry: 158.08
🎯 Take-Profit Targets:
TP1 = 160.69
TP2 = 164.06
TP3 = 167.54
🛑 Stop-Loss: 153.15
📊 Timeframe: 1H
⚖️ Risk/Reward Ratio: 5.7
📌 Suggested Leverage: 5x–10x
🔄 After TP1 is reached, move Stop-Loss to Entry to protect profits.
---
🧠 Technical Analysis Summary:
SOL is currently showing strong bullish momentum, maintaining its structure of higher lows and higher highs.
The price is supported by the EMA50 on the 1H timeframe, which continues to act as a dynamic support zone.
Momentum indicators such as RSI and MACD confirm the ongoing bullish bias — RSI is above the 50 mark and trending upward, indicating increased buying pressure.
The entry at 158.08 lies close to the breakout retest zone, making it an optimal position for a continuation toward upper resistance targets.
The stop-loss at 153.15 is placed below a key support level and swing low to avoid false breakouts.
---
⚙️ Trade Management Tip:
Wait for a bullish confirmation candle (e.g., 1H engulfing or hammer formation) before entry.
Secure partial profits at each TP level, and once TP1 hits, move SL to entry to reduce risk exposure.
---

$SOL Bull Run Testing Resistance?BINANCE:SOLUSDT CRYPTOCAP:SOL Bull Run Testing Resistance?
SOL's 1H chart roaring bullish, surging to 166.87 highs and eyeing resistance at 170—breakout could target 175 quick, but pullback to support 155 risks if momentum stalls.
Strong uptrend vibes!
Key indicators: RSI overbought at 70 (watch divergence), 50MA rising, volume spiking. 🌊🚀
#SOL #Solana #AltcoinPioneers

SOL USDT LONG SIGNAL
---
📢 Signal Alert
🔹 Pair: SOL / USDT
📈 Trade Type: Long
💰 Entry: 158.18
🎯 Take-Profit Targets (Partial Management):
▫️ TP1 = 162.00
▫️ TP2 = 164.70
▫️ TP3 = 167.60
▫️ TP4 = 174.40
🛑 Stop-Loss: 153.80
📊 Timeframe: 1H
⚖️ Risk/Reward Ratio: 3.85
📌 Suggested Leverage: 5x – 10x
⚠️ Capital management is mandatory.
💬 Please review the chart before entering the trade.
---
🧠 Technical Analysis Summary:
SOL is showing strong bullish momentum after bouncing from the key support zone near 154–156, confirming buyer dominance.
A clean breakout and candle close above 159 will likely trigger a continuation toward 164–174.
The RSI remains above 55 and trending upward, indicating sustained buying pressure.
The EMA 20 is turning upward, supporting the long bias, and volume confirms accumulation.
---
⚙️ Trade Management Tip:
Take partial profit at TP1, move stop-loss to Entry to protect capital.
If price reaches TP2–TP3, trail stop-loss under the last 1H swing low.
Avoid entries before confirmation candle close above 159.
---
⚠️ Disclaimer:
This analysis is for educational purposes only and not financial advice.
Always DYOR (Do Your Own Research) and use strict risk management before trading.
--

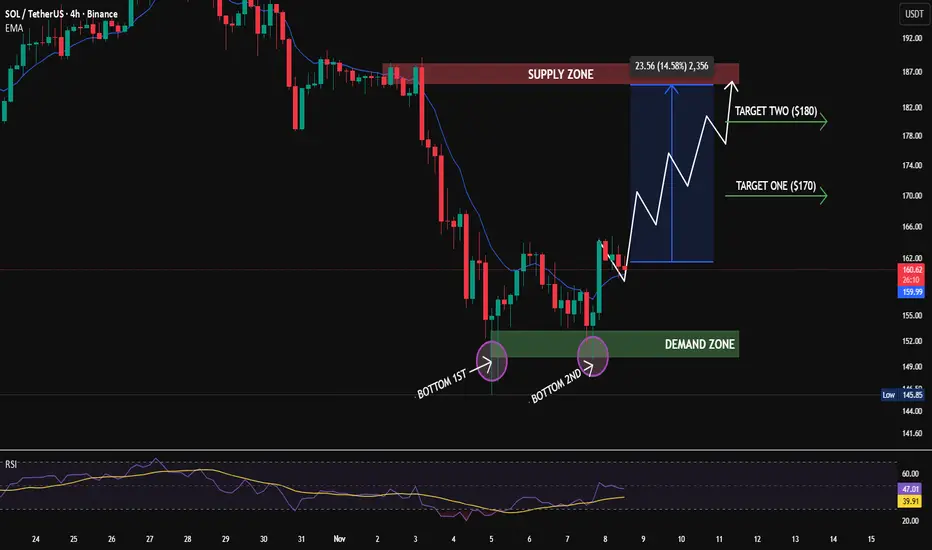
Double Bottom Reversal (Bullish Structure from Demand Zone)The chart shows SOL forming a double bottom at a strong demand zone, indicating a potential bullish reversal. Price has bounced twice from the same support region, showing clear buyer aggression and seller exhaustion, with a projected move toward the upper supply zone.
Key Observations
🔹 Demand Zone: $148 – $152 — strong support where both bottoms formed, triggering buyer interest.
🔹 Double Bottom Formation: Two clean touches confirming reversal structure.
🔹 Supply Zone: $183 – $187 — key resistance where sellers may step in.
🔹 EMA (10): Price is attempting to reclaim it; a close above the EMA would confirm momentum shift.
🔹 RSI: Currently around 47 — rising from lower levels, signaling early bullish momentum with room to move higher.
🔹 Structure: As long as SOL holds above the demand zone, the bullish reversal setup remains intact.
Potential Move
If SOL continues to hold above the $148–$152 demand zone, the next
upside targets are:
🎯 Target 1: $170
🎯 Target 2: $180
A breakdown below $148 could invalidate the reversal and push the price back toward deeper support levels.
Summary:
SOL is showing a strong double-bottom reversal from a key demand zone, supported by improving RSI and EMA interaction. Holding above $150 keeps the bullish structure active, with a potential continuation move toward $170–$180, followed by a retest of the supply zone near $185.
.
.
#coinpediamarkets #SOL #SOLUSDT #CryptoAnalysis #TechnicalAnalysis #Altcoins #DemandZone #SupplyZone #BullishTrend
SOLANA’S SWING — BEARS TAKE WINGHey guys! How was your trading week? Hope you made some great profits!
Solana has completed only half the way to my target at 167 and then reversed — and now I don’t see any signs of continuation to the upside.
In my previous Solana post, I mentioned that my next downside targets are 144 and then 124.
I believe we’ve just finished the correction and are heading toward 144 — at least, that’s what all the signs on the chart are showing me right now.
However, first I expect a dip to 147, as there might be a short-term bounce before further decline.
🎯 Targets:
1️⃣ 147
2️⃣ 144
3️⃣ 124
❌ Invalidation: 158.53
📈 Follow me to stay updated on Solana’s next moves and other crypto setups — don’t miss my updates!
⚠️ Disclaimer:
This is not financial advice. I share my personal market view for educational purposes only. Always do your own research before making trading decisions.

The crypto world is just getting started. This is not the end!I am giving more weight to the recent pullback in crypto and I think all currencies are going to hit a higher ceiling from here, so this bearish trend will continue until the end of this week, but this is not the end of it!
SOL USDT LONG SIGNAL---
📢 Signal Alert
🔹 Pair: SOL / USDT
📈 Trade Type: Long
💰 Entry Zone: 158.29 – 161.77
🎯 Take-Profit Targets:
TP1 = 163.94
TP2 = 168.00
TP3 = 174.40
🛑 Stop-Loss: 156.10
📊 Timeframe: 1H
⚖️ Risk/Reward Ratio: 4.11
📌 Suggested Leverage: 5x – 10x
⚠️ Capital management is mandatory.
Please review the chart carefully before entering the trade.
---
🧠 Technical Analysis Summary:
SOL is showing a strong bullish structure after a short correction phase. The price is currently rebounding from the demand zone (158–162) with clear buy pressure and higher low formation.
🔸 Key Observations:
RSI has turned upward from neutral, confirming renewed bullish momentum.
Price is holding above EMA50, signaling potential continuation of the uptrend.
Volume profile supports accumulation at current levels.
Each target aligns with prior resistance levels and Fibonacci extensions.
---
⚙️ Trade Management Tip:
Once TP1 is hit, move your Stop-Loss to Entry and secure partial profits.
Allow remaining positions to ride toward TP3 for maximum reward.
---
⚠️ Disclaimer:
This signal is for educational purposes only and not financial advice.
Always apply proper risk management and DYOR (Do Your Own Research).
---
