The crypto world is just getting started. This is not the end!I am giving more weight to the recent pullback in crypto and I think all currencies are going to hit a higher ceiling from here, so this bearish trend will continue until the end of this week, but this is not the end of it!
Trade ideas
SOL Follows Red Scenario — Key Support at 138–126Last week, Solana followed our red scenario. At the moment, the price is trading below the weekly levels.
If Bitcoin continues to decline, Solana’s price could drop into the 138–126 support zone. A return to a bullish trend will only be possible after breaking above 190 .

SOLANA Massive Head & Shoulders On The Monthly Chart !Hi guys,
I've never seen a Head & Shoulders so big and clear like what we have on SOL right now lol
I wouldn't wait for price to go up and get out..I'd say get out and get out now while u have a chance.
We Also kinda have a double top from this year and 2022 ATH so that makes it two big red flags!
50$ is a magnit at this point and safest level for entry which will probably take us a year to get there so stay safe out there and let me know what do you guys think about this ?

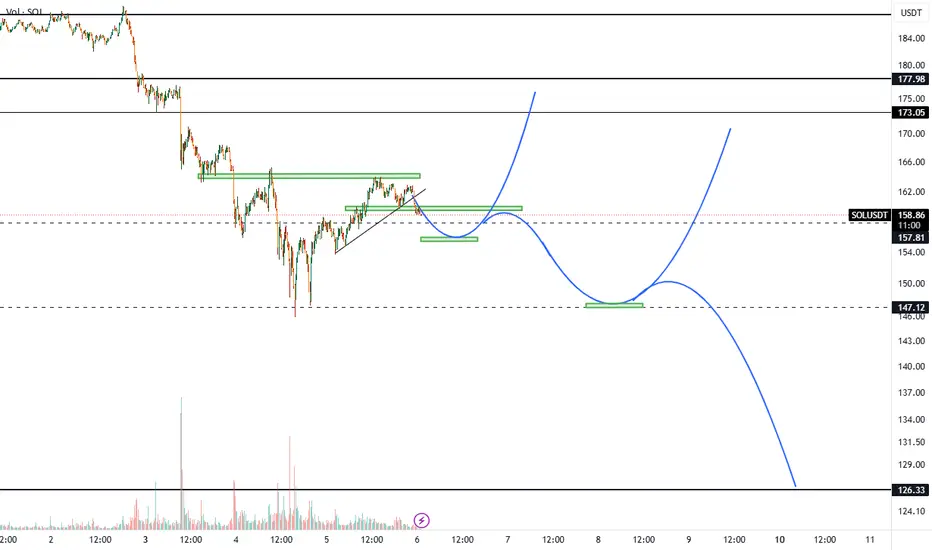
SOL-USDTThe $156 level is the first support for Solana, and if it breaks, it could move toward $141💰🔽And by holding this support, it could rebound toward $172.

SOL 1H OutlookSOL just raided weekly sell-side liquidity and reacted instantly — algorithmic accumulation signature. Looking for bullish continuation into premium levels.
📍Levels
Entry: $156.90 – $159.61
Stop: $145.74
First Target: $168 – $170
Main Target: $189.73 liquidity cluster
✅ Confluence
• Weekly sell-side liquidity swept
• Bullish displacement after the sweep
• Alligator curl + early expansion phase
• Demand zone reclaimed
• Liquidity void above → draw on liquidity
• Fractal shift at lows → accumulation phase signal
As long as price holds above reclaimed liquidity zone, expecting delivery higher.
Partial profits at $168–$170 region, let the rest ride to $189.73. 🚀
#SOL #SmartMoneyConcepts #ICT #BillWilliams #CryptoTrading #PriceAction

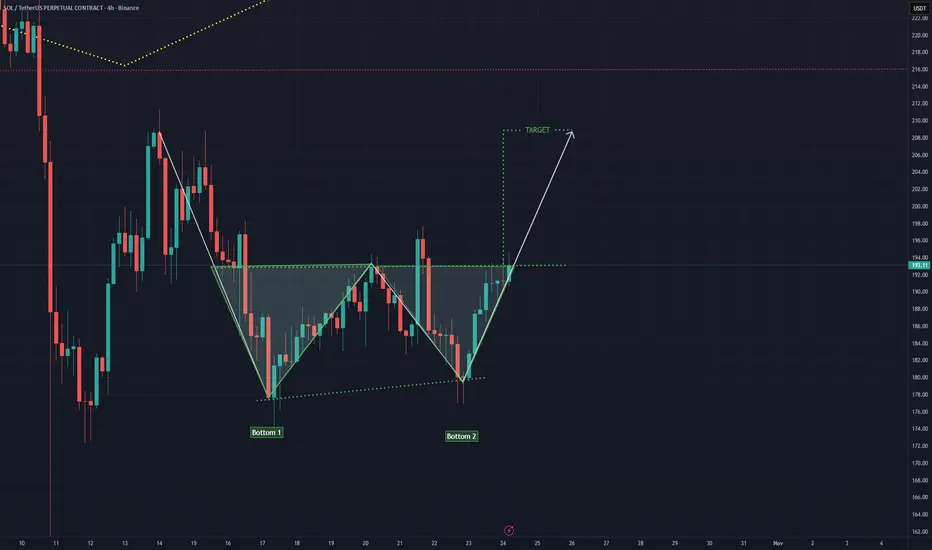
SOL 4H CRYPTOCAP:SOL 4H Chart
Solana forming a clear Double Bottom pattern signaling a potential trend reversal after the recent pullback.
Price is testing the neckline resistance, and a breakout above could confirm bullish continuation toward the projected target zone.
If confirmed, this setup suggests strong bullish momentum building for $SOL.
#SOL #Solana #Crypto #PriceAction #TradingView
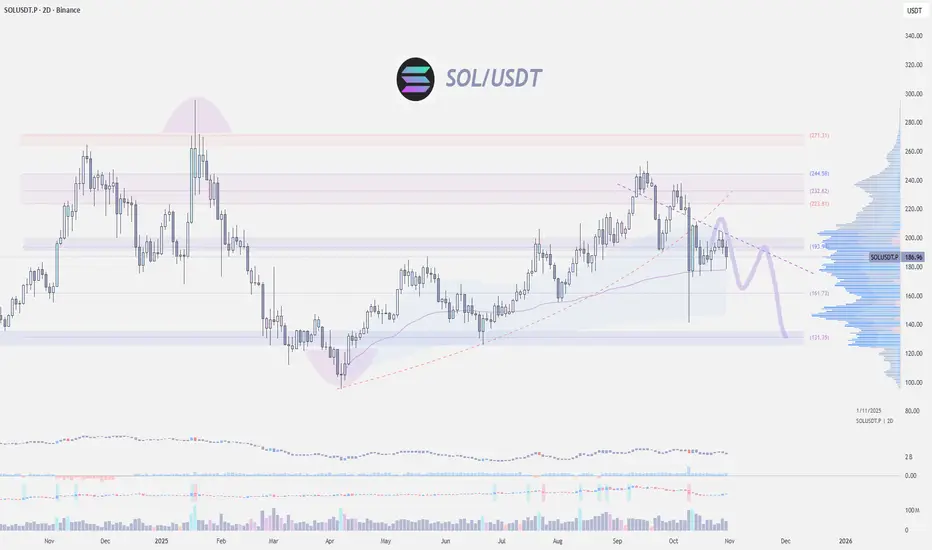
Sol Next StepsBINANCE:SOLUSDT SOL is expected to retrace from $195 toward $175–160, possibly dipping into the $140–150 weekly buy zone before reversing. The chart outlines a bearish correction within a larger bullish structure, targeting $213–222 then $240+. SMA confluence and liquidity zones support a mid-term accumulation before breakout.

down then back to $250 ?Possible downtrend to $143 support? on a weekly. RSI looks on the downside for the next few months.

SOL/USDT Update — Bullish Trend Structure and Resistance Ahead“🚨 Solana vs Tether: Bullish Heist on SOL/USDT 💰”
📊 Description
Market: SOL/USDT
Bias: Bullish (Swing / Day Trade)
✅ Trade Plan
Entry: 🎯 Any good support / demand area — stay alert & flexible.
Stop Loss: 🛡️ “Thief SL” @ 160.00 USDT — this is my SL, not yours. Manage your own risk!
Targets (TP):
• 🎯 Target 1: 215.00 USDT
• 🏁 Target 2: 240.00 USDT
⚠️ Heads up: Use your discretion. Do not blindly follow my SL/TP — trade responsibly, at your own risk.
🔍 Key Insights / Logic
🚧 Expect resistance & traps near 215–240 — don’t get stuck in overbought zones.
📈 Momentum is building; structure is favorable on retests.
🔊 Watch volume on impulsive moves — rising volume = strength.
🔄 Related pairs / correlation watch:
• BINANCE:SOLBTC — strength vs BTC strengthens the bullish case.
• BINANCE:ETHUSDT — altcoin momentum may carry SOL upward.
• BINANCE:BNBUSDT — BNB strength can support ecosystem flow.
✨ “If you find value in my analysis, a 👍 and 🚀 boost is much appreciated — it helps me share more setups with the community!”
#SOL #SOLUSDT #Solana #CryptoSwing #CryptoDayTrade #AltcoinAnalysis #TradingViewIdeas #CryptoFun

SOLUSDTI think have this chart of BINANCE:SOLUSDT buy because breakout trendline and i see order-block in 194$. Target is end measured move (2-Leg) from low latest swing in 208$.
Please control your risk in any position.

SOLUSDT – Is the Sun Rising Again for Solana?Solana found strong footing,and bulls seem to be warming up again 🔥
But careful if it slips back below 174.60, the sun could set a bit earlier than expected 🌅😅


SOL - NEUTRAL AREA, bearish bias likely! CRYPTOCAP:SOL - no price direction, very neutral.
Likely a retest of the 190$ - 184$ support zone next. 📉

SolanaPrice of Solana has formed a bullish triangle. A classic target would be at around $400. But if it's alseason now like on ZCash then the target should be way higher.

SOL Up to 190 then down to 150Technical analysis. This is what it's all about man. Forecasting price.
So, I predict it's going to $190 because that's where my stop is, as I just entered short for no good reason in this sideways choppy market. Now price is guaranteed to hit my stop loss before actually making a huge move in my initial direction.
If I get stopped out, I'll lose $1000.
But I dont know, I haven't looked at metal commodities in the last few days, but those were coming down recently, so maybe people will start selling these kind of risky gold/crypto assets.
I'd also be curious about a possible gold-btc rotation thing. Has anyone looked into that? Let me know.

Solana at a Make-or-Break LevelSolana couldn’t sustain momentum above $200 and now holding the critical level $170.
CRYPTOCAP:SOL is sitting at a make-or-break level — failure to reclaim the $200 zone or a clean break below $170 would be a concerning signal for bulls.
A decisive breakdown below this area could trigger a deeper retracement toward $150, with the worst-case scenario being a full retest of the $130 range — aligning with the previous demand zone and high-volume node.
SOL (4-HOUR): TRIANGLE breakout, RETESTED, UPTRENDCRYPTOCAP:SOL zoomed in on the 4-HOUR chart is looking much better than most major cryptos. In an UPTREND after a TRIANGLE #Breakout and with a HIGHER LOW on the pattern's upper trendline.
Once again, lots of SUPPORT below, all kinds of it. It's ready to start a new cycle upwards, no ELLIOT WAVE count yet though, but the correction seems to be complete.
Obviously, a lot depends on CRYPTOCAP:BTC , so hopefully no dip below the 200 MA there. There could be a potential flash-crash in the market, so my STOP loss is manual, using candle closes (below $170) rather than a set level.
My targets will be based on ELLIOT WAVES once a solid count appears, but for now, I'm watching these levels: $206 (rejection here again could be brutal, and breakout above a volatile one), $234 (TRIANGLE target), and the zone between $254 and $264.
We’ll see how it goes — easy with the stakes, lots of chaos in the markets, no PCE numbers today due to the GOVERNMENT #shutdown in the US.
💙👽

$SOL (DAILY): LON $187 (STOP LOSS: below $170)Longing CRYPTOCAP:SOL here at $187.
Reasoning within 30 minutes in the next post.
Modest stake, SL: two 4-hour candles below $170.
💙👽


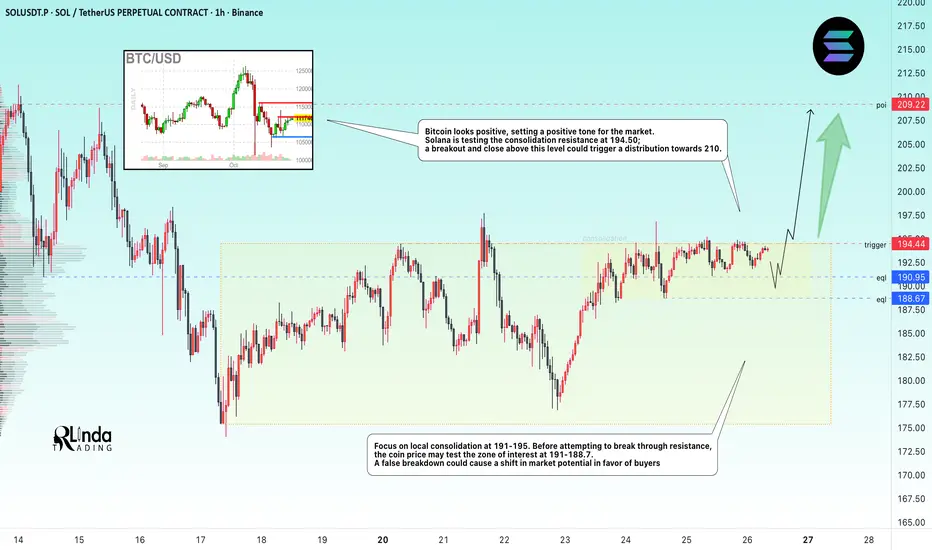
SOLANA → Consolidation before resistance. An attempt at growth?BINANCE:SOLUSDT.P is testing the resistance of the trading range, with pre-breakout consolidation forming, indicating that buyer interest in the coin is emerging.
Bitcoin looks positive, which sets a positive tone in the market. Solana is testing the resistance of consolidation at 194.50; a breakout and close above this level could trigger a distribution to 210.
Focus on local consolidation at 191-195. Before attempting to break through resistance, the coin price may test the zone of interest at 191 - 188.7. A false breakout could cause a shift in market potential in favor of the buyer, which in turn could trigger a breakout of 195 and growth.
Resistance levels: 194.5, 209
Support levels: 190.1, 188.7
A retest of resistance, consolidation after growth, and no reaction to bears are positive signs that a breakout attempt may be realized. A close above 194.5 - 195.0 would be a good sign for growth.
Sincerely, R. Linda!
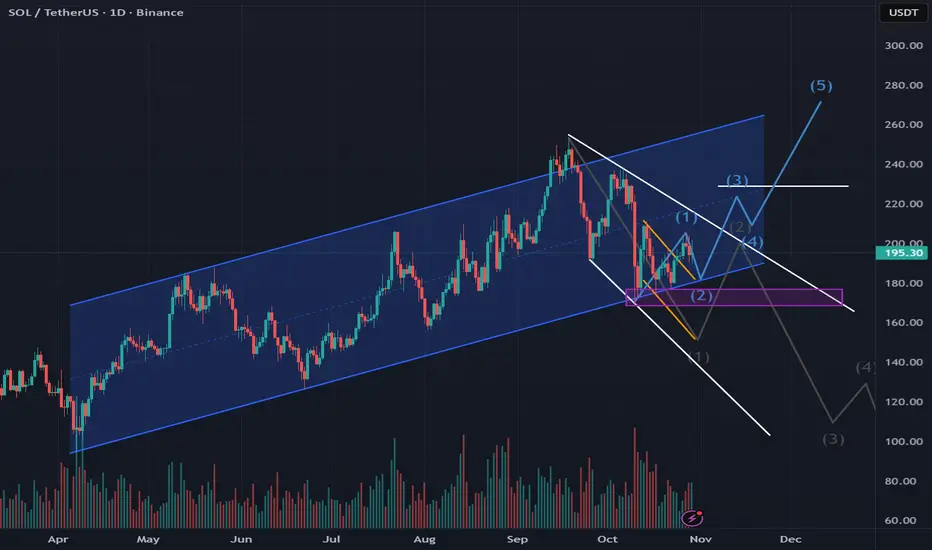
Solana shows diverging patternsSOL has formed a very interesting pattern and situation...
On the one hand, we see:
- confident movement within an ascending channel (marked in blue)
- positive news regarding SOL and the ETF
- a locally formed bullish flag, which fulfilled the expected movement (marked in yellow)
On the other hand, we see:
- a formed descending expanding wedge (marked in white), within which the global trend should have developed and become downward
- theoretically, the movement and formation of the first corrective Elliott wave (marked in dark gray) was determined within it
- buyers are preventing either the pattern or the wave from forming
The situation is interesting because we clearly see how the price is rebounding strictly along the lower boundary of the ascending channel, preventing a downward movement according to the pattern (marked in white) from forming, indicating the strength of the buyers. At this time, we also see the possible formation of a second corrective wave within the upward movement.
Current price: $193.40
An upward movement is most likely expected, with a breakout from the descending expanding wedge, within the ascending channel, to levels of $206, $220, and above...
A breakout into the $176 and $166 zone is also possible, and if the price goes lower, the current pattern will be broken.
More detailed analysis, additional charts, and key levels to watch are available on our site
sol-usdtIt has had a good rise from its well-known support at $175.
For this rise to continue towards $197, the $190 level needs to be broken to activate the $197 to $200 target 📈
Solana's short-term supports are $183 and then the $175 floor.

$SOL (DAILY): HIDDEN BEAR RSI divergence, $69M ETF inflows CRYPTOCAP:SOL has now got a spot #ETF (Bitwise), and that thing pulled in nearly $70 million in inflows on day one — not bad. People and institutions have clearly been waiting for this one.
Normally, these types of events are textbook “sell-the-news” moments. However, in this case, if the inflows stay strong and even start growing day by day, that’s definitely not bearish.
Chart-wise, I published my strategy for #Solana recently (quoted post), and the plan stays the same — patiently wait for a breakout, especially with the latest bearish hidden RSI divergence; I never ignore these.
The bullish MACD crossover and hidden bullish OBV divergences can’t be ignored either, but I definitely won’t go long before a confirmed breakout.
Rules are rules. #FOMC day today, so I’d rather not open any new positions until tomorrow.
👽💙
