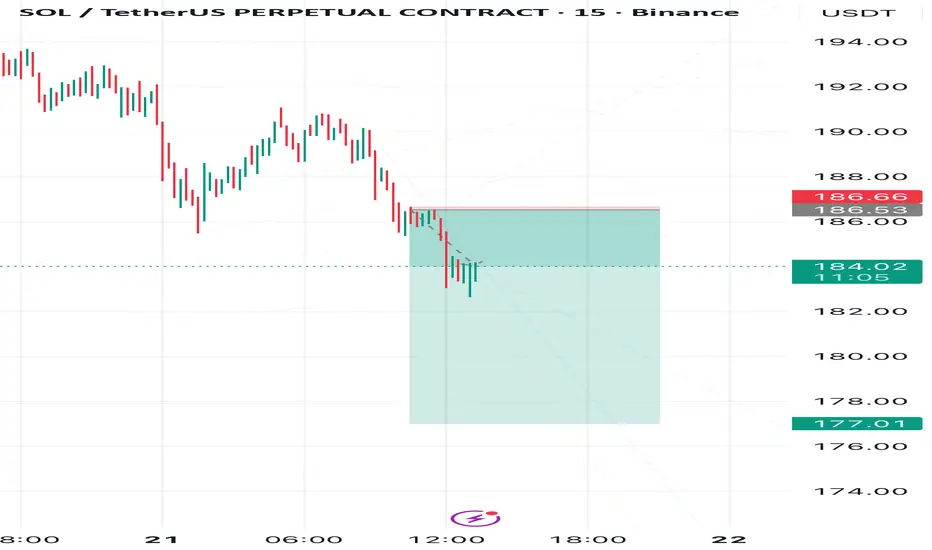
Solana Drop DramaSolana has started its decline as expected. I am now targeting a drop to 177
On the chart, I marked the plan cancellation zone—if price breaks this area, the scenario becomes invalid.
Trade ideas
TradeCityPro | SOLUSDT Ready for a Sharp Drop!👋 Welcome to TradeCityPro Channel!
Let’s start today’s review with Solana (SOL) — one of the strongest and most recognized altcoins in the entire crypto market. Known for its high-speed transactions, low fees, and growing DeFi and NFT ecosystem, Solana has consistently been among the top performers in every bullish cycle. But like the rest of the market, it hasn’t been immune to the recent wave of volatility and corrections.
🧩 Market Context
Over the past few days, the market has experienced a strong correction phase, mostly triggered by the uncertainty coming from global financial news and risk-off sentiment among investors. Solana, which was trading comfortably above 217.77, saw a sharp drop from that level, leading to a decline toward the 176.15 support zone — a key area where buyers have historically shown strong interest.
At the moment, Solana is oscillating within this support range, attempting to stabilize after the drop. This phase is quite crucial because it determines whether the market is preparing for another leg down, or if it’s about to build a base for recovery.
📉 Bearish Scenario (Short Setup)
If the market sentiment remains weak and 176.15 fails to hold, we can expect another sharp downward move.
The key here is to wait for confirmation — specifically, a break and close below 176.15 with strong volume.
To increase accuracy and reduce risk, it’s better if this breakdown happens after forming a lower high, showing that sellers are gaining control again.
In that case, traders could open a short position, targeting the next support areas below — possibly near 165–160 depending on the momentum of the move.
📈 Bullish Scenario (Long Setup)
On the other hand, if Solana continues to range around this zone or performs a fake breakdown (fakeout) below 176.15 and then quickly reclaims it, this would be a strong bullish signal.
Such a reaction often indicates that smart money is accumulating positions while shaking out retail traders who panic sell at the bottom.
Considering Solana’s overall bullish structure on higher timeframes (Daily and Weekly), a fakeout recovery here could set the stage for a trend continuation move to the upside.
In that case, once price breaks above the short-term resistance — typically around 185–190 — traders could consider long positions with targets toward 200–210.
🎯 Summary
🔴 Short Setup:
Wait for a confirmed breakdown below 176.15
Ideally after forming a lower high
Target range: 165–160
🟢 Long Setup:
Watch for a fakeout or range continuation around 176–180
Confirmation: breakout above 185–190
Target range: 200–210
💬 Final Thoughts:
Solana remains one of the most technically strong and fundamentally solid projects in the market.
While short-term volatility is high, these kinds of deep corrections are often opportunities for disciplined traders to position themselves before the next major move.
Patience, confirmation, and proper risk management are key here — the chart will soon reveal whether SOL is ready for another leg up or a deeper retracement.

SOLANA SOLUSDTSOLANA bullish catalysts
Approval of Spot Solana ETFs: The US Securities and Exchange Commission (SEC) is expected to approve spot Solana ETFs imminently, potentially by the end of October 2025. ETF approval tends to open the doors for mainstream institutional and retail investors, likely injecting billions of dollars into SOL's market and significantly boosting demand and price.
Alpenglow Upgrade: Solana's upcoming Alpenglow network upgrade, projected for Q1 2026, will transition Solana from proof-of-authority to proof-of-stake consensus. This upgrade is expected to boost transaction speeds to over 100,000 TPS and improve network scalability and security, supporting broad adoption and enhancing Solana's competitive edge over other blockchains like Ethereum.
Strong On-chain Metrics and Institutional Adoption: Solana exhibits robust on-chain activity—65,000 transactions per second, $9.3 billion total value locked (TVL) in DeFi, and 32 million unique wallets. Institutional holders currently own approximately 13 million SOL, reflecting growing confidence by major players including Visa and PayPal.
Macro-Economic Tailwinds: Expectations of Federal Reserve rate cuts encourage appetite for risk assets like crypto. Alongside improved liquidity conditions, this sets a favorable macro backdrop for SOL's price appreciation.
Whale Accumulation: Recent price dips saw large holders ("whales") increase their Solana holdings substantially, signaling confidence in a bullish recovery and potential breakout above key resistance levels ($190 to $300).
Market Position and Ecosystem Growth: Solana is a leading smart contract platform with rapid development, high developer engagement, and dominance in niches like DeFi and NFTs, strengthening its growth potential.
I dont know what else to say other than Solana crashing is coming
key demand floor
@supplyroof break and close new demand floor 211.45
@130.2- @129.5
@76.71 my choice
layer by layer.
@41.52
#solusdt #solana #crypto.

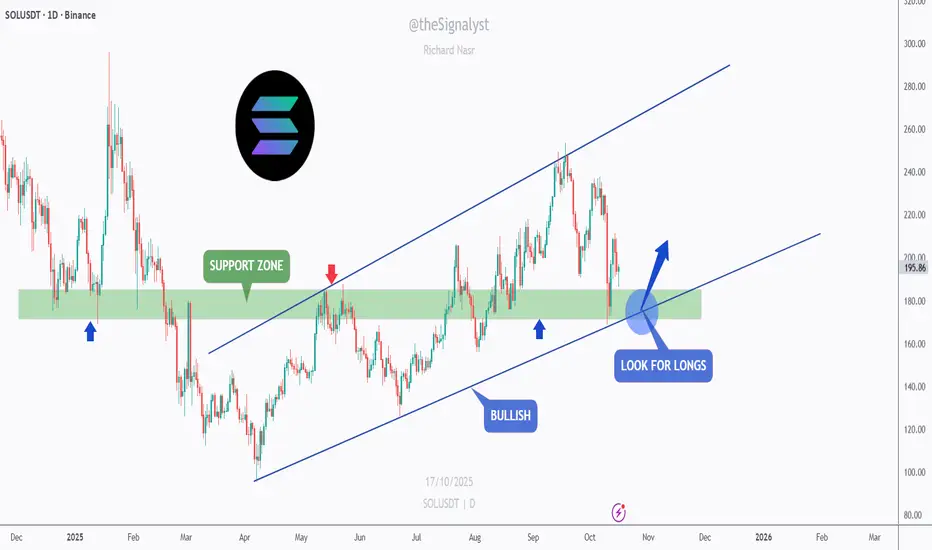
SOL - Buying the Retest Like a Sniper!SOL remains overall bullish , trading within a clean ascending channel and currently retesting the support zone that has acted as both resistance and support in the past.
This zone also aligns perfectly with the lower blue trendline, creating a strong area of confluence.
As long as this intersection holds, SOL is likely to rebound from here. I’ll be looking for bullish rejections or reversal patterns around the current zone to enter long positions, aiming for the next resistance levels near $230 and $260.
However, if the price breaks below the support zone, we could see a deeper correction before buyers regain control.
⚠️ Disclaimer: This is not financial advice. Always do your own research and manage risk properly.
📚 Stick to your trading plan regarding entries, risk, and management.
Good luck! 🍀
All Strategies Are Good; If Managed Properly!
~Richard Nasr
sol-usdtYesterday I said that if it breaks $200, it will go up, but it didn't confirm the break 🕯
It currently has a valid support of $177, so I don't think it will break easily.

Be careful with SOLANA !!!It can be said that the price has broken out of this triangle and may experience a solid upward move. However, before the rally, it will likely liquidate long positions once.


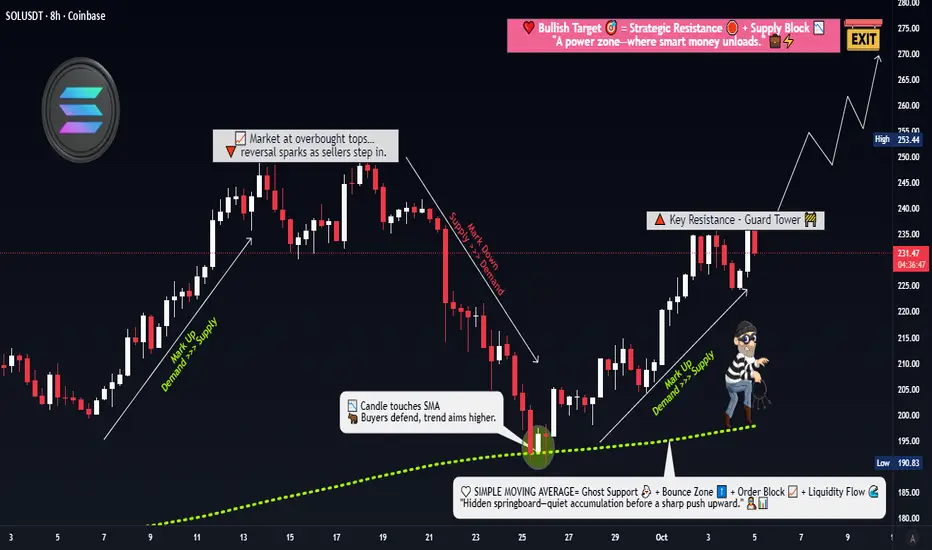
Is Solana Ready for a Technical Breakout or Just a Fake Pump?🎯 SOL/USDT Wealth Strategy Map | The Gentleman Thief's Playbook 💎
📊 Market Overview
Asset: SOLANA/USDT (SOL/USDT)
Trading Style: Swing/Day Trade Hybrid
Market Sentiment: Bullish Pending Breakout Setup 🚀
🎭 The Setup (As Told by a Professional Thief)
Dear Ladies & Gentlemen, gather 'round for today's calculated heist...
🔓 The Entry Plan
Breakout Zone: $240
Entry Strategy: ANY price level AFTER confirmed breakout above $240
💡 Why this matters: We're watching for resistance to crack like a vault door. Once $240 breaks with volume, the path to riches opens.
🛡️ Risk Management (The Thief's Insurance Policy)
Stop Loss: $220
⚠️ Important Notice: This is my thief-style SL, but YOU are the master of your own vault. Set your risk tolerance based on YOUR capital and comfort level. Make money, take money — at your own calculated risk.
🎯 Profit Targets (Where We Cash Out)
Primary Target: $270 (Our recommended exit)
Technical Target: $280 (Strong resistance + overbought territory + potential trap zone)
📌 Strategic Exit Reasoning:
$270 offers a clean 12.5% gain from breakout
$280 presents multiple bearish factors: strong resistance, overbought conditions, and classic bull trap setup
Smart thieves escape with profits before the alarm sounds 🚨
⚠️ Important Notice: This is my thief-style TP, but only YOU can decide when to take profits. Your money, your rules, your risk.
🔍 Technical Analysis Deep Dive
Key Levels to Watch:
Resistance: $240 (current), $270 (target), $280 (danger zone)
Support: $220 (our safety net)
The Correlation Play 📈
Related Pairs to Monitor:
CRYPTOCAP:BTC (Bitcoin) - The market's king affects all. If BTC pumps, SOL typically follows with 1.5x volatility
CRYPTOCAP:ETH (Ethereum) - Direct competitor in smart contracts; inverse correlation on capital rotation
CRYPTOCAP:AVAX (Avalanche) - Similar L1 narrative; watch for sector rotation signals
SEED_DONKEYDAN_MARKET_CAP:MATIC (Polygon) - L2 competitor; check for broader altcoin momentum
💡 Correlation Strategy: If BTC holds above $65K while ETH consolidates, SOL historically outperforms due to capital flow seeking higher beta plays.
⚡ The Gentleman Thief's Trading Philosophy
This isn't gambling — it's calculated robbery from the market's inefficiencies. We enter with precision, manage risk like professionals, and exit before greed becomes our enemy.
Remember:
✅ Breakouts need volume confirmation
✅ Risk management is non-negotiable
✅ Profits aren't real until you take them
✅ The market doesn't care about your feelin
📢 Community Engagement
✨ "If you find value in my analysis, a 👍 and 🚀 boost is much appreciated — it helps me share more setups with the community!"
⚖️ Legal Disclaimer
IMPORTANT: This is a "thief-style" trading strategy shared purely for educational and entertainment purposes. This is NOT financial advice. Trading cryptocurrencies involves substantial risk of loss. Past performance does not guarantee future results.
You are solely responsible for your own trading decisions. Always:
Do your own research (DYOR)
Never invest more than you can afford to lose
Understand the risks before trading
Consider your personal financial situation
The author is not a registered financial advisor and assumes no liability for your trading outcomes.
Trade safe, steal smart, exit elegant. 🎩💰
#SOLUSDT #Solana #CryptoTrading #SwingTrading #DayTrading #TradingStrategy #Breakout #TechnicalAnalysis #CryptoSignals #AltcoinSeason #SOL #USDT #CryptoAnalysis #TradingView #PriceAction #CryptoChart #BullishSetup
#SOL still has potential for new highs 📊#SOL still has potential for new highs 🚀
🧠From a structural perspective, the daily uptrend and bullish structure remain intact, so we shouldn't be overly bearish. Currently trading near the daily neckline support, the uptrend support line at 170.777 has not yet been tested. Extreme support is near 152.
➡️If further gains are expected, sideways consolidation will be necessary to break this downtrend. Therefore, focus on range-bound trading. Patiently wait for the price to reach its limit before considering trend-based profits.
🤜If you like my analysis, please like 💖 and share 💬
BITGET:SOLUSDT.P

$sol 1hr long setup Market Structure: Higher highs/lows intact - bullish continuation pattern
Liquidity Grab: Recent dip to $182.74 likely swept sell-side liquidity below previous low
Optimal Trade Entry: Current zone around $185-186 presents potential long entry
BILL WILLIAMS ALLIGATOR CONFIRMATION:
Price currently trading ABOVE the Alligator's lips/jaws (bullish alignment)
TRADE PLAN:
Entry Zone: $185.00 - $185.50 (with confirmation)
Stop Loss: Below $182.50 (respecting market structure)
Targets:
TP1: $187.11 (immediate FVG)
TP2: $190.00 (psychological + structural)
TP3: $193.78 (swing high extension)
RISK MANAGEMENT:
Position size according to 1-2% risk rule

SOLANA SOLUSDTSOLANA bullish catalysts
Approval of Spot Solana ETFs: The US Securities and Exchange Commission (SEC) is expected to approve spot Solana ETFs imminently, potentially by the end of October 2025. ETF approval tends to open the doors for mainstream institutional and retail investors, likely injecting billions of dollars into SOL's market and significantly boosting demand and price.
Alpenglow Upgrade: Solana's upcoming Alpenglow network upgrade, projected for Q1 2026, will transition Solana from proof-of-authority to proof-of-stake consensus. This upgrade is expected to boost transaction speeds to over 100,000 TPS and improve network scalability and security, supporting broad adoption and enhancing Solana's competitive edge over other blockchains like Ethereum.
Strong On-chain Metrics and Institutional Adoption: Solana exhibits robust on-chain activity—65,000 transactions per second, $9.3 billion total value locked (TVL) in DeFi, and 32 million unique wallets. Institutional holders currently own approximately 13 million SOL, reflecting growing confidence by major players including Visa and PayPal.
Macro-Economic Tailwinds: Expectations of Federal Reserve rate cuts encourage appetite for risk assets like crypto. Alongside improved liquidity conditions, this sets a favorable macro backdrop for SOL's price appreciation.
Market Position and Ecosystem Growth: Solana is a leading smart contract platform with rapid development, high developer engagement, and dominance in niches like DeFi and NFTs, strengthening its growth potential.
I dont know what else to say other than Solana crashing is coming
key demand floor
@supplyroof break and close new demand floor 211.45
@130.2- @129.5
@76.71 my choice
layer by layer.
@41.52
#solusdt #solana #crypto.

SOL-USDTIn order for Solana to be bullish, it must break the downtrend line, in which case it can start climbing towards $200. 🪙🪙
Solana's reliable bottom is $175

Solana 20 oct 2025 analysis if today 20 oct 2025 daily close we can stand the price above 191, possibly we can continue rally up

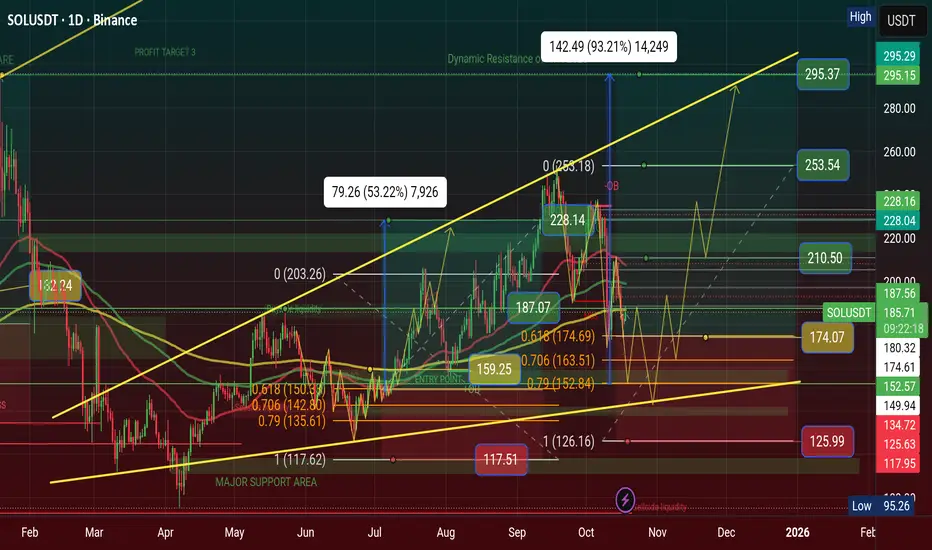
$SOL Showing Inverse Descending Triangle Pattern, $333 in 2026 CRYPTOCAP:SOL Showing Inverse Descending Triangle Pattern, $333 in 2026
💹 Inverse Descending Triangle Pattern
When This pattern will showing a chart than Price is waveing Descending Triangle Range of areas. Price will showing inverse and price moved too. we can make a trade plan to High area and low area. I'm using my Golden Fibonacci Tool, there are 3 point area of Buy position.
💲Position Setup: Open Long Position have 3 point areas, $152, $163, $174 and stoploss below area is $117. The Major Support Area is $101—$111 and Dynamic Resistance of ATH area is $293. My Long Position Target areas $210, $253, $293 and Incredible Price Target $333 areas in 2026
My Previous Long Setup will Hit $228 and complete my Trades. you can see my Previous analysis on this chart and now Waiting for confirmation of golden zone of Golden Fibonacci tool areas.
#Write2Earn #BinanceSquareFamily #Binance #SOL #SUBROOFFICIAL
Disclaimer: This article is for informational purposes only and does not constitute financial advice. Always conduct your own research before making any investment decisions. Digital asset prices are subject to high market risk and price volatility. The value of your investment may go down or up, and you may not get back the amount invested. You are solely responsible for your investment decisions and Binance is not available for any losses you may incur. Past performance is not a reliable predictor of future performance. You should only invest in products you are familiar with and where you understand the risks. You should carefully consider your investment experience, financial situation, investment objectives and risk tolerance and consult an independent financial adviser prior to making any investment.
SOLANA SOLUSDTSOLANA bullish catalysts
Approval of Spot Solana ETFs: The US Securities and Exchange Commission (SEC) is expected to approve spot Solana ETFs imminently, potentially by the end of October 2025. ETF approval tends to open the doors for mainstream institutional and retail investors, likely injecting billions of dollars into SOL's market and significantly boosting demand and price.
Alpenglow Upgrade: Solana's upcoming Alpenglow network upgrade, projected for Q1 2026, will transition Solana from proof-of-authority to proof-of-stake consensus. This upgrade is expected to boost transaction speeds to over 100,000 TPS and improve network scalability and security, supporting broad adoption and enhancing Solana's competitive edge over other blockchains like Ethereum.
Strong On-chain Metrics and Institutional Adoption: Solana exhibits robust on-chain activity—65,000 transactions per second, $9.3 billion total value locked (TVL) in DeFi, and 32 million unique wallets. Institutional holders currently own approximately 13 million SOL, reflecting growing confidence by major players including Visa and PayPal.
Macro-Economic Tailwinds: Expectations of Federal Reserve rate cuts encourage appetite for risk assets like crypto. Alongside improved liquidity conditions, this sets a favorable macro backdrop for SOL's price appreciation.
Whale Accumulation: Recent price dips saw large holders ("whales") increase their Solana holdings substantially.
Market Position and Ecosystem Growth: Solana is a leading smart contract platform with rapid development, high developer engagement, and dominance in niches like DeFi and NFTs, strengthening its growth potential.
I dont know what else to say other than Solana crashing is coming
key demand floor
@supplyroof break and close new demand floor 211.45
@130.2- @129.5
@76.71 my choice
layer by layer.
@41.52
#solusdt #solana #crypto.

SOL: Stability in ChaosSince October 7, the Solana market has been in turbulence, with drawdowns, sharp reversals, and liquidity spikes. But it’s in periods like these that a systematic approach proves its strength. I opened the first entry on October 7 and closed it at the second take-profit level with modest 1.5x leverage. Then came a pause, and on October 13 I entered again without leverage, cautiously, locking in about 1.5% profit. It was already clear the strategy works even in a turbulent phase. When the next move began on October 16, I followed my proprietary system. The trade unfolded cleanly along the structure: four consecutive take-profit levels, about 7% profit with 2x leverage. Discipline and visual control of levels is what prevented losses.
On TradingView, over 90% of successful traders use multiple indicators at the same time, but the key is always the same: the ability to spot patterns and ignore noise. This systematization makes trading deliberate rather than an emotional chase.
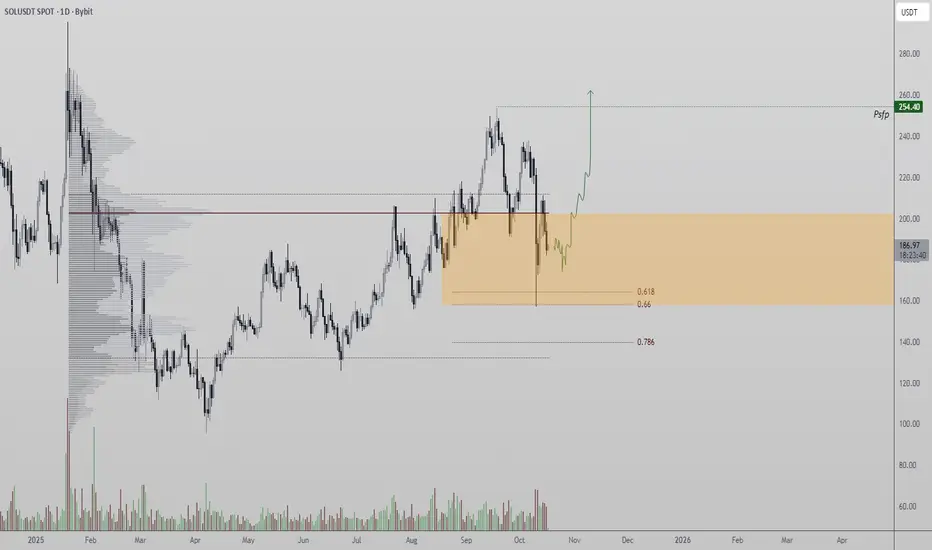
Range-Bound Between 0.618 Fibonacci and POCSolana is currently oscillating between the 0.618 Fibonacci retracement and the Point of Control (POC), forming a tight consolidation range. This zone continues to act as both support and accumulation territory for traders anticipating the next breakout.
Key Technical Points:
- Support: 0.618 Fibonacci confluence
- Resistance: POC zone
- Bias: Re-accumulation range formation
This controlled ranging behavior indicates a potential re-accumulation phase, where smart money absorbs supply before attempting a breakout above the POC. Sustained trading within this range builds a strong structural base for future continuation.
Should Solana reclaim the POC on a closing basis, a move toward higher regions becomes increasingly likely, with targets aligning to previous structural highs.
Until then, Solana remains range-bound but technically constructive, with the 0.618 region serving as a clear accumulation floor.
DeGRAM | SOLUSD held the support line📊 Technical Analysis
● SOL/USD found support near 187 after a sharp correction, rebounding from the intersection of dynamic and horizontal trendlines.
● Price structure suggests the formation of a bullish recovery pattern within a descending channel, targeting 210–220 as the next resistance zone.
💡 Fundamental Analysis
● Solana maintains strong network momentum with rising developer activity and stable DeFi inflows, supporting renewed investor confidence.
✨ Summary
● Long bias above 187; objectives 210–220. Rebound from key support and improving ecosystem fundamentals favor medium-term upside.
-------------------
Share your opinion in the comments and support the idea with a like. Thanks for your support!

TA on SolanaWeekly chart shows CRYPTOCAP:SOL hitting major support. We need to stay above these levels to avoid dropping further.

SOLUSDT – Weak rebound, bears back in controlAfter a sharp drop on October 14, Solana made a slight recovery but quickly hit resistance at the downtrend line — where sellers stepped back in strongly. The $208 zone continues to act as a tight lid on price action, signaling that current buying pressure isn’t strong enough for a reversal.
With U.S.–China trade tensions still simmering, the overall crypto market — including SOL — remains under pressure. If the price fails to break above this descending trendline, SOL could likely fall back toward the $188 support zone, or even $175 in the next move.
In short, the main trend remains bearish, and current rebounds look more like opportunities for sellers to reload for the next push downward.

Solana Ready for Bullish ContinuationSolana demonstrates a constructive market posture with evidence of renewed accumulation following its recent corrective phase.Price activity indicates that buying momentum is gradually strengthening as liquidity continues to shift from weak hands into strategic positioning.The market structure shows improving stability,with compression patterns hinting at an impending expansion cycle.Sustained absorption near recent lows underscores growing institutional participation,reinforcing the probability of continued upward repricing.Trading volume remains consistent,reflecting controlled demand rather than speculative inflow.The overall market tone supports a constructive bias,with expectations aligning toward a progressive recovery phase and potential continuation of the broader bullish trajectory.

$SOL (DAILY): double PIVOT ZONE, KEY TESTCRYPTOCAP:SOL finally in a perfect spot for a POTENTIAL REVERSAL to the upside.
First of all, still a downtrending asset, but it's declined enough to start watching it closely, it just had two BULLISH retests of a nicely confluenced support level of 200 MA + an ASCENDING TRENDLINE. Also near the typical 0.786 fib retracement level ($178).
This last bounce could become a HIGHER LOW, so I'm watching the volumes for a confirmation, nothing bullish yet, but at least the selling has been easing off.
#solana will become BULLISH again above $206 and above $218, I will personally wait for a true market verification during the weekdays, apparently the #ETFs have been approved. This could be a bit of a 'sell-the-news-event'.
Break below that stacked support area with volume would suggest a BEAR MARKET for SOLANA. Just my 2 cents.
💙👽

[SeoVereign] SOLANA BEARISH Outlook – October 18, 2025Today, as of October 18, I would like to share my bearish outlook on Solana.
This analysis is based on two main factors.
First — Bearish Bat Pattern
Currently, Solana has entered the PRZ (Potential Reversal Zone) of the BAT pattern.
This zone is typically regarded as a classic reversal area where selling pressure intensifies
after an excessively extended upward movement.
In particular, weakening buying momentum is observed on short-term candlestick charts,
gradually increasing the possibility of a downward reversal.
Second — Bearish 1.13 Shark Pattern
The Shark pattern, introduced by Scott Carney, is a variation of the harmonic pattern.
The 1.13 zone generally acts as a short-term overbought and exhaustion area,
often marking points where bearish reversals frequently occur.
Currently, the price is approaching this 1.13 extension zone,
which can be technically interpreted as a region with a strong likelihood of a bearish reversal.
Accordingly, the average target price is set around 176.77 USDT.
Depending on future chart developments,
I will continue to provide updates regarding position management and any changes to this outlook.
Thank you.
