SOL: chart on the background of the news!Greetings, colleagues 😊💻
It's time to🔎 look and disassemble the charts coins SOL
A lot of positive news has been 📅 coming out recently , and thus may attract more and more buyers of this asset .
💡 For those who are not engaged in investing, but in extracting medium and short-term profits, I recommend that you always rely on graphical data, rather than on the news background (which is often misleading and forces you to make decisions based on emotions)
🚩 A few technical characteristics of this coin, for those who just came to the market
Ticker: SOL (Solana)
Current price (at the time of publication): 194.53$
Market capitalization: $106.93B (ranked 9th)
⭐ Solana - is a high-performance blockchain built for scalable decentralized applications (dApps), DeFi, NFT and Web3
Average commission: <$0.00025
Consensus: A combination of Proof of History (PoH) + Proof of Stake (PoS)
Network launch: March 2020
Founder: Anatoly Yakovenko (former Qualcomm engineer)
PoH is a unique time—binding mechanism that allows validators to process transactions without constant synchronization. This is Solana's "secret weapon" against Ethereum and other L1s.
↗️ From the latest news:
▶ The first American spot ETF on Solana — Bitwise Solana Staking ETF (BSOL) — on the first day of trading, the fund raised $69.45 million, and its net assets reached $289 million.
The fund's share in Solana's market capitalization was 0.27%.
▶ Fidelity has added support for CRYPTOCAP:SOL for American clients.
▶ VanEck has submitted an updated version of the S-1 application for the spot CRYPTOCAP:SOL ETF.
▶ Grayscale has registered a CRYPTOCAP:SOL ETF in Delaware. This is the first formal step that companies usually take before filing a formal application with the SEC.
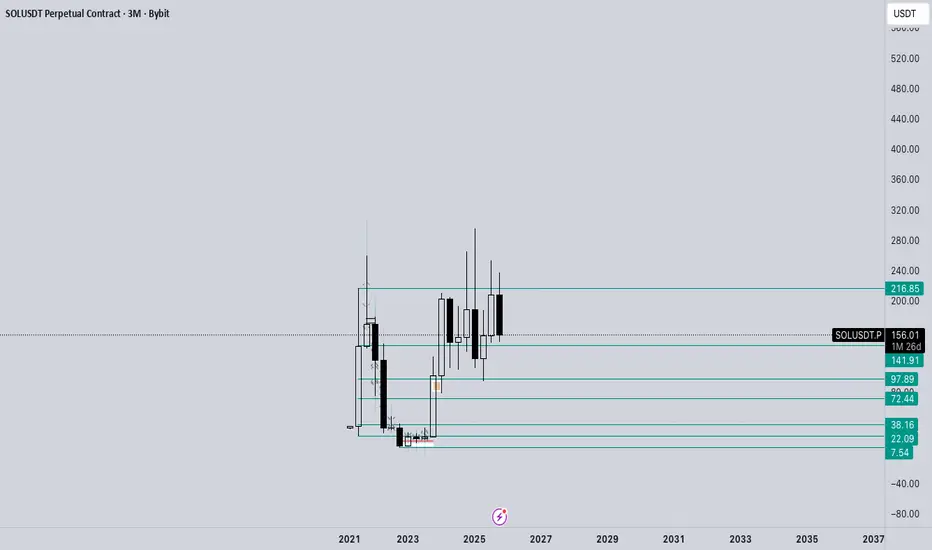
📊Technical picture:
🗓 Let's start the analysis with the quarterly chart (3M):
one of the significant advantages is that the price is trading above the annual opening mark ($189.31)
📎 Also, before the last increase, the price removed liquidity from the $ 110 mark and, according to the Fibonacci grid, the correction was in the OTE zone (0.62 - 0.705), which is quite a "healthy" correction for continued growth.
There is a liquidity zone on top - this is ATH - $295.83, which may become the first target for an upward movement.
📎 If we take into account more global goals, then we are guided by the extended Fibonacci grid ... 373$ … 474$
🗓 Weekly chart: the structure is ascending, but the open liquidity points of $155 and $126 are "confusing" from below
🗓 On the daily time frame: the trend is in a downward movement, now we are seeing a correction to the wave of decline, liquidity is forming on both sides
one of the options is to allow the price to go down and collect orders with a shadow, remaining in the range of the trend line (if the price is not held = $ 133)
🤔 I'm still waiting, I need to see the withdrawal of liquidity in order to understand which way the asset is going first
↗️ With growing institutional interest and technological improvements ahead, SOL remains one of the top candidates for the 2025-2026 altseason.
SOL is a mature ecosystem with real demand, infrastructure, and vision. It's wise to keep it in a briefcase. Trade cautiously, but actively 😊
Always calculate the risks and make informed decisions
Good luck to all! 🍀
Trade ideas

SOL (31/10/25 - Long position) TP1($189.98) - filled "Single Prints" from 30/10/25
TP2($193.64)- confluence (Oct. POC + weekly VWAP + previous week VAH + crucial Fibonacci on 4h time frame), good level to Scalp short if not crazy buying volume (depends on the context)
TP3($199.99) - psychological level, October's VWAP, weekly POC, 4h time frame fibonacci confluence
SL($175.00)

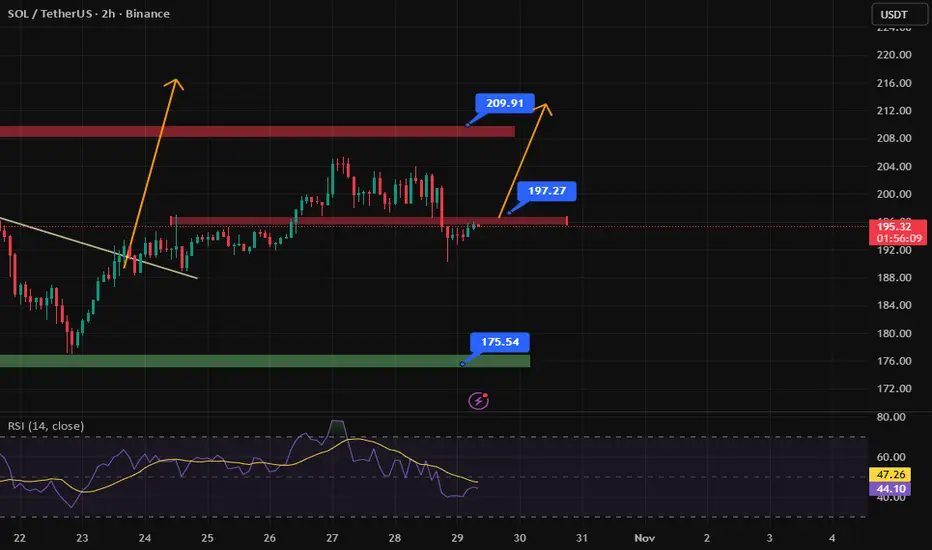
SOL-USDTWith the correction of Bit
Solana also came to test $175 once again and this support prevented the correction well again 🕯🕯
If nothing special happens in the crypto market, it can continue to rise like a flash towards $197-200

sOL-USDTSolana could still break its resistance at $197 and make a new leg towards $209.
Watch for longs

SOLUSDT – Bullish Trend Supported by Technical Structure and NewAfter a brief correction, SOLUSDT is showing strong signs of a continued upward movement. The ascending triangle pattern on the H4 chart indicates that SOL is building a solid base, with higher lows and testing the resistance at 200.00 USD. The price is currently above the EMA34, signaling strong buying momentum.
Notably, the price has recently broken through the important 200.00 USD resistance and is now approaching 216.00 USD. If SOL continues to hold above the 200 USD mark and confirms further upward movement, the next target would be 216 USD.
With positive news surrounding Solana and increased investment interest, SOL is likely to maintain its bullish momentum in the short term.
Strategy: Buy around 200.00 USD, target 216.00 USD, stop loss below 195.00 USD.
Summary: The short-term bullish trend remains strong, and SOLUSDT may reach the 216 USD target if it holds above the 200 USD support level.

SOL-USDTThe support level at $197 has been broken and will now act as resistance for Solana 🔽
So Solana needs to consolidate above this resistance to climb back to $210.
$solana long
### 🟢 SOLUSDT | 15-Minute Long Setup - Awakening from Accumulation
**Concepts: ICT | SMC | Bill Williams**
SOL is showing a compelling bullish structure after a period of consolidation. The price is currently testing the convergence point of the Bill Williams Alligator, indicating the market is "waking up" from its sleeping phase. The alignment of the Lips above the Teeth and Jaw suggests the beginning of a new bullish impulse.
**ICT & SMC Perspective:**
* **Liquidity Sweep & Demand Zone:** A clear sweep of sell-side liquidity occurred below **194.91**, tapping into the previous demand zone and creating a mitigation block. The subsequent rejection confirms buyer presence.
* **Break of Structure (BoS):** The swing high at **~196.07** has been breached, confirming a minor bullish shift in market structure.
* **Fair Value Gap (FVG):** The strong bullish move from the lows has created an FVG which the price is now retesting, offering a potential premium entry for longs.
* **Targeting Liquidity:** The next significant pool of buy-side liquidity rests above the **207.88** swing high.
**Bill Williams’ Alligator Confirmation:**
The Alligator is perfectly aligned for an upward move:
* **Lips (195.24) > Teeth (195.03) > Jaw (194.91)**
* This alignment, with price trading above all three, signals the Alligator is "awake" and hunting to the upside. The expanding mouth confirms building bullish momentum.
**Trade Plan:**
* **🟩 Entry:** On retest of the Alligator confluence zone (**195.20 - 195.00**) or a break above the local high (**196.10**).
* **🔴 Stop Loss:** **191.50** (below the Jaw and the recent liquidity sweep low).
* **🎯 Take Profit 1:** **202.00** (Previous resistance)
* **🎯 Take Profit 2:** **207.88** (Key swing high and liquidity target)
**RRR > 3:1**
**Conclusion:**
With a successful liquidity sweep, a confirmed Bullish BoS, and the Alligator fully aligned and awake, SOL is poised for a move toward the **202.00 - 208.00** resistance zone. Longs on a retest of the Alligator support offer a favorable risk-reward opportunity.
---

SOLANA - SHORT - THE WICK AND THE WHISPERTraders,
This is how I see SOL.
1. The level I care about
For me the key area is 205 to 207. Call it VAH, call it range high, call it supply. It is the place where price got stuffed before and where a lot of trapped memory lives.
What I expect is simple.
Wick it. Slip it. Fade it.
In other words I am looking for SOL to run into that 205 to 207 pocket, spike through it, clean the liquidity resting above those highs, and then fail to hold. That failure after the wick is the trigger for me. That is where I want to be heavy.
If SOL trades above that range high and then instantly falls back inside, that is a swing fail pattern at the high of the range. That is the same story I am hunting on BTC at 117.5k. Liquidity first, conviction second.
2. The downside path
If the wick and slip happens, my downside path is not small. My next meaningful target sits all the way down at 150 to 155. That zone is not just a guess.
It is where the last real demand block sat before we impulsed higher.
It is also where liquidity was never fully re balanced after the violent breakout.
Call it unfinished business. Call it imbalance that still needs to close.
The market eventually comes back to drink from the well it skipped.
3. Now we look under the hood
Price has pushed up into 200 again, yes. But the flow behind the move tells a different story than the candles.
Spot CVD
Spot CVD is bleeding down hard. Real buyers paying cash are not supporting this move. Spot is distributing into strength, not accumulating under it.
Stablecoin margined CVD
Stablecoin perp flow is also down. That means most of the USDT perp side is either taking profit into this move or outright selling into it. They are not chasing it. They are leaning against it.
Coin margined CVD
This is the biggest one. Coin margined CVD is aggressively down. That tells me coin collateral traders are smashing into the bid, basically leaning short into this push.
So ask yourself. If spot is selling, and perp flow is selling, and coin margined flow is selling, then why is SOL still pressing up
4. Open Interest is the answer
Stablecoin OI is grinding up.
Coin margined OI is going vertical.
That means positions are being added at the top, not closed. New size is entering into this level.
When coin margined OI spikes like that while coin margined CVD is negative, the usual read is this. People are opening fresh short exposure using SOL itself as collateral, hitting the bid all the way up, and still not getting the breakdown.
They are trying to fade the move. The move refuses to die. That is short fuel.
This is why SOL can still squeeze into 205 to 207. Shorts are stepping in early, and if you squeeze them one more time you get the wick.
But here is the catch. After the wick and slip, once that last round of shorts is blown and once fresh late longs FOMO in above VAH, there is nothing under price.
Spot buyers did not build a floor.
Perps did not build a floor.
The whole thing is hollow.
That is how you get air pockets.
5. How I am trading this
I am not here to wave a bull flag or scream bear. I am not interested in labels.
I am here to execute around the level.
My plan is to stalk shorts on a failed breakout of that 205 to 207 key. I do not need to nail the exact top tick. I want to see the wick into VAH, and then the rejection back inside the range. That is my trigger to build size.
Will I hold it all the way to 150 No blind loyalty. But that is where I believe the next true re balance sits, and that is the map I am working with.
If SOL breaks through 207, accepts above, and starts building structure above VAH, then this idea is invalid. I step aside. No ego. Survival first.
6. Summary
SOL is approaching a thin ceiling where liquidity sits. I believe we get a final run of that high near 205 to 207, a wick and slip, and then rotation lower. The flow supports that view.
Spot is not bidding.
Perps are selling into the move.
Open Interest is exploding at the highs.
That is the recipe for a squeeze candle into resistance, followed by a rug.
My destination if this plays out is 150 to 155, the next pool of imbalance where the market still owes a visit.
The chart is loud, but the flow is louder.
The candles brag.
The data whispers.
I listen to the whisper.

Solana is still within range... SOL just got some bullish news with a Western Union relationship. Could this be a catalyst that will allow the PA to exit the range? The current upward channel has been respected on the D1, although the trend has been our friend; trendline liquidity has been building. Regardless, the SOL price is at an important POI.

SOL Consolidation — Watching 218 Target or 193 PivotLast week, the price also followed our orange plan. Right now, it’s in a phase of local consolidation.
If the descending trendline breaks, the price is likely to continue rising toward the 218 target. If the local low breaks instead, a correction toward the weekly pivot point at 193 is possible — I expect to see a bounce and a quick recovery from there; otherwise, the price may continue falling toward the ascending trendline .

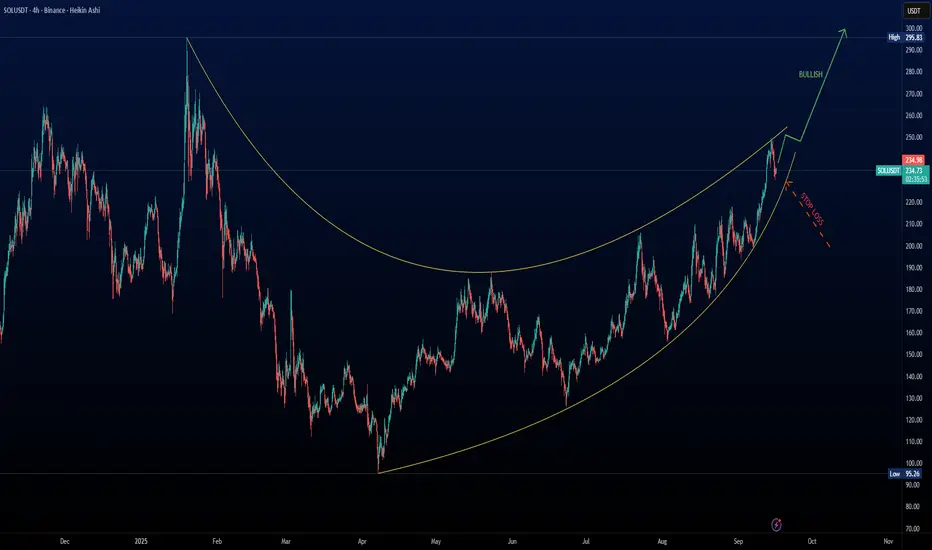
Bullish Momentum Building for Solana (SOL) – Targeting $300!Solana (SOL) is showing strong bullish momentum on the 4-hour chart. The ascending curve pattern suggests a continuation of the uptrend, with price currently hovering around $234.87 and a projected move toward $300 .
🔍 Key Highlights:
Strong Uptrend: Higher highs and higher lows confirm bullish structure.
Technical Setup: Ascending pattern with clear breakout potential.
Target: Price projection points toward $300.
Risk Management: Stop loss level marked to protect against reversals.
This setup offers a great opportunity for swing traders and crypto enthusiasts looking to capitalize on Solana’s momentum. Stay tuned for updates and trade smart!
SOL-USDTSolana's reaction to the $196 support I mentioned yesterday
How cool and cool it was
He reacted exactly to it 💎📊
The real growth is when it can break the $209 resistance

Solana Still ChillsSolana continues its correction phase. I am expecting a move toward 190 now
The invalidation zone for this scenario is marked on the chart

$SOL - LONG - ABOUT TO POP?Analysis:
Following up on my Oct 14th BTC note — “Wait for arbitrage to balance spot markets” — we’re now nearing that blue box. As BTC approaches equilibrium, I’m eyeing CRYPTOCAP:SOL for a clean long setup.
Here’s why 👇
AVWAP Confluence Zone:
We’ve got the lower band of a HTF auction colliding with the VWAP line from another HTF auction — strong mean reversion and liquidity overlap. (Didn’t draw them out to keep the chart clean.)
Fibonacci Confluence:
A completed AB=CD right at 175.0, perfectly inside the HTF golden pocket (0.618). That’s a key structural retrace aligning with measured move completion.
Bullish Harmonic (4H):
A textbook bull harmonic forming — early signs of reversal pressure building.
No position yet. Waiting for SOL (CME) to close the gap at ~174.7 — that’s my trigger to go long.
🎯 Target: 223 — with a possible sweep of the 229–230 zone where shorts are stacked. Expecting a short squeeze flush through that region.
Seeing solid order flow confluence across the board.
Will update this post as things unfold.

sol-usdtThe two-hour timeframe is breaking its own trendline, and if the price can stabilize above $170, the path for continuing the rise towards $180, which is the second trendline, will be clear 💎💰Currently, Solana's support is at $160 ✔️🚀

SOLUSDT 1H | Bullish Continuation Setup following last weeks reversal , we have a continuation setup here
🟢 Market Structure
Price trading above Alligator (166.81 > 165.76 > 164.27)
Bullish alignment intact with expanding mouth
Weekly sell-side liquidity taken below
🔵 Alligator Support Levels
Lips: 166.81 (immediate support)
Teeth: 165.76 (primary support)
Jaws: 164.27 (strong support)
🎯 Entry Zones & Targets
🟡 Primary Entry: 166.80 - 167.20 (Lips retest)
🟠 Secondary Entry: 165.70 - 166.00 (Teeth retest)
🔴 Stop Loss: Below 164.00 (Jaws break)
💰 Take Profit Targets
TP1: 168.21 (immediate resistance)
TP2: 175.00 (marked resistance)
TP3: 180.00 - 185.00 (momentum extension)
⚡ Trade Management
Scale entries on Alligator retests
Move SL to breakeven at TP1
Trail stop for TP3 runner
Bullish continuation active - buying dips toward Alligator support

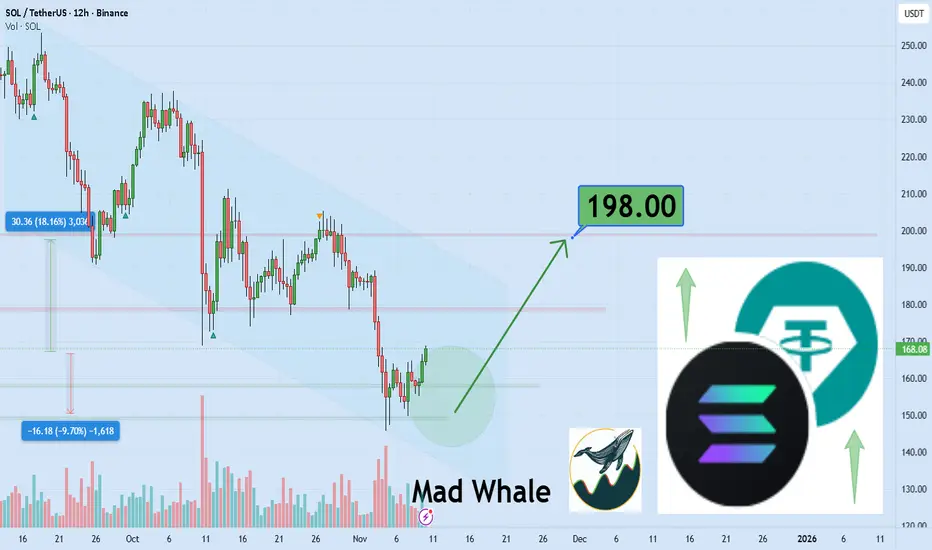
SOL is going to breakout from descending channel 18% gain,to198$Hi the support and resistances on the chart are based on the previous data and weekly candlesticks if BINANCE:SOLUSDT holds this last support the potential of 18% gain is logical toward 198$
SOLUSDT BUYSOLUSDT- 4H (HEAD AND SHOULDERS)
It had a beautiful retest of the neckline with a BULLISH ENGULFING big buy signal.

SOL.USDT MARKET ANALYSIS Sol is currently facing a resistance, A breakout we may see an uptrend keeping watch

SOLANA WILL BE HIT 360$ in SEP if regain up to 180$ this weekmarket need to put hunt on buyer leverage and get new entrance around139$ to 150$ best trigger for entrance in solana in this 2 day ahead for week candle. if price stand up to 180$ this will make huge run to 360$ in this cycle.

SOLANA (Short position) 8/11/25Take Profit - Fibonacci Confluence (x4) + 7/11/25.VAL + 6/11/25.Buying tail
Stop Loss - Fibonacci Confluence (x4) + Nov.25' VAH

SOL Short SOL Short 📉
In the medium term, I am bearish.
Rebalancing the bearish inefficiency (POI) is likely to lead to continued aggressive markdowns, which can be used to open a short position.

SOL - Ranges overview Let's have a look at SOL and its current trading range.
I know a lot of you young traders are still hyped and enjoy trading SOL so I'll give you my take on it.
Personally, I've never had a stake in it and don't plan on getting any merely based on the fact that since its inception a hyped fueled and based crypto - BUT for the sake of trading let's have a look at the chart.
We are currently trading back towards the sellside liquidity sitting around 140$.
IF we fail to hold it expect some more pullback towards 120-100$.
IF we hold the 140$ sellside liquidity range (and BTC manages to reclaim 150K) expect SOL to aggressively retrace towards 216$.
As always PATIENCE...PLAN AND EXECUTE.
Stay safe and never risk more than 1-5% of your capital per trade. The following analysis is merely a price action based analysis and does not constitute financial advice in any form.