SOL 02.10#SOL
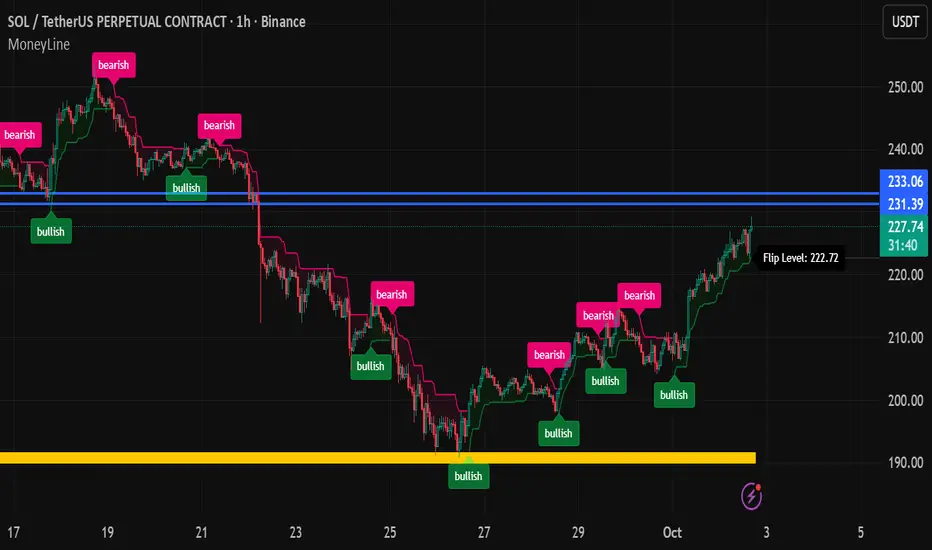
Easily broke out of the VAH local range since September 22. A possible retest of 221-222 could propel us further; I don't see any significant weakness on the indicator.
There are no serious resistances at all. The closest possible ones, from which we could react, are 235-240, 253-256, with liquidity at 273 and ATH.
Support zones:
221.5-222
215.1-215.7
207-210
Resistance zones:
207-210
234.2-234.7
238.4-240
SOLUSDT.P trade ideas
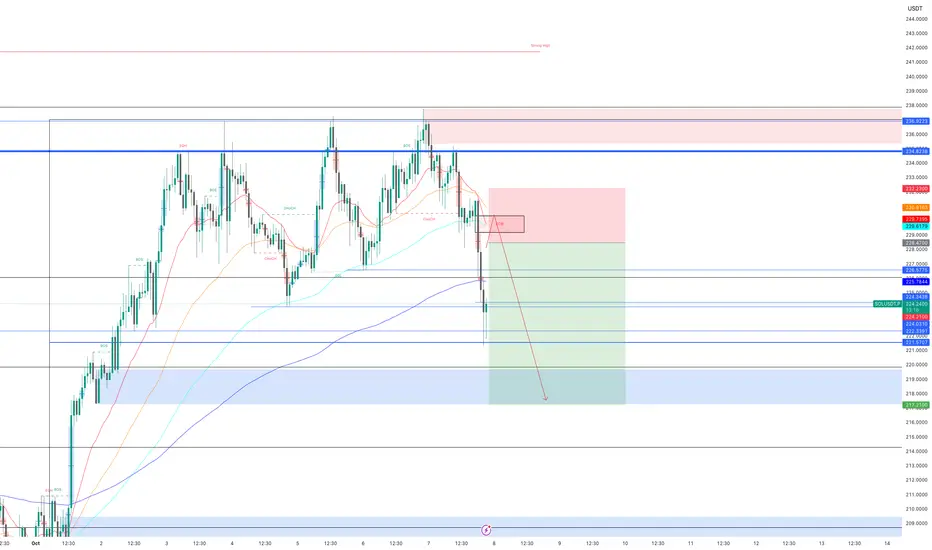
[SeoVereign] SOLANA BEARISH Outlook – October, 03 2025The basis for presenting a bearish perspective in this idea is that an arbitrary wave m has formed a 1:1 length ratio with another wave n.
In addition, the Crab pattern at the 1.618 level has also been fully confirmed, further supporting the possibility of additional downside.
Accordingly, the average target price is set around 212.94 USDT.
Additional briefings will continue to be updated in this idea as the chart develops.

Solana rising wedge tests trendline support ahead of macro catalStructure: After a strong multi‑month rally, SOL is coiling in a rising wedge. The price sits above a key ascending trendline but below a descending resistance line from its recent peak.
Momentum: Moving averages are converging and volume has tapered off, suggesting momentum is slowing.
Key triggers: A clear breakout above the descending resistance would signal renewed strength; a breakdown through the trendline could extend the pullback toward lower support.
Risk factors: Macro events—non‑farm payrolls, the monthly inflation report, and the late‑October Fed meeting—may trigger volatility across markets.
Trade idea:
Bullish: Wait for a daily close and retest above the wedge; use stops below the recent swing low; aim for the next major resistance zone.
Bearish: Watch for a close below the ascending trendline; short a retest of that level with stops above; target the next demand area.
Reminder: Manage risk carefully and adapt as market conditions evolve.
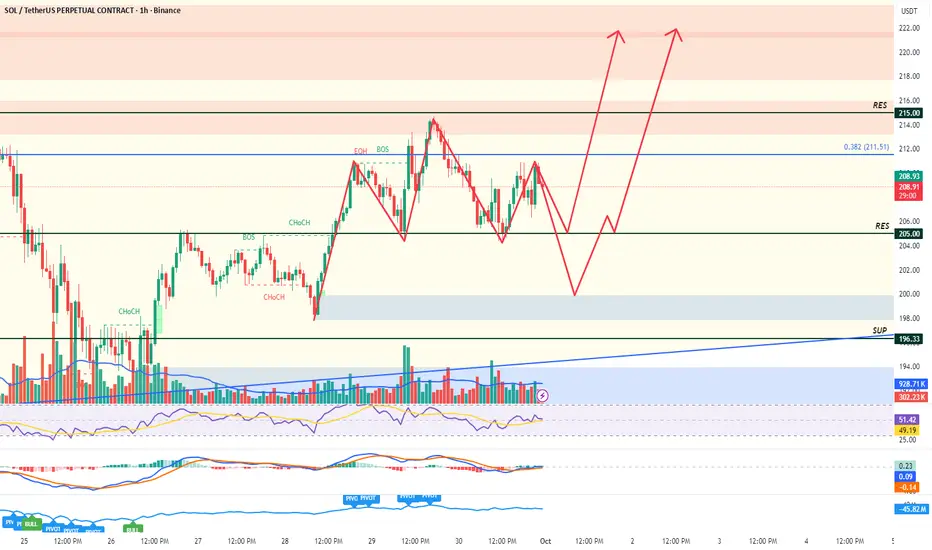
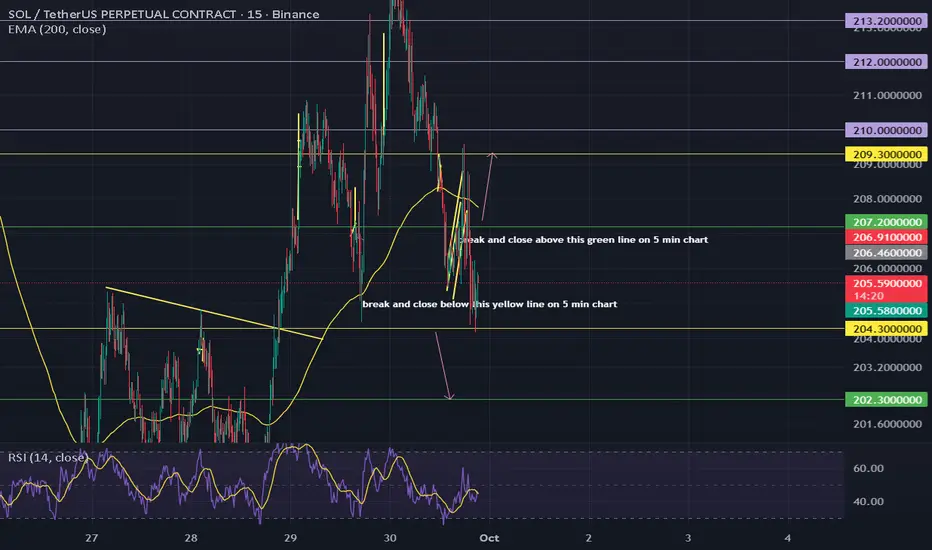
Immediate pullback followed by a runI see two possible outcomes here. Either we hit resistance at 205 and bounce to 220ish area or we break resistance and head towards 198 before we make the next move up. NFA. Happy Trading!
scalp your soulWait for the trigger. Do not pre-empt the breakout. The market is currently consolidating and chopping. The 1% move becomes "almost 100% certain" (in trading terms, meaning highest probability) only once one of these channel boundaries breaks on high volume.
Monitor Open Interest and Funding Rates as the move begins. A sharp drop on the short entry or a significant rise on the long entry will confirm the leveraged market is participating in the move.
[SOL] ATH HuntingAfter massive liquidations on the crypto space, I am willing to add to my long here and definitely on CRYPTOCAP:SOL since it's my biggest position (and winner).
Great Trade !
Sol market snapshotIf SOL cannot break above 245, there is a chance of forming a reversal pattern — Head and Shoulders (H&S). The right shoulder should not exceed the head.
Main conditions of the Head and Shoulders pattern:
Three peaks:
Left shoulder — the first local peak formed after the price rises.
Head — a higher peak following the left shoulder.
Right shoulder — a peak approximately at the same level as the left shoulder, formed after the decline from the head.
Neckline:
Connects the lows between the left shoulder and the head, and then between the head and the right shoulder.
The neckline can be horizontal or slightly sloping.
A break below the neckline confirms the pattern and signals a potential price decline.
Volume:
Volume is often high at the left shoulder, may be higher or lower at the head, and usually decreases at the right shoulder.
Declining volume during the formation of the right shoulder strengthens the bearish reversal signal.
Movement after the breakout:
After breaking the neckline, the price is expected to fall approximately the same distance as from the neckline to the head’s peak.


SOL LONG : Time for $300?Pullback to 0.618 fib complete.
Looks like it's time for another leg up. Is it time to test $300 for SOL?.

Posted Solusdt for yall check my recent post When I posted SOL some said it won't happen that crypto if going up
And here we are
I'm entering the weekend with mad profit and if you took the trade when I posted it
Congratulations🩷💥💥💯

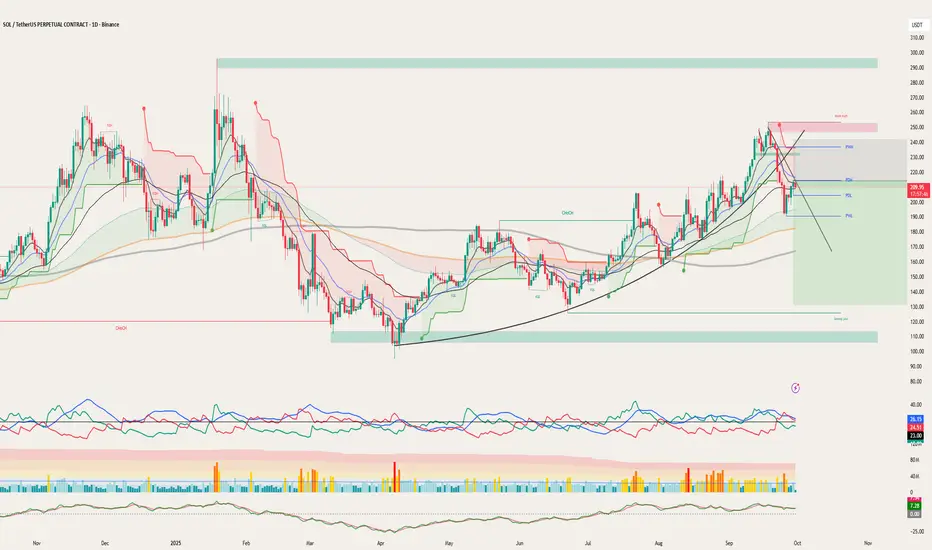
SOL - PERFECT PLAY.#SOL - MEDIUM TERM OUTLOOK - ON POINT 🔥📉
7.5% dump since this update.
Zooming on my macro time frame view, this could be the final dump before to see a huge move upward! 📈
(valid if 196 - 198$) act as key support.
Level by level.
Local support: 205 - 206$. (expecting some bull reaction soon, likely before the next dump?).
Also Keep an eye on the daily uptrend. 👀

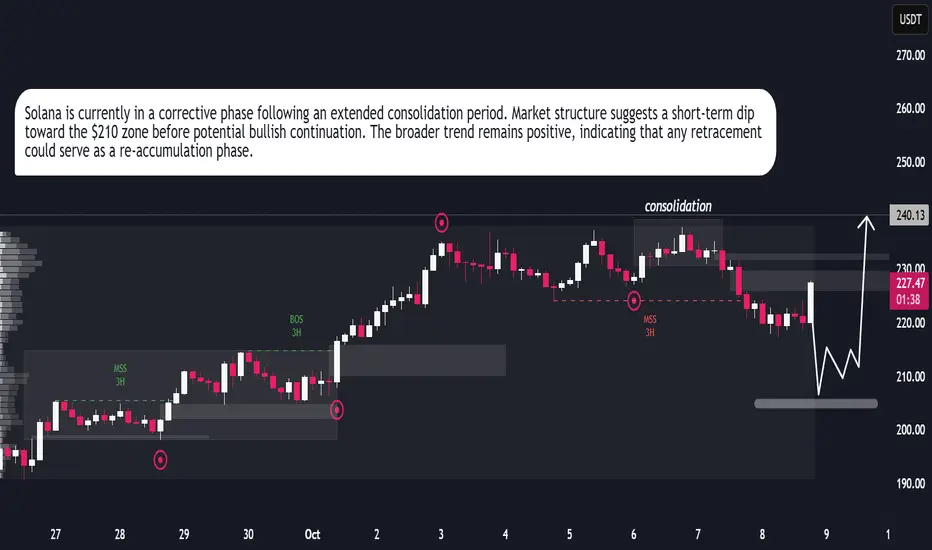
SOL | Network Strength Meets Market MomentumSolana (SOLUSDT) continues to show resilience as both technical and fundamental factors align for potential upside. On the technical side, the market has completed a controlled correction phase, suggesting liquidity buildup below recent lows. The structure remains bullish, with increasing volume and price stability hinting that buyers are regaining control. Fundamentally, Solana’s network growth and strong developer activity have reinforced investor confidence, supported by rising on-chain activity and ecosystem expansion in DeFi and NFTs. This combination of solid fundamentals and technical structure indicates the possibility of another bullish leg, with SOL positioning itself for a gradual climb toward the $240–$250 range in the near term.
Bounce from 215 area before the run!So from what I can see based on liquidity heatmaps and market sentiment right now. Looks to me that we'll pull back to around 215 or so then run hopefully with tomorrow's ETF approval and rate cuts at the end of the month.
coinank.com

SOL Chaser?🧩 Every candle is another clue in the ever-changing puzzle.
🔥 CRYPTOCAP:SOL continues to ride hot narratives—first memecoins, now tokenized stocks. Momentum never sleeps.
💵 SOL/USD:
Flipped key resistance into support.
March 2024 ATH at $210 now acting as a floor, with a retest on the horizon.
Current resistance sits near $228.
📌 Game Plan:
No adds yet. Waiting for that $200–$195 demand zone, a cluster of swing highs, swing lows, and weekly closes. That’s where the real decision point lies.
🚨 Until then, patience. The next big move will be built on these levels.

SOL – Everyone’s Bullish. I’m Not.When everyone’s screaming ‘alt season,’ I’m watching structure.
SOL just gave me what I wanted —
a clean retracement, rejection at key resistance, and confirmation of weakness.
That’s not hype. That’s setup.
Structure break ✅
Lower high formed ✅
Clear entry, tight stop ✅
I’m short here — small risk, asymmetric reward.
If it melts, great. If it bounces, I’m out quick.
Trading isn’t about being right, it’s about being disciplined.
Would you fade this move, or are you still buying the top?

SOL-USDTWithout any leverage and easily breaking the 3% support, you could have gotten TB.
I hope you got it 🙂🔽
The main support is at $215 and then $202 💲

SolFrom when I posted about solana we did good numbers on that
Just a quick reminder to my followers to always secure profits as you go
So you don't get caught if price decides to reverse
SOL Short Idea It seems sol can give a retracement till 208, before the next leg-up. It has formed a bearish engulfing pattern on the 4h tf. On the re-test of the zone I will try a small short.
#NFA
#DYOR
An importance of funding rateSee the chart and check funding rate on your exchange. As soon as exchanges put funding rate to +0.01% price tends to go downwards. So close your long positions during these events.
#trends

SOL/USDTCRYPTOCAP:SOL has clearly formed a double bottom pattern, signaling strong reversal momentum. The target aligns with the end of the blue arrow, and once confirmed, it’s set for an explosive move to the upside.

SOL-USDTFailure to break $265 🔽
And on the other hand above the bottom of $226🔼
Let either the resistance be broken for a buy
Or the support number I mentioned be lost for a sell on Solana 🔽💲

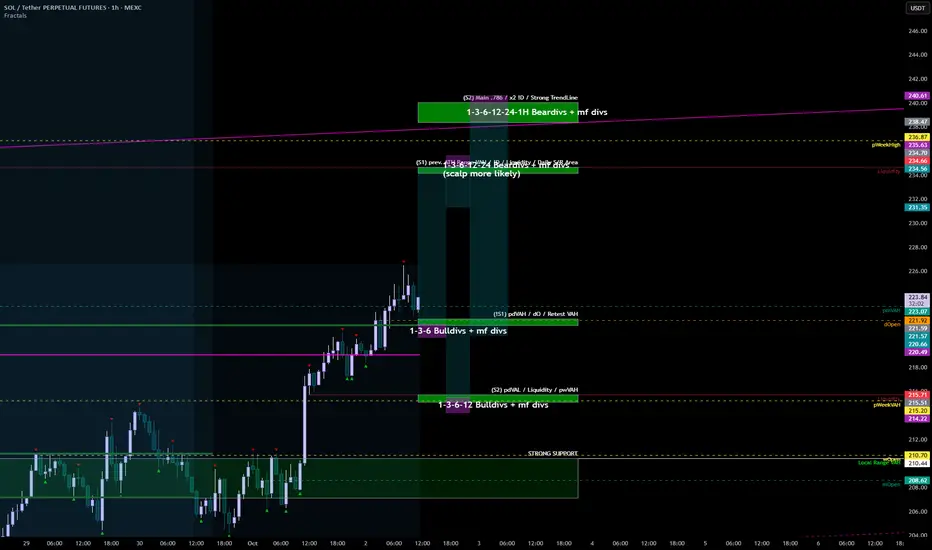
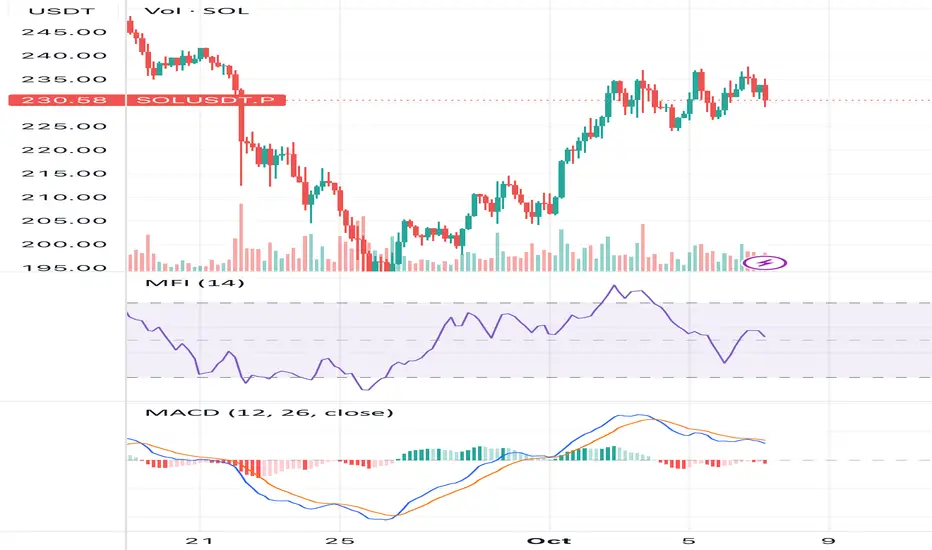
Triggers: 4h-close below 235 and/or < 230.9 (Don20-Mid) with RSIWhat does it mean now
1. The structure is "bullish but thin": the price is at the tops of Donchian/BB/Keltner, ADX ~33 and CMF>0 confirm the trend, but the MACD-hist −0.11, a series of bearish divergences (RSI/MFI/OBV), and a low OI (z −1.34) indicate that the momentum is going without a noticeable set of futures positions.
2. Squeeze ON ~13 bars: the market is compressed, and an impulse exit is likely.
3. Profile: a strong HVN core of 202-208 (POC ~207.9), we are trading above, VAH ~239.7 near the current price → above the supply zone.
4. Premium to VWAP ~+1.1σ: there is upward space, but it is already "not cheap" relative to average demand.
⸻
Key levels
• Resistance: 237.75 (Donch-High 20/55) → 239.66 (VAH) → 244.9–245.0 (LVN-thin zone).
• Supports: 235–231 (BB/EMA20/Don20-Mid 230.9) → 224.0–221.2 (BB-/KC-low) → 207.9 (POC) → 202–208 HVN-cluster → 197.9 (Don55-Low zone of the upper range).
⸻
Scenarios and triggers (not financial advice)
A) Basic — rotation/balance above the averages with a check of 230–232
Why basic: Squeeze ON, MACD goes out, divergences are bearish, and OI is low — more often, the market "chews" the level before choosing a direction.
• Triggers: 4h-close below 235 and/or < 230.9 (Don20-Mid) with RSI<55 / MACD weakening, without OI growth.
• Targets: 231 → 224–221 (edge of bands/channels). Deeper — retest 207–208 (POC/HVN) if the impulse fades.
• Invalidator: quick return and fixing > 237.8.
B) Pulse break-up (Squeeze-release)
• Trigger: 4h-closing > 237.8 + buffer ≈ +0.1·ATR ≈ +0.45$ (i.e. > 238.25) and holding above 237.8 at CMF≥0, OBV↑, preferably OI↑.
• Targets: 239.7 (VAH) → 244.9–245.0 (LVN) → with good OI, expand to higher levels.
• Invalidator: return < 235 on increased volume.
C) Bearish reversal from VAH/Don-High
• Trigger: rebound from 237.8–239.7 with 4h-close < 235, RSI↓, MACD-hist in the red, OI↑ on the red candle (inflow of shorts).
• Targets: 230.9 → 224–221 → 207–208.
• Invalidator: re-capture > 238.3 with OI not falling.
⸻
Tactics (example of logic)
• Pullback long (conservative): monitor demand in 231–232 (candle reaction + CMF≥0, OBV↑). Stop — below 224-221, targets — 235 → 237.8 → 239.7.
• Impulse long (aggressive): after 4h-close > 238.25 (breakdown with buffer), partial fixation at 239.7, trail to 244.9–245.0.
• Countertrend short: only with a clear rejection in the 237.8–239.7 zone + confirmation (RSI/MFI down, MACD-histo < 0, OI↑). Targets are 235 → 230.9 → 224–221; stop is at ~240–241.
⸻
Briefly: what to expect
• Base: consolidation/rotation in 231–238 with a risk of moving to 224–221 until momentum and OI confirm a breakout.
• If we gain a foothold above 238.25, we can expect an upward move to 239.7 → 244.9–245.0.
• If we lose 230.9, we can expect an upward move to 224–221, and if we are weak, we can expect an upward move to 207–208.
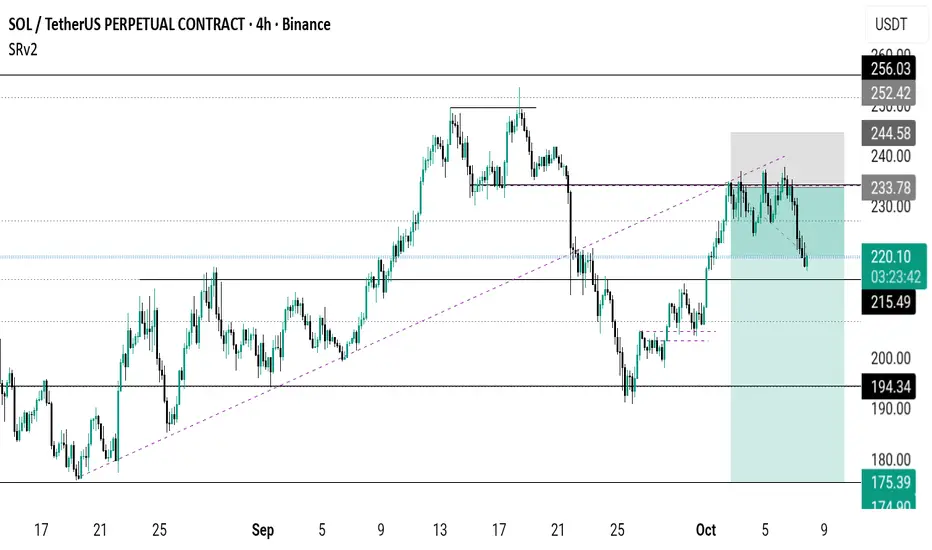
Next Stop for SOLThis is the next area for some consolidation before continuation LOL. Personally not taking profits in this area. That's because of my entry point. (I'm only up 35% at this level) I may pick more up if we can break above $233. Lets go!!