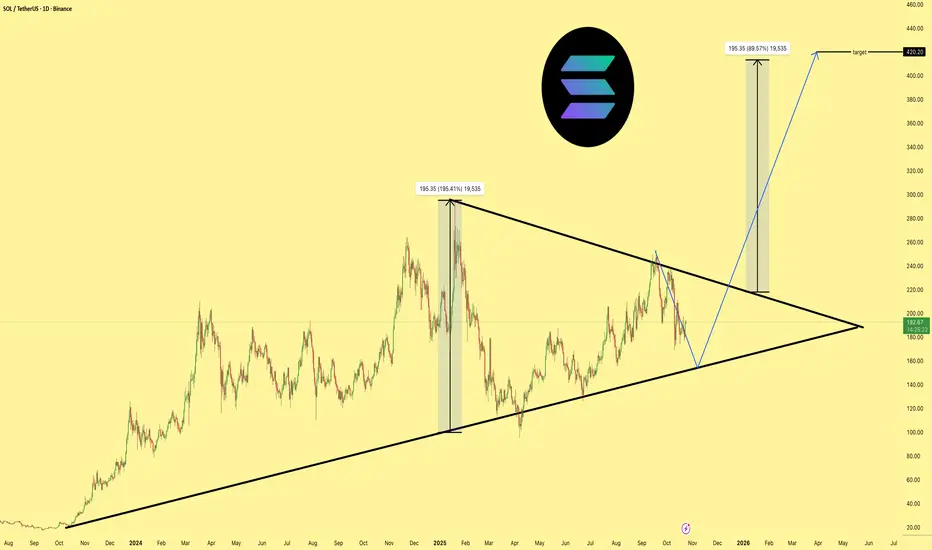
SOLCRYPTOCAP:SOL target remains $420, but there’s still room for a dip toward the $150 zone before the next leg up. Placing limit orders between $130–$160 is a smart move to DCA into your spot position. This strategy helps smooth out volatility and gives you a strong average entry.
Trade ideas
Is A Bullish Crossover Next For Solana Price?Solana’s price stands at $187 at the time of writing, holding firm above the $183 support level. The altcoin remains range-bound, struggling to break through the key $192 resistance. However, price stability above support suggests growing resilience in the face of selling pressure.
If Solana’s bullish indicators gain traction, the price could climb past $192 and target $200 or higher. Strengthening support levels combined with improving investor sentiment could help SOL establish a sustainable uptrend.
Conversely, if momentum fails to build, Solana may drop below $183 to test $175. A further decline could extend losses toward $163. This would effectively invalidating the bullish outlook and signaling continued market weakness.

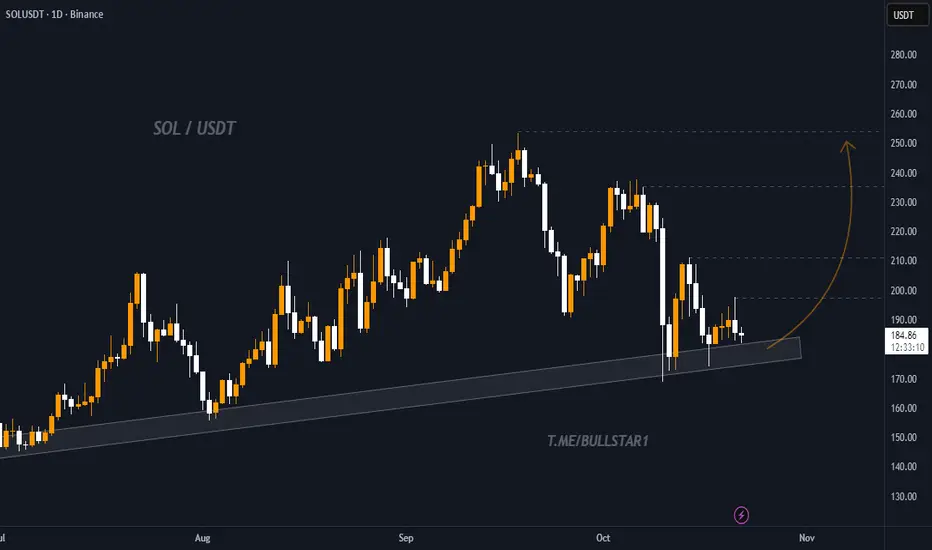
sol-usdtStill below this valid trend line
If it manages to break the trend line
it could continue to climb towards the psychological resistance of $200✔️🚀
Solana’s valid bottom is $175

Risk in Global Market TradingIntroduction
Global market trading has revolutionized the way capital flows across borders, offering investors opportunities to diversify portfolios and seek higher returns. However, with these opportunities comes a complex landscape of risk. In today’s interconnected world, financial markets are influenced not only by domestic economic indicators but also by global monetary policies, geopolitical developments, and systemic events that can ripple across economies within minutes. Understanding risk in global market trading is, therefore, not merely a technical skill—it is a strategic necessity for investors, policymakers, and institutions alike.
Risk in global markets can manifest in numerous forms: market volatility, currency fluctuations, liquidity constraints, credit defaults, geopolitical instability, and systemic failures. Each type of risk interacts with others in dynamic and often unpredictable ways. This essay explores the multifaceted nature of risk in global market trading, the major types of risks faced by traders and investors, methods of risk assessment and mitigation, and the evolving landscape of risk management in the age of technology and globalization.
1. Understanding the Concept of Risk in Global Trading
In finance, risk refers to the potential for loss due to uncertainty about future outcomes. In global trading, risks are magnified because of exposure to multiple markets, asset classes, and currencies. These risks can stem from both systematic factors—such as global recessions, inflationary pressures, or changes in monetary policy—and unsystematic factors like firm-level management inefficiencies or localized political issues.
Risk is inherent to every trading decision. Global market participants—from institutional investors and hedge funds to retail traders—must therefore adopt robust risk management frameworks to identify, quantify, and manage potential losses. The challenge lies not only in measuring risk but also in anticipating the speed and scale at which it can materialize in interconnected markets.
2. Major Types of Risks in Global Market Trading
a) Market Risk
Market risk, also known as systematic risk, refers to the potential loss arising from adverse movements in market prices, including equity prices, interest rates, and commodity values. In global markets, volatility is driven by a complex interplay of macroeconomic trends, investor sentiment, and technological innovation. For instance, the 2008 financial crisis demonstrated how global equity markets can collapse simultaneously due to interconnected leverage structures and liquidity shortages.
Market risk can be categorized into:
Equity risk: arising from fluctuations in stock prices.
Interest rate risk: caused by unexpected changes in central bank rates or bond yields.
Commodity price risk: influenced by supply-demand dynamics, trade policies, and energy market disruptions.
Effective hedging through derivatives such as options and futures contracts is a key strategy to mitigate market risk in global trading.
b) Currency (Exchange Rate) Risk
In global trading, currency risk—or foreign exchange risk—is one of the most significant factors affecting profitability. Traders dealing in multiple currencies face potential losses due to fluctuations in exchange rates. For example, an Indian investor holding U.S. stocks may see returns decline if the U.S. dollar depreciates against the Indian rupee, even if the stock prices themselves rise.
Exchange rate risk arises from three primary exposures:
Transaction exposure: when settlements in foreign currencies are affected by exchange rate changes.
Translation exposure: when multinational companies consolidate financial statements from subsidiaries in different currencies.
Economic exposure: reflecting the broader impact of exchange rate movements on a firm’s competitiveness and cash flows.
Traders often use forward contracts, currency swaps, or natural hedging (offsetting currency inflows and outflows) to manage foreign exchange risks effectively.
c) Credit Risk
Credit risk arises when a counterparty fails to fulfill its contractual obligations—such as in derivative transactions, margin trading, or securities lending. In global markets, the interdependence of institutions amplifies this risk. The collapse of Lehman Brothers in 2008 is a stark reminder of how the default of one major entity can trigger widespread systemic consequences.
Credit risk management involves assessing counterparties’ creditworthiness, setting exposure limits, and using credit derivatives such as credit default swaps (CDS) to hedge against potential losses.
d) Liquidity Risk
Liquidity risk occurs when traders are unable to buy or sell assets quickly enough to prevent or minimize losses. In times of financial stress, even highly rated assets can become illiquid, leading to sharp declines in prices. The global financial crisis demonstrated how liquidity dry-ups can paralyze entire markets.
There are two types of liquidity risk:
Market liquidity risk: when there are not enough buyers or sellers.
Funding liquidity risk: when an institution cannot meet short-term obligations due to cash flow shortages.
To mitigate liquidity risk, traders maintain diversified portfolios, establish credit lines, and implement stress-testing mechanisms that simulate liquidity crunches.
e) Political and Geopolitical Risk
Global trading is highly sensitive to political developments, regulatory changes, and international conflicts. Geopolitical risk encompasses factors such as wars, sanctions, trade disputes, and regime changes that can disrupt financial flows and investor confidence. For example, the Russia-Ukraine conflict significantly impacted energy markets, commodities, and foreign exchange rates worldwide.
Political risk also includes changes in taxation policies, foreign investment restrictions, or sudden nationalization of assets. Investors often mitigate these risks through geographical diversification, political risk insurance, and by closely monitoring global news and policy trends.
f) Operational and Technological Risk
Operational risk arises from failures in internal processes, systems, or human errors. In global markets that rely heavily on high-frequency trading (HFT) and algorithmic systems, technological failures can cause severe disruptions. Cybersecurity threats—such as hacking of trading platforms or data breaches—pose additional layers of operational risk.
To manage these risks, institutions invest in robust IT infrastructure, enforce compliance protocols, and develop contingency plans to ensure business continuity in the event of system failures or cyber incidents.
g) Systemic and Contagion Risk
Systemic risk refers to the potential collapse of an entire financial system due to the failure of interconnected participants. The globalization of finance has heightened this risk, as crises in one region can rapidly spread to others—a phenomenon known as contagion. The Asian Financial Crisis (1997) and the Global Financial Crisis (2008) illustrated how cross-border linkages in banking and capital markets can amplify local shocks into global turmoil.
Central banks and regulators attempt to contain systemic risk through macroprudential policies, capital adequacy requirements, and coordinated international responses.
3. Measuring and Managing Risk in Global Markets
Effective risk management relies on both quantitative analysis and strategic oversight. Some of the key methods include:
a) Value at Risk (VaR)
Value at Risk estimates the maximum potential loss of a portfolio over a specific time period with a given confidence level. It is a standard tool for quantifying market risk.
b) Stress Testing and Scenario Analysis
These techniques simulate extreme market conditions (e.g., a global recession, oil shock, or currency collapse) to assess how portfolios would perform under stress.
c) Diversification
Diversifying assets across geographies, industries, and currencies reduces exposure to any single source of risk.
d) Hedging with Derivatives
Options, futures, swaps, and other derivatives allow traders to offset potential losses from adverse price movements.
e) Risk-Adjusted Performance Metrics
Metrics such as the Sharpe ratio and Treynor ratio help traders evaluate returns relative to the level of risk undertaken.
f) Regulatory and Compliance Frameworks
Global financial institutions are governed by frameworks like Basel III (for banks) and MiFID II (for European markets), which set standards for risk management, leverage, and transparency.
4. The Role of Technology in Risk Management
Technological advancements have transformed risk management in global trading. Artificial intelligence (AI), machine learning (ML), and big data analytics enable real-time risk monitoring and predictive modeling. Algorithms can detect patterns of volatility, forecast potential price shocks, and execute hedging strategies within milliseconds.
Blockchain technology enhances transparency and reduces counterparty risks by providing immutable transaction records. Meanwhile, RegTech (Regulatory Technology) automates compliance processes, ensuring that firms adhere to global regulations efficiently.
However, technology itself introduces new risks—such as model risk (errors in algorithmic assumptions) and cyber risk—which require ongoing vigilance.
5. The Interconnected Nature of Global Risk
Global markets do not operate in isolation. An event in one market—such as a policy shift by the U.S. Federal Reserve or a slowdown in China’s economy—can influence currencies, commodities, and equities worldwide. The COVID-19 pandemic was a striking example of how health crises can evolve into financial crises, disrupting global supply chains and triggering market panic.
Therefore, traders and investors must adopt a holistic approach to risk, recognizing the interdependence of financial systems. Global coordination among regulators and central banks, along with international cooperation through institutions like the IMF and World Bank, is essential for maintaining stability.
6. Emerging Risks in the Modern Trading Landscape
The future of global trading brings new categories of risks:
Climate risk: Extreme weather events and regulatory shifts toward green energy affect asset valuations and commodity prices.
Cyber risk: Increasing digitalization exposes markets to hacking and data theft.
AI and algorithmic trading risk: Autonomous trading systems can cause flash crashes if algorithms malfunction.
Regulatory divergence: As nations adopt differing post-crisis regulations, cross-border compliance becomes complex.
Social and reputational risk: Public sentiment, ESG (Environmental, Social, and Governance) issues, and social media trends increasingly influence market behavior.
7. Strategies for Effective Global Risk Governance
An effective risk governance framework integrates strategic oversight with operational discipline:
Establish clear risk appetite and tolerance limits.
Develop independent risk management functions to oversee exposures.
Foster a risk-aware culture across all levels of an organization.
Continuously update risk models based on evolving market data.
Enhance communication and transparency between traders, regulators, and investors.
Conclusion
Risk in global market trading is both inevitable and indispensable. Without risk, there would be no return; yet unmanaged risk can lead to catastrophic losses. As globalization deepens and markets become more interlinked, traders face a web of challenges—from market volatility and currency fluctuations to technological vulnerabilities and systemic contagion.
The key to thriving in this environment lies in understanding, measuring, and managing these risks with precision and foresight. By combining advanced analytics, diversified strategies, strong governance, and adaptive technologies, market participants can navigate uncertainty and harness global opportunities while safeguarding their capital. In essence, successful global trading is not about avoiding risk—but mastering it.

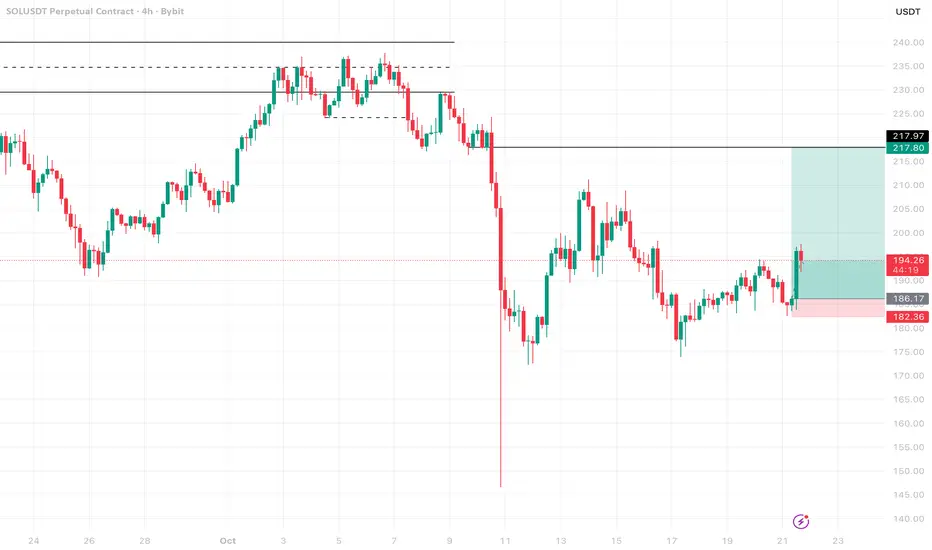
SOLUSDT.P - October 23, 2025Price is testing resistance near $182.65; a breakout above this level could signal bullish continuation toward $184.81–$187.27, while rejection may trigger a retracement to $178.00–$177.66 support. Consolidation between these zones remains possible—plan and execute your trades accordingly with clear risk management.

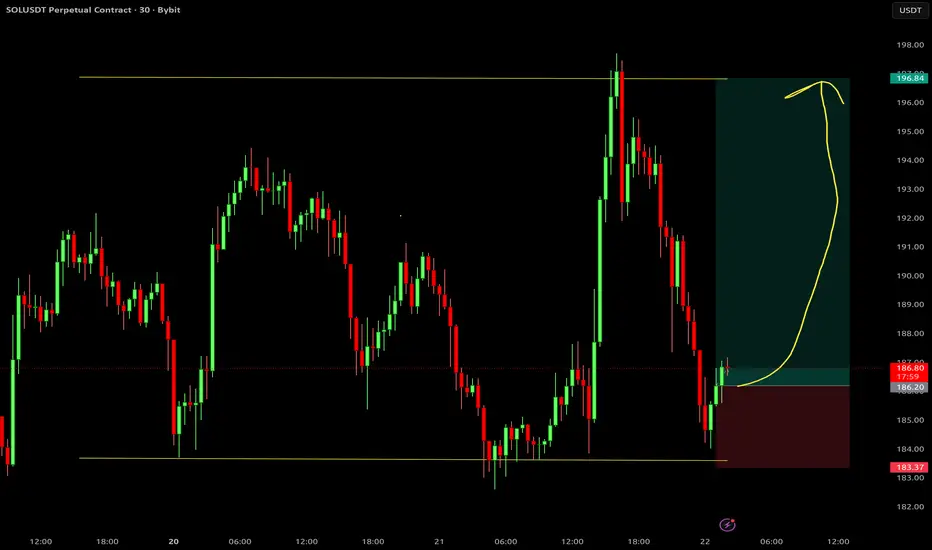
SOLUSDT.P - October 22, 2025Price is attempting a short-term rebound from the 183.13-180.23 range after an extended decline, forming a potential counter-trend setup targeting multiple profit levels near 189.9, 192.0, 194.3, and 197.6. However, volatility remains high amid Trump's tariff narrative, making this a high-risk play that requires tight stop management and active monitoring.

SOL/USDT Holds 185 USD – Waiting for Next Breakout Momentum?Hello everyone,
BINANCE:SOLUSDT is pausing around 185 USD after a corrective pullback from the 200 USD area. This is not a negative signal but a market rebalancing phase following the prior uptrend. The bullish structure remains intact with a sequence of higher highs and higher lows, showing no signs of a trend break. Currently, price is retesting the key support at 185 USD, which aligns with a Fair Value Gap (FVG) that attracts liquidity and often triggers renewed buying interest.
If this zone holds, SOL is likely to rebound towards 190 USD before challenging the psychological 200 USD level. Conversely, a clear break below 185 USD could see deeper FVG zones around 180 USD or 175 USD acting as the next equilibrium points. Trading volume is declining while price moves sideways – indicating an accumulation phase awaiting a new catalyst rather than a sell-off.
From a fundamental perspective, the Solana ecosystem continues to attract capital from DeFi and AI sectors, with no negative news suggesting a reversal. Current volatility largely depends on general market sentiment and Bitcoin’s behavior. The sensible strategy is to monitor price reaction at 185 USD: a clear bounce may warrant trend-following buys targeting 190–200 USD, while a break should prompt patience until the 180 USD zone before making any decisions – avoiding FOMO at all costs.
Do you think 185 USD represents a buying opportunity or a signal of deeper downside? Share your perspective below!

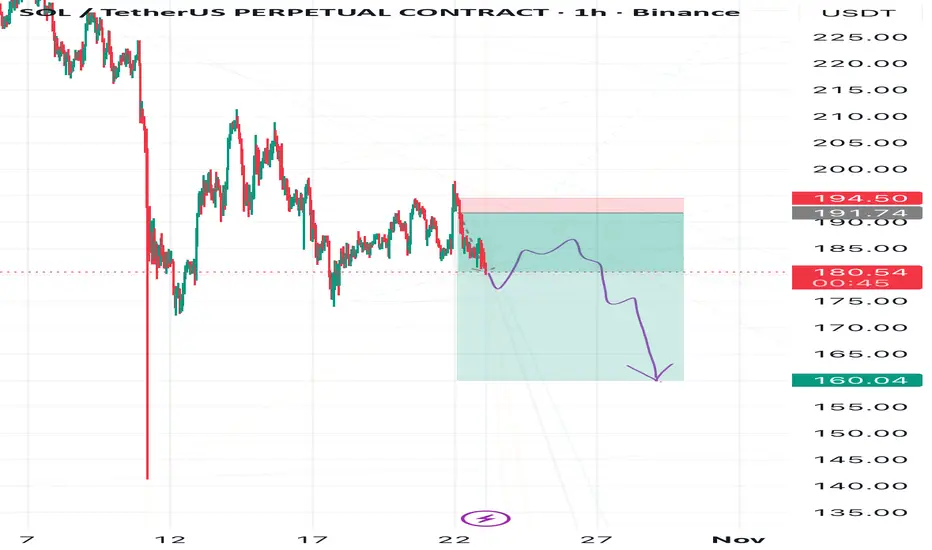
Don’t Trust the Twist — Solana’s Fall May PersistBe careful with Solana — the market might trick you into thinking a bullish reversal is forming.
In reality, the downtrend hasn’t finished yet.
A descending triangle is forming, and the breakout could be strongly to the downside.
🎯 Targets:
1️⃣ 164
2️⃣ 156
3️⃣ 138
❌ Invalidation: if price reaches the red zone marked on the chart
SOLCRYPTOCAP:SOL could dip to around $150 again, maybe just a quick wick before reversing. I think that move would be short-lived and followed by a strong 160% rally toward $420. It’s shaping up to be a great opportunity for patient entries before the next breakout wave.

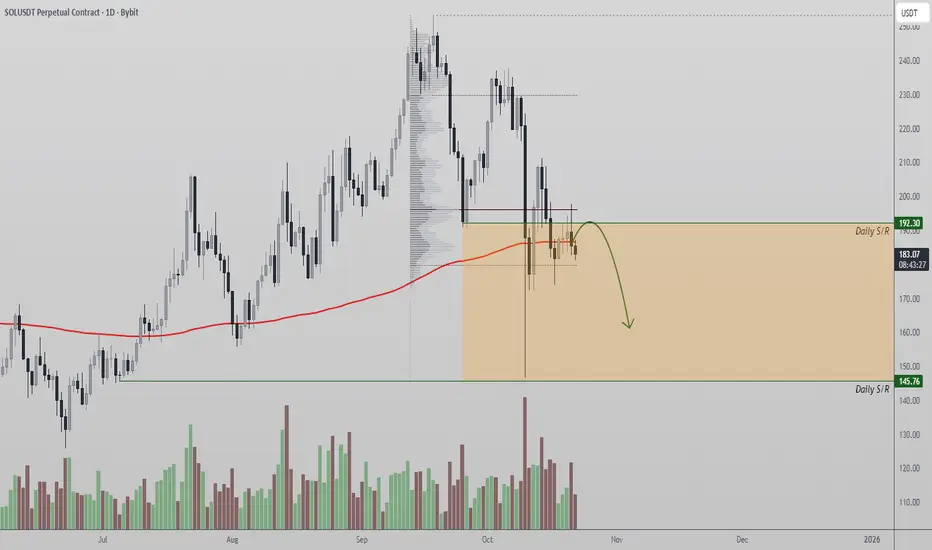
Solana Faces Strong Rejection at $192 ResistanceSolana price action is struggling to gain momentum above the $192 level, a critical zone packed with strong technical confluences. This region houses both the 200 Exponential Moving Average (EMA) and the Point of Control (POC), making it a decisive battleground for market participants.
The inability to reclaim this region suggests that bullish momentum remains limited in the short term. A rejection from this resistance could invite a deeper corrective phase, especially if buying pressure continues to fade near current levels.
Key Points:
- Major Resistance: $192, aligning with both the 200 EMA and POC, acting as a technical ceiling.
- Structural Weakness: Failure to reclaim this level limits upside continuation.
- Downside Target: Next high-timeframe support sits near $145, offering potential re-entry interest.
From a technical standpoint, Solana must close decisively above $192 to confirm strength and invalidate the current rejection bias. Until then, price remains vulnerable to a retracement toward lower liquidity zones.
What to Expect:
Expect further consolidation or minor pullbacks while below $192. A rejection from this region could accelerate a rotation toward $145, whereas a confirmed breakout would reestablish a bullish trajectory toward $210–$220.
Solana (SOL): Waiting For Ideal Buy Entry | Could Bounce +30%Looking for a long on SOL coin with our most famous strategy—wait for a break of structure/retest/another break of structure.
More in-depth info is in the video—enjoy!
Swallow Academy

SOL is the next big move? While Bitcoin is in a strong correction, bearish sentiment is reaching the highest levels in recent months, and alts are dropping to zero. It seems like the entire crypto market is dead — but is that really the case?
In fact, SOL is now the most bullish top token on the market, and it may try to update its ATH already this year. Here’s why:
➡️ While Bitcoin has already broken its structure, SOL still maintains its textbook-bullish structure, forming HH and HL.
➡️ The price continues to move in an ascending channel, while Bitcoin long ago broke down its ascending support and went significantly lower.
➡️ Money Flow shows a divergence with the price and an outflow of liquidity since July. But this happened across the market due to profit-taking after the summer rally.
➡️ Supply and demand analysis shows that there is still high demand for SOL even around current prices. Whereas in Bitcoin there is no demand at all until lower levels, and supply significantly prevails there.
➡️ SOL has almost completely closed the GAP from the drop, and a small range remains at $221–$209, which the price may want to test in the near future.
➡️ There is also a huge GAP above, which continues to attract the price.
Conclusion:
While BTC has already played out all catalysts to the maximum and is simply exhausted, with no liquidity to drive the price higher, and ETH’s rally died before it even started, SOL still maintains a bullish structure even in such periods.
🔥 Moreover, more time has passed since its last ATH than for BTC and ETH, since SOL was one of the first to move the market in this cycle. And most importantly — a decision on the SOL ETF is expected in November. I don’t expect billion-dollar inflows right away, but this is definitely a bullish catalyst toward the end of the year.

SOL ; What can be done?Hello friends
Given the decline we had, the price has been moving in an ascending channel for some time now, and now that the price is at the bottom of the channel and is on an important move, we can buy one step with risk and capital management, and in case of further correction, we can buy another two steps down and move with it to the specified targets.
*Trade safely with us*
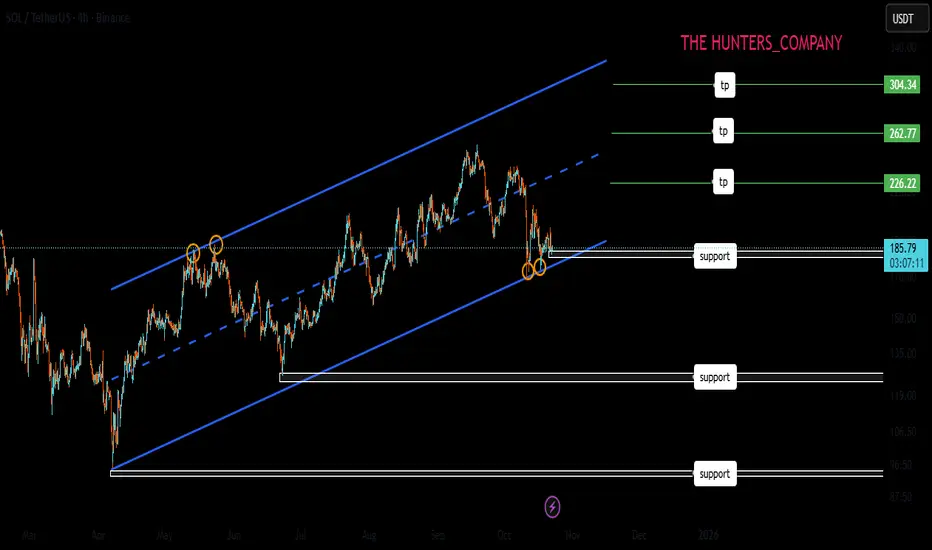
SOL / USDT – Retesting Key Trendline Support, Potential ReversalSolana (SOL) is currently retesting a strong ascending trendline that has held as support since mid-2024. The price recently bounced around the $175–$185 zone, which has acted as a major demand area multiple times in the past.
If the trendline holds, SOL could start a new upward move targeting:
- $210 – first resistance and short-term target
- $230 – medium-term resistance
- $250 – potential swing target
A daily close below the trendline or under $170 would invalidate the bullish scenario and open room for a deeper correction.
Overall, SOL remains in a long-term bullish structure as long as it stays above the trendline support.
#solana $sol long TRADENATION:SOLANA #SOLUSDT Update 🚀
london has taken out asia low ,
expect us to now move higher after this manipulation move
Trade Plan:
Longs: Above 184.80 with stop at 184.20
Adds: Break & close above 185.50
Targets: 186.50 → 188.00

SOL market snapshotSOL potential trend reversal Head & Shoulders pattern will be confirmed if the $110-120 zone is broken. Everything above this level can still be considered a bullish consolidation, with a range size of around 120%. A breakout above $250 most likely send the price toward $500

#SOL still has potential for new highs 📊#SOL still has potential for new highs 🚀
🧠From a structural perspective, the daily uptrend and bullish structure remain intact, so we shouldn't be overly bearish. Currently trading near the daily neckline support, the uptrend support line at 170.777 has not yet been tested. Extreme support is near 152.
➡️If further gains are expected, sideways consolidation will be necessary to break this downtrend. Therefore, focus on range-bound trading. Patiently wait for the price to reach its limit before considering trend-based profits.
🤜If you like my analysis, please like 💖 and share 💬
BITGET:SOLUSDT.P

Solana is undervalued | New ATH coming very soon | $250++Solana is slowly but surely grinding up, following the altcoin king ETH. ETH is already near its 2024 highs of $4000. If SOL were to be in the same position as ETH in terms of price, we should be around $250.
In technical terms, SOL is showing huge bullish strength at the $180 resistance. In the last attempt in breaking above this level, it faced multiple rejections and consolidated before ultimately backing down. This time, there is little to no resistance.
The REX-Osprey SOL staking ETF continues to garner inflows, having only one outflow day since the launch date 2nd July. That's nearly $100 million net inflows and 11 inflow days out of 12 trading days. Imagine the demand the spot SOL ETF by big players such as VanEck, Grayscale and Fidelity will have once approved.
BTC dominance is breaking below 60%. Capital is flowing from BTC into ETH, and once ETH hits $4000, a good amount will flow from ETH to SOL as people look for better potential gains.

I've played these games before!1. MA crossover and price retests the 50MA.
2. Price consolidates.
3. Higher high is printed.
Traders FOMO here.
4. Higher low forms below #2 consolidation zone between the 50MA and 200MA.
Traders are liquidated. Max fear period.
5. Lower high is printed.
Traders FOMO here.
6. Price retests the 200MA.
Traders are liquidated. Max fear period.
7. Massive leg up.
The first rally was driven by Trump's inauguration. What will it be driven by this time? The end of the US government shutdown, ETF approval, interest rate cuts, quantitative easing, institutional interest, US-China trade deal, or capital rotation from traditional investment vehicles to crypto...? Take your pick.

SOL Quick Bounce on Local Range SupportA local bottom with 30m range touched. Expected bounce to the upper range
Solana on the Edge: Will the Downtrend Continue?Solana has broken its key long-term uptrend, signaling increased selling pressure.
In the short term, the coin remains in a dynamic downtrend, and any minor rallies face resistance.
Indicators suggest the possibility of further correction; short-term traders should stay cautious and manage risk carefully.
Crypto markets move fast—always prioritize risk management.

SOL – Strength Isn’t Noise, It’s Signal.Most traders hesitate when price pulls back. I look for confirmation.
SOL held structure, reclaimed momentum, and showed real strength.
Break and retest ✅
Momentum shift ✅
Tight risk, strong upside ✅
I’m long — small risk, high reward.
This isn’t guessing, it’s execution.
Would you have caught this move or waited for someone else to call it?
SOL LONG : HELLO BULL RUNSOL Price finds support at 0.618 fib eliminating thoughts of a bearish setup.
Time for price to start its move to $500.
First stop : 266 - 250
