SOL market snapshotSOL potential trend reversal Head & Shoulders pattern will be confirmed if the $110-120 zone is broken. Everything above this level can still be considered a bullish consolidation, with a range size of around 120%. A breakout above $250 most likely send the price toward $500
Trade ideas

#SOL still has potential for new highs 📊#SOL still has potential for new highs 🚀
🧠From a structural perspective, the daily uptrend and bullish structure remain intact, so we shouldn't be overly bearish. Currently trading near the daily neckline support, the uptrend support line at 170.777 has not yet been tested. Extreme support is near 152.
➡️If further gains are expected, sideways consolidation will be necessary to break this downtrend. Therefore, focus on range-bound trading. Patiently wait for the price to reach its limit before considering trend-based profits.
🤜If you like my analysis, please like 💖 and share 💬
BITGET:SOLUSDT.P

Solana is undervalued | New ATH coming very soon | $250++Solana is slowly but surely grinding up, following the altcoin king ETH. ETH is already near its 2024 highs of $4000. If SOL were to be in the same position as ETH in terms of price, we should be around $250.
In technical terms, SOL is showing huge bullish strength at the $180 resistance. In the last attempt in breaking above this level, it faced multiple rejections and consolidated before ultimately backing down. This time, there is little to no resistance.
The REX-Osprey SOL staking ETF continues to garner inflows, having only one outflow day since the launch date 2nd July. That's nearly $100 million net inflows and 11 inflow days out of 12 trading days. Imagine the demand the spot SOL ETF by big players such as VanEck, Grayscale and Fidelity will have once approved.
BTC dominance is breaking below 60%. Capital is flowing from BTC into ETH, and once ETH hits $4000, a good amount will flow from ETH to SOL as people look for better potential gains.

I've played these games before!1. MA crossover and price retests the 50MA.
2. Price consolidates.
3. Higher high is printed.
Traders FOMO here.
4. Higher low forms below #2 consolidation zone between the 50MA and 200MA.
Traders are liquidated. Max fear period.
5. Lower high is printed.
Traders FOMO here.
6. Price retests the 200MA.
Traders are liquidated. Max fear period.
7. Massive leg up.
The first rally was driven by Trump's inauguration. What will it be driven by this time? The end of the US government shutdown, ETF approval, interest rate cuts, quantitative easing, institutional interest, US-China trade deal, or capital rotation from traditional investment vehicles to crypto...? Take your pick.

SOL Quick Bounce on Local Range SupportA local bottom with 30m range touched. Expected bounce to the upper range
Solana on the Edge: Will the Downtrend Continue?Solana has broken its key long-term uptrend, signaling increased selling pressure.
In the short term, the coin remains in a dynamic downtrend, and any minor rallies face resistance.
Indicators suggest the possibility of further correction; short-term traders should stay cautious and manage risk carefully.
Crypto markets move fast—always prioritize risk management.

SOL – Strength Isn’t Noise, It’s Signal.Most traders hesitate when price pulls back. I look for confirmation.
SOL held structure, reclaimed momentum, and showed real strength.
Break and retest ✅
Momentum shift ✅
Tight risk, strong upside ✅
I’m long — small risk, high reward.
This isn’t guessing, it’s execution.
Would you have caught this move or waited for someone else to call it?
SOL LONG : HELLO BULL RUNSOL Price finds support at 0.618 fib eliminating thoughts of a bearish setup.
Time for price to start its move to $500.
First stop : 266 - 250

SOLCRYPTOCAP:SOL price action is tightening up with a solid base forming at support, looking strong each time it’s tested. This compression phase usually precedes a breakout. $420 remains the clear target and looks highly achievable within the next 200 days.

SOLANA BUSSING n SETTING UP sol play : Get IN wif me : we going higher after this lil shake out : THANKS CZ N TRUMP:

Solana Price May Have A Shot At $250, But Caution AdvisedAt the time of writing, Solana’s price stands at $184, holding above the crucial $183 support. The altcoin appears to be forming a flag pattern, a technical setup often associated with bullish breakouts. However, confirmation will depend on volume strength and investor conviction.
Following the recent crash, SOL briefly dropped out of this pattern before testing and validating it again. For a clear breakout, Solana needs to bounce off the lower trendline or move past $192. Failure to sustain buying pressure could drive the token below $175, potentially falling to $163, invalidating the bullish pattern.
Conversely, if Solana breaches $192, it could surpass $200, a key psychological barrier. Breaking out from the pattern could ignite renewed momentum, setting the stage for a potential surge toward $250. Nevertheless, investors and traders should proceed with caution given the current market fragility.
$sol 1hr long setup Market Structure: Higher highs/lows intact - bullish continuation pattern
Liquidity Grab: Recent dip to $182.74 likely swept sell-side liquidity below previous low
Optimal Trade Entry: Current zone around $185-186 presents potential long entry
BILL WILLIAMS ALLIGATOR CONFIRMATION:
Price currently trading ABOVE the Alligator's lips/jaws (bullish alignment)
TRADE PLAN:
Entry Zone: $185.00 - $185.50 (with confirmation)
Stop Loss: Below $182.50 (respecting market structure)
Targets:
TP1: $187.11 (immediate FVG)
TP2: $190.00 (psychological + structural)
TP3: $193.78 (swing high extension)
RISK MANAGEMENT:
Position size according to 1-2% risk rule

SOL-USDTIn order for Solana to be bullish, it must break the downtrend line, in which case it can start climbing towards $200. 🪙🪙
Solana's reliable bottom is $175

[SeoVereign] SOLANA BEARISH Outlook – October 21, 2025Hello everyone,
This idea is connected to the one shared on the 19th.
I am still holding the short position that was entered based on the October 19 idea, and since some of the underlying reasons have been slightly revised, I’m sharing this as an additional update.
Today, as of October 21, I would like to present my bearish (short) outlook on Solana.
Basis — BEARISH BAT PATTERN / BEARISH 1.13 SHARK
Solana is currently located in a zone where the Bearish Bat Pattern and the Bearish 1.13 Shark Pattern overlap simultaneously.
Both patterns are typical top reversal structures that form in upper regions,
and after the price entered the PRZ (Potential Reversal Zone), it has lost additional upward momentum and is suggesting the possibility of a bearish reversal.
In particular, the completion area of the 1.13 Shark Pattern almost perfectly coincides with the PRZ of the Bat Pattern,
and this structural confluence between the two patterns is generally interpreted as a classic reversal zone where selling pressure tends to strengthen.
Therefore, the current area is considered a valid sell zone, with a high probability of a reversal from the overheated region.
Accordingly, I set the average target price around 178.69 USDT.
Depending on the future development of the chart,
I will provide further updates regarding position management and any changes.
Thank you.

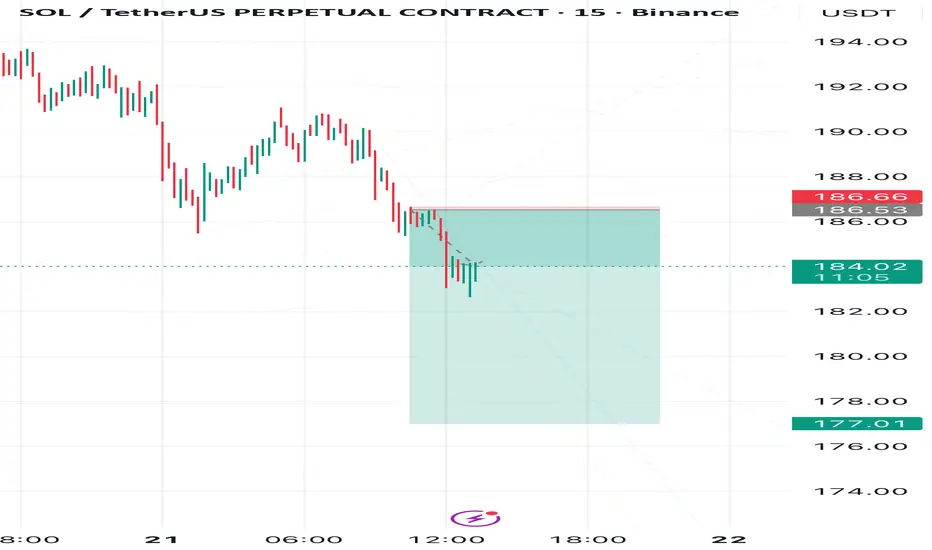
Solana Drop DramaSolana has started its decline as expected. I am now targeting a drop to 177
On the chart, I marked the plan cancellation zone—if price breaks this area, the scenario becomes invalid.
SOL Long-Term View — Target $228SOL is maintaining a bullish structure with higher highs and higher lows.
📊 As long as key supports hold, the long-term target remains $228

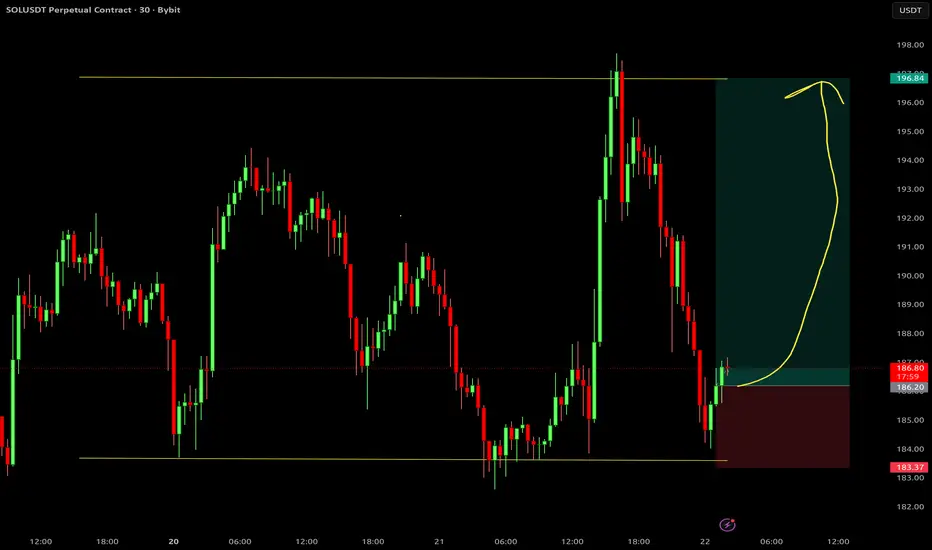
SOLUSDT – Short-Term Bearish BiasHello traders,
In my view, SOLUSDT is likely to lean toward a slightly bearish trend in the coming sessions. The preferred strategy is to sell the rally when price approaches the confluence zone around 196–199. Currently, Solana is testing the descending trendline that has been in place since early October — a level that has previously formed multiple tops and faced strong rejections.
News Overview:
The recent listing of the Solana ETF in Hong Kong is a positive sign for the medium term. However, the broader crypto market remains under pressure due to uncertainty in the United States , as ETF approvals are delayed by the government shutdown and the unclear regulatory stance from the SEC. This has limited short-term speculative capital and created a cautious sentiment across the market.
In addition, rumors claiming that a Solana ETF was approved in the U.S . have been refuted by Reuters and Bloomberg, indicating that the market may have overreacted to unverified information. This kind of overhype often leads to short-term corrections following technical rebounds.
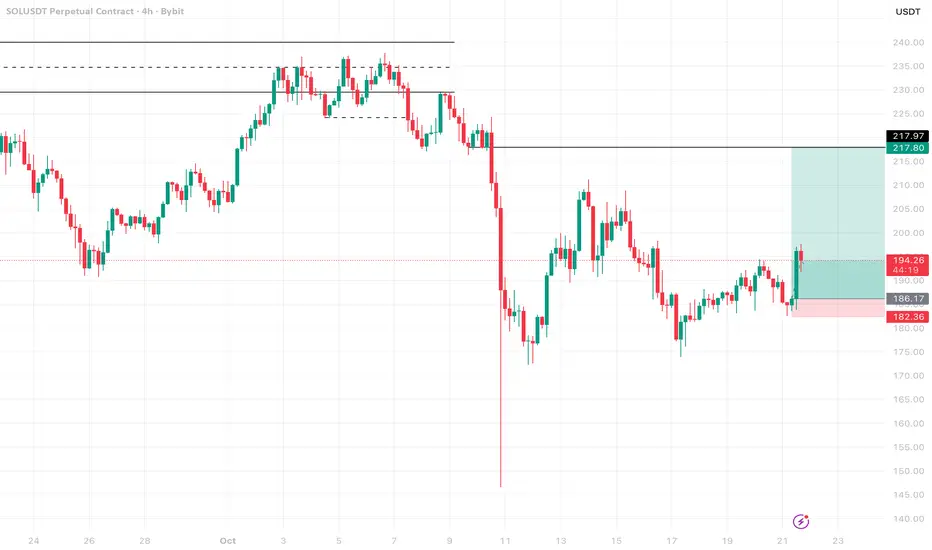
Technical Analysis:
On the 4H timeframe, SOL is clearly moving within a downtrend structure, forming a series of lower highs and lower lows.
The 196–199 zone aligns with the descending trendline, the EMA89, and a key dynamic resistance level.
Price is showing weak reaction in this area, suggesting that buying momentum is fading.
If a rejection candle pattern or SFP (swing failure pattern) appears near 197, it could be a good opportunity to enter short positions.
The near-term target lies around 182–175, a strong support zone where price previously bounced. If 175 breaks, the decline could extend further toward 170–168.

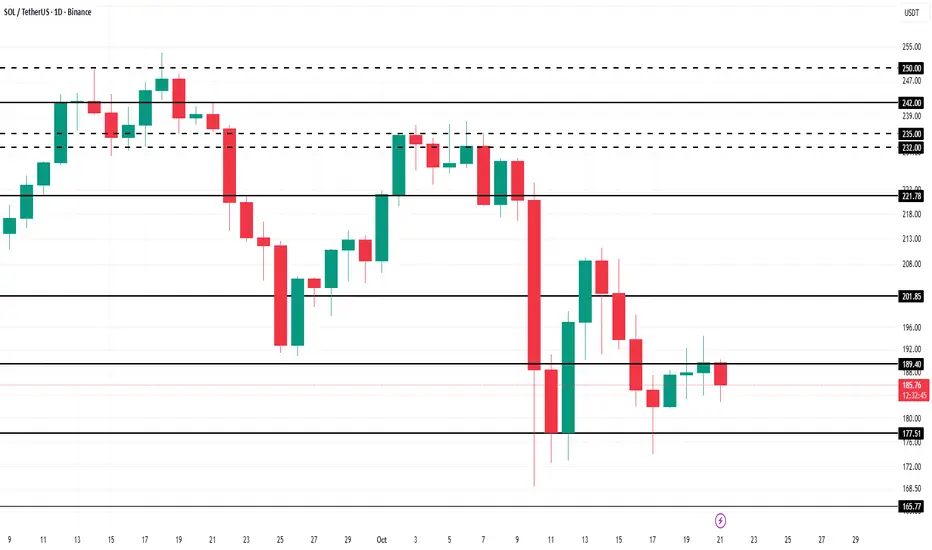
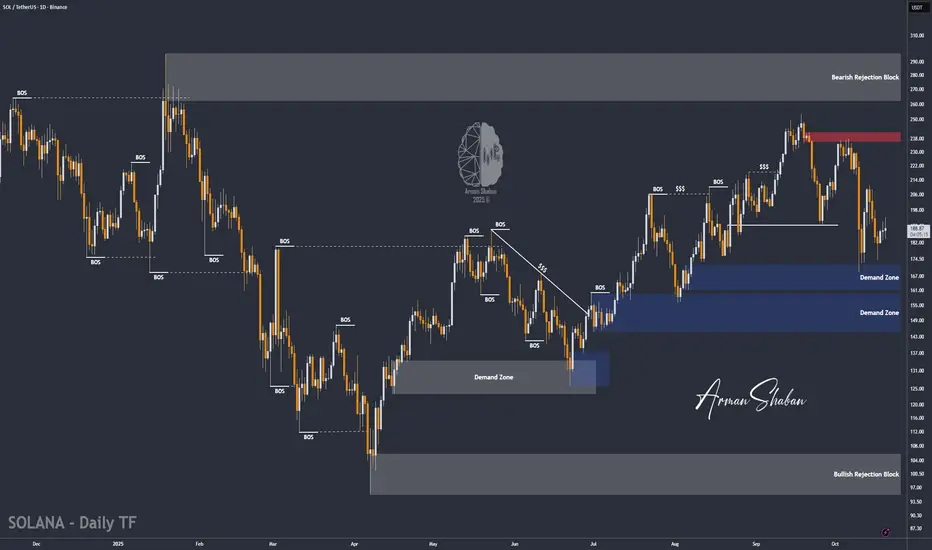
SOL/USDT | SOL Update – Recovering After Volatile Swings!By analyzing the #Solana (SOL) chart on the daily timeframe, we can see that after a sharp drop to around $169, SOL quickly rebounded to $211, then faced another correction back to $174. Since holding steady above $170, the price has regained momentum and is now trading near $190, showing signs of renewed strength.
If SOL manages to maintain stability above the $170–$175 zone, the bullish structure remains intact. The next upside targets are $211, $216, $238, and $254 , where short-term reactions may occur before further continuation.
The overall outlook remains bullish , but you should watch closely to see if SOL can sustain its momentum above current levels — this could be the start of a new leg higher.
Please support me with your likes and comments to motivate me to share more analysis with you and share your opinion about the possible trend of this chart with me !
Best Regards , Arman Shaban
$SOL (DAILY): GOLDEN POCKET as tough RESISTANCE, big move soonCRYPTOCAP:SOL is getting ready for a bigger move soon after being squeezed into a corner, or an apex between an ascending 6-month-long trendline and horizontal resistances overhead.
Notably, the GOLDEN POCKET zone resistance, once again, but #sol is more bullish than many other large-caps.
Still, it has to follow the latest HIGHER LOW with a higher high next, so the main level to watch is $210 to $215. Close a strong volume candle above and LONGS should be mandatory. 50 MA must be reclaimed first, as far as I'm concerned, this is my filter. $214 right now.
Some mild bullish HIDDEN OBV divergence, always a good sign. Too many resistances overhead for an entry at market prices.
TRIGGER BUYS between $215 and $220 a good option for now, otherwise maanage an entry manually. Need a SOLANA vs CRYPTOCAP:BTC analysis next.
👽💙

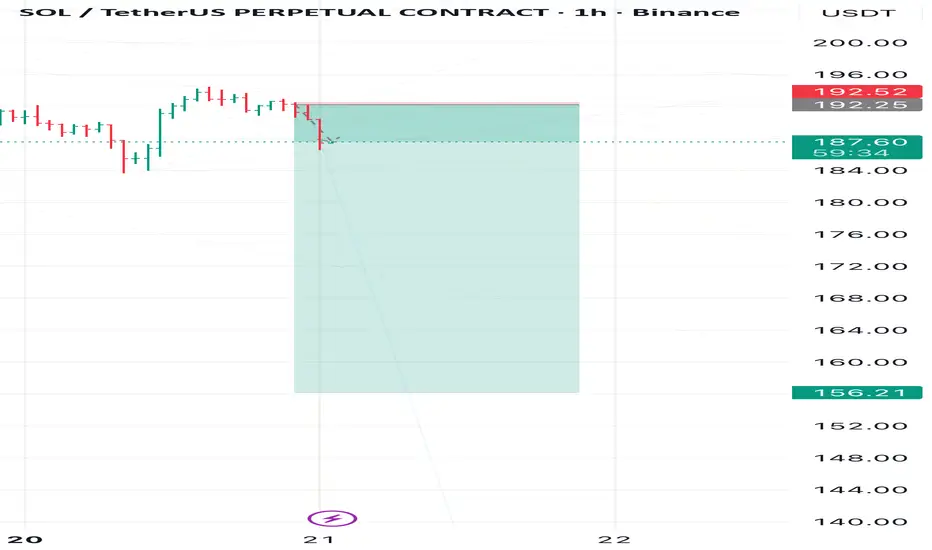
Solana correction completed — next bearish wave aheadAfter a short-term correction, Solana (SOL) is showing signs of renewed bearish momentum.
The recent upward move looks like a retracement within a larger downtrend structure.
🔹 Current outlook: Bearish
🔹 Updated target: 156 (previously 164)
🔹 Invalidation: Breakout above the marked resistance zone on the chart
As long as the price remains below resistance, I expect continuation toward the lower support area.
A confirmed breakout above this zone would invalidate the bearish scenario and shift the bias to bullish.
#Solana #SOLUSD #CryptoAnalysis #TechnicalAnalysis #PriceAction #Altcoins #BearishSetup #TradingView #MarketStructure
Solana 20 oct 2025 analysis if today 20 oct 2025 daily close we can stand the price above 191, possibly we can continue rally up

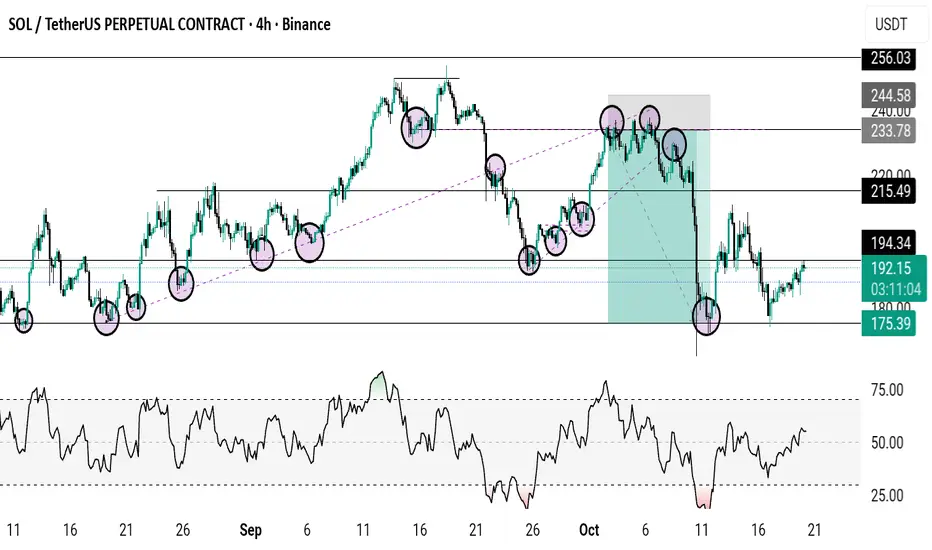
Something worth learning If you connect the dots together you'll see it matches trendlines and zones and also having multiple confluence in trading will give you an edge in the market
So many ways and strategies out there.
Break and retest is one of them it's simple and effective
I use Break and retest and others like RSI
The blck lines represent zones and if you check my entry and exit you'll see zones
Also on the RSI the exit is below 30% while the entry if above 70%
Note: sometimes RSI can be above 70% and below 30% for a long time doesn't it will reverse
That's why you use other confluences like strong zone or trendline
Don't just trade with OVERBOUGHT AND OVERSOLD
If this was helpful
Drop a like and comment 👍
Be careful with SOLANA !!!It can be said that the price has broken out of this triangle and may experience a solid upward move. However, before the rally, it will likely liquidate long positions once.
