The Next Explosion, Hidden Clues in Price BehaviorCan you really feel the next Bitcoin explosion just by reading the charts?
The market looks calm, but deep down something big is shifting.
When everyone expects a crash, history shows that’s when the biggest moves begin.
Hello✌️
Spend 2 minutes ⏰ reading this educational material.
🎯 Analytical I
Related pairs
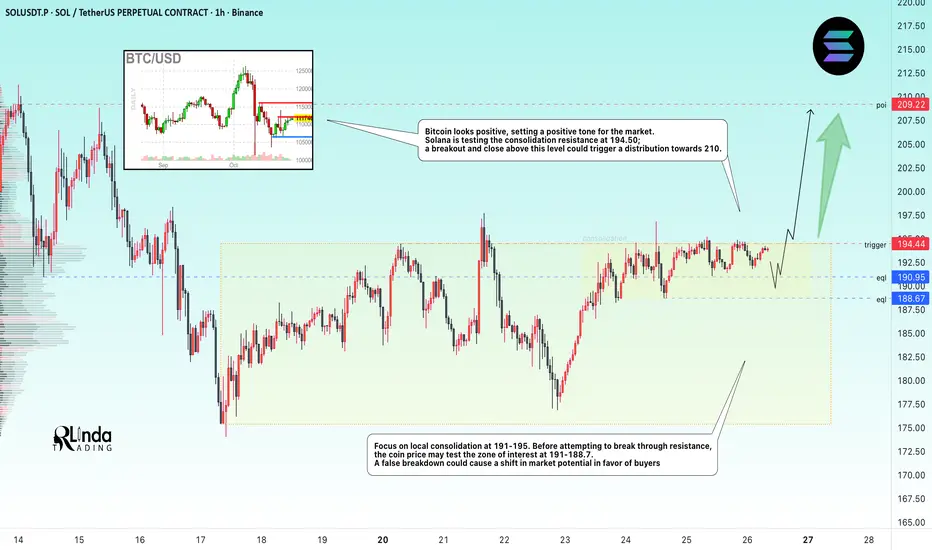
SOLANA → Consolidation before resistance. An attempt at growth?BINANCE:SOLUSDT.P is testing the resistance of the trading range, with pre-breakout consolidation forming, indicating that buyer interest in the coin is emerging.
Bitcoin looks positive, which sets a positive tone in the market. Solana is testing the resistance of consolidation at 194.50; a br
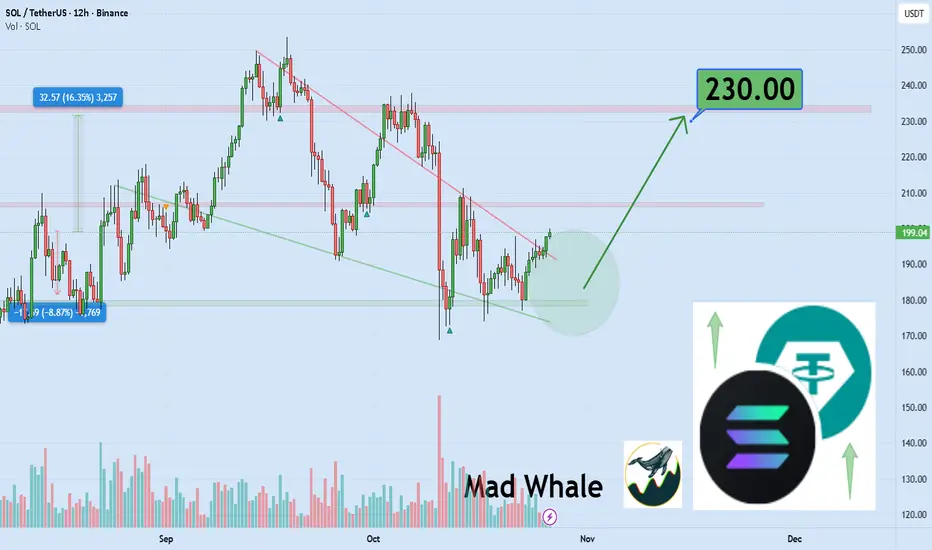
SOL/USDT (3h timeframe)....SOL/USDT (3h timeframe), here’s what’s visible:
Im showing a symmetrical triangle breakout pattern.
The price has broken above the descending resistance line (around $198–$200).
My already marked two target points on the chart:
1. First Target Point ≈ $216
2. Second Target Point ≈ $236
So

Lingrid | SOLUSDT Continuation Short Pattern BuildingBINANCE:SOLUSDT is consolidating within a defined downward channel after a sequence of lower highs and extended impulse legs. Price action is currently hovering near mid-range resistance, showing hesitation below the descending trendline. A rejection from this level may drive the pair back toward t

SOLUSDT – Bullish Trend Supported by Technical Structure and NewAfter a brief correction, SOLUSDT is showing strong signs of a continued upward movement. The ascending triangle pattern on the H4 chart indicates that SOL is building a solid base, with higher lows and testing the resistance at 200.00 USD. The price is currently above the EMA34, signaling str

Solana Resumes Uptrend After Bullish BreakoutSolana Resumes Uptrend After Bullish Breakout
SOLANA has come out of a strong consolidation that lasted almost 2 weeks.
The breakout looks strong and sustainable, indicating increasing bullish momentum.
If the markets in general do not face any strange manipulation during the FOMC meeting on Frid

$SOL - LONG - ABOUT TO POP?Analysis:
Following up on my Oct 14th BTC note — “Wait for arbitrage to balance spot markets” — we’re now nearing that blue box. As BTC approaches equilibrium, I’m eyeing CRYPTOCAP:SOL for a clean long setup.
Here’s why 👇
AVWAP Confluence Zone:
We’ve got the lower band of a HTF auction co

SOL: One More High… or Goodbye?The Solana bull run that started in December 2022 most likely finished in January 2025. It was a textbook five-wave impulse (extended iii, with i ≈ v). From Jan → Apr 2025 we saw the first leg down (A), and the rally Apr → Sep was merely a corrective (B) move; base case is C down toward $80–50. An a

SOLANA - SHORT - THE WICK AND THE WHISPERTraders,
This is how I see SOL.
1. The level I care about
For me the key area is 205 to 207. Call it VAH, call it range high, call it supply. It is the place where price got stuffed before and where a lot of trapped memory lives.
What I expect is simple.
Wick it. Slip it. Fade it.
In other word

SOL: chart on the background of the news!Greetings, colleagues 😊💻
It's time to🔎 look and disassemble the charts coins SOL
A lot of positive news has been 📅 coming out recently , and thus may attract more and more buyers of this asset .
💡 For those who are not engaged in investing, but in extracting medium and short-term profits, I

See all ideas
Summarizing what the indicators are suggesting.
Oscillators
Neutral
SellBuy
Strong sellStrong buy
Strong sellSellNeutralBuyStrong buy
Oscillators
Neutral
SellBuy
Strong sellStrong buy
Strong sellSellNeutralBuyStrong buy
Summary
Neutral
SellBuy
Strong sellStrong buy
Strong sellSellNeutralBuyStrong buy
Summary
Neutral
SellBuy
Strong sellStrong buy
Strong sellSellNeutralBuyStrong buy
Summary
Neutral
SellBuy
Strong sellStrong buy
Strong sellSellNeutralBuyStrong buy
Moving Averages
Neutral
SellBuy
Strong sellStrong buy
Strong sellSellNeutralBuyStrong buy
Moving Averages
Neutral
SellBuy
Strong sellStrong buy
Strong sellSellNeutralBuyStrong buy
Displays a symbol's price movements over previous years to identify recurring trends.
Frequently Asked Questions
The current price of Solana / Tether SPOT (SOL) is 186.48 USDT — it has fallen −0.63% in the past 24 hours. Try placing this info into the context by checking out what coins are also gaining and losing at the moment and seeing SOL price chart.
Solana / Tether SPOT price has fallen by −4.44% over the last week, its month performance shows a −21.09% decrease, and as for the last year, Solana / Tether SPOT has increased by 12.27%. See more dynamics on SOL price chart.
Keep track of coins' changes with our Crypto Coins Heatmap.
Keep track of coins' changes with our Crypto Coins Heatmap.
Solana / Tether SPOT (SOL) reached its highest price on Jan 19, 2025 — it amounted to 295.74 USDT. Find more insights on the SOL price chart.
See the list of crypto gainers and choose what best fits your strategy.
See the list of crypto gainers and choose what best fits your strategy.
Solana / Tether SPOT (SOL) reached the lowest price of 8.00 USDT on Dec 29, 2022. View more Solana / Tether SPOT dynamics on the price chart.
See the list of crypto losers to find unexpected opportunities.
See the list of crypto losers to find unexpected opportunities.
The safest choice when buying SOL is to go to a well-known crypto exchange. Some of the popular names are Binance, Coinbase, Kraken. But you'll have to find a reliable broker and create an account first. You can trade SOL right from TradingView charts — just choose a broker and connect to your account.
Crypto markets are famous for their volatility, so one should study all the available stats before adding crypto assets to their portfolio. Very often it's technical analysis that comes in handy. We prepared technical ratings for Solana / Tether SPOT (SOL): today its technical analysis shows the sell signal, and according to the 1 week rating SOL shows the neutral signal. And you'd better dig deeper and study 1 month rating too — it's buy. Find inspiration in Solana / Tether SPOT trading ideas and keep track of what's moving crypto markets with our crypto news feed.
Solana / Tether SPOT (SOL) is just as reliable as any other crypto asset — this corner of the world market is highly volatile. Today, for instance, Solana / Tether SPOT is estimated as 1.01% volatile. The only thing it means is that you must prepare and examine all available information before making a decision. And if you're not sure about Solana / Tether SPOT, you can find more inspiration in our curated watchlists.
You can discuss Solana / Tether SPOT (SOL) with other users in our public chats, Minds or in the comments to Ideas.