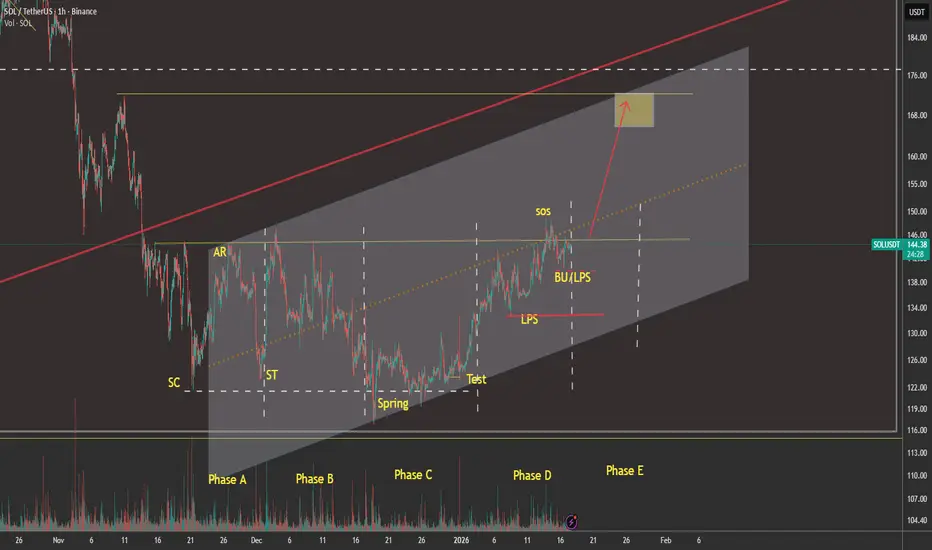
SOLUSDT - $172 in 10 days? 1H — Wyckoff details
For education purpose, I have drawn the different phases. This is a very short term trade. Be very careful after this one. We have a major shakeout brewing.
Clean Wyckoff accumulation on the 1H.
• Phase A: Selling Climax + Automatic Rally
• Phase B: Range absorption
• Phase C: Spring + reclaim
Related pairs
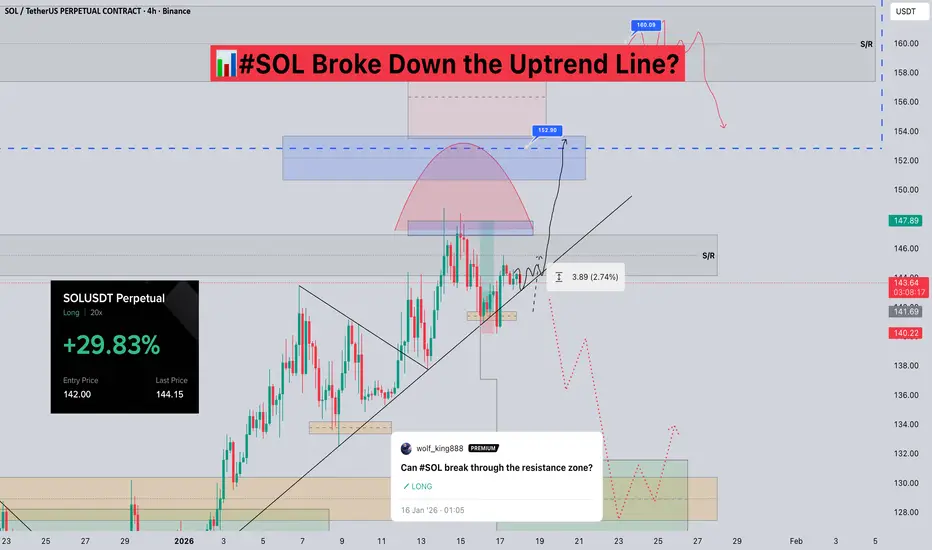
#SOL Broke Down the Uptrend Line?📊#SOL Broke Down the Uptrend Line?
🧠Looking at the 4-hour chart, we have indeed broken below the uptrend support line. However, we haven't continued to break strongly through the resistance zone (S/R), so we need to be wary of a potential correction.
➡️I'm still holding my long positions entered n
SOLANA - The battle for resistance 145. The bulls have a chanceBINANCE:SOLUSDT.P breaks resistance and tries to stay above key levels. The fundamental background for cryptocurrencies is gradually improving. What can be expected in the short and medium term?
The crypto market has received support amid progress in US regulatory initiatives: the Digital Asse

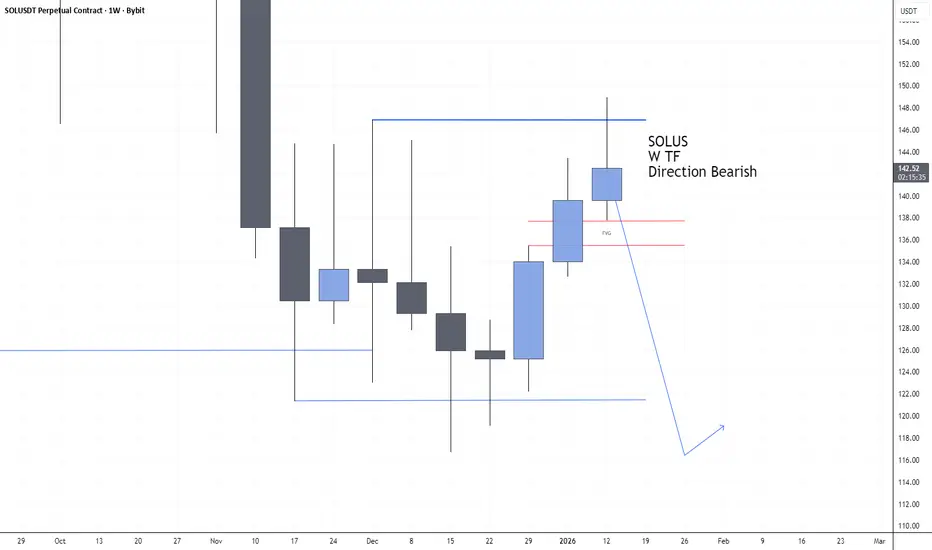
SOLUSD bearish Sign?looking at weekly chart looks like SOL most likely bearish setup.
Of course I was Bullish last week but looking at the candle closing inside wick possible short.
SOLU/USD Buy Trade Scenario.Here’s an up-to-date SOLU/USD Buy trade outlook (technical + fundamental) to help you assess whether positioning for a Upside makes sense right now.
Thank You......
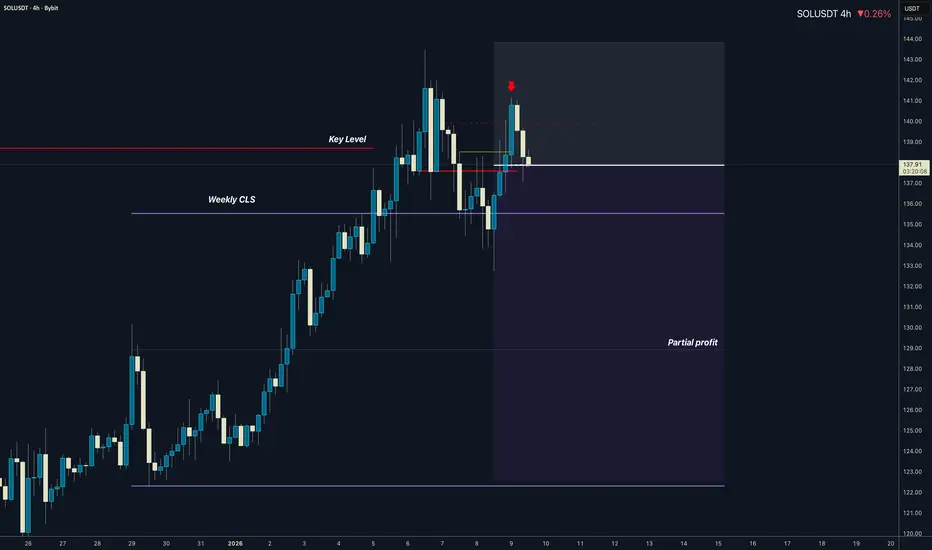
SOLANA Weekly CLS - Model 1 ShortHi friends, new range created. As always we are looking for the manipulation in to the key level around the range. Don't forget confirmation switch from manipulation phase to the distribution phase to make the setup valid. Stay patient and enter only after change in order flow. If price reaches 50%
SOLANA: Road to $500 is Clear. Is $1000 ProgrammedEnglish Version
Header: SOLANA: Road to $500 is Clear. Is $1000 Programmed? 🚀
Long Setup Thesis:
We are on the verge of the strongest impulse for SOL in this cycle. Technicals and fundamentals have finally synchronized. Here is why I am aggressively long:
The Firedancer Factor 🔥: This isn't just

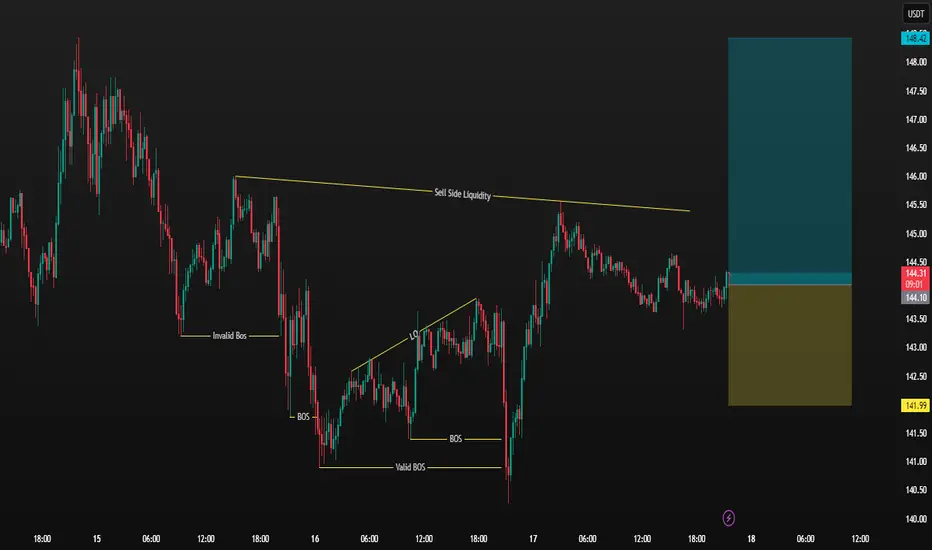
Can #SOL break through the resistance zone?📊Can #SOL break through the resistance zone?
🧠From a structural perspective, it's reasonable for us to encounter resistance and consolidate here. If the uptrend continues, then we can expect to see 152-160.
🤜If you like my analysis, please like💖 and share💬 BINANCE:SOLUSDT.P

Support and Resistance Area: 140.88-146.69
Hello, traders!
Follow us to get the latest information quickly.
Have a great day!
-------------------------------------
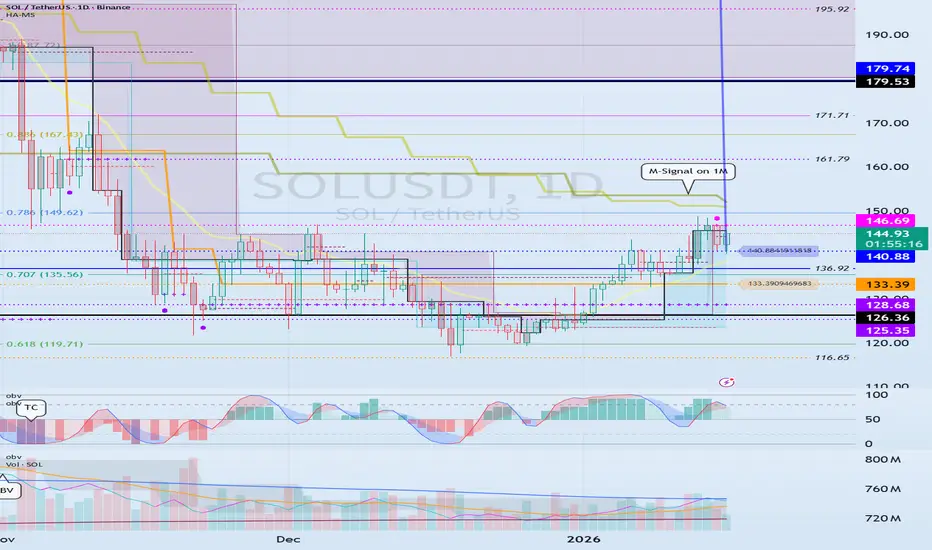
(SOLUSDT 1D Chart)
SOLUSDT is entering a new phase with the emergence of the DOM(60) and HA-High indicators.
Accordingly, the key question is whether the price can rise whil
SOLANA(SOLUSD)Short-Term OutlookSOLANA (SOLUSD) Short-Term Outlook 🚀
Key support seems to be near 130, where price has bounced multiple times recently, while resistance is around 144.8, the recent high.
Our target is 190 in short term.
The XABCD pattern mentioned suggests a potential move up to around 190, which would be a stro

See all ideas
Summarizing what the indicators are suggesting.
Oscillators
Neutral
SellBuy
Strong sellStrong buy
Strong sellSellNeutralBuyStrong buy
Oscillators
Neutral
SellBuy
Strong sellStrong buy
Strong sellSellNeutralBuyStrong buy
Summary
Neutral
SellBuy
Strong sellStrong buy
Strong sellSellNeutralBuyStrong buy
Summary
Neutral
SellBuy
Strong sellStrong buy
Strong sellSellNeutralBuyStrong buy
Summary
Neutral
SellBuy
Strong sellStrong buy
Strong sellSellNeutralBuyStrong buy
Moving Averages
Neutral
SellBuy
Strong sellStrong buy
Strong sellSellNeutralBuyStrong buy
Moving Averages
Neutral
SellBuy
Strong sellStrong buy
Strong sellSellNeutralBuyStrong buy
Displays a symbol's price movements over previous years to identify recurring trends.
Frequently Asked Questions
The current price of SOL / UST (SOL) is 128.55000000 USDT — it has risen 0.36% in the past 24 hours. Try placing this info into the context by checking out what coins are also gaining and losing at the moment and seeing SOL price chart.
SOL / UST price has fallen by −11.39% over the last week, its month performance shows a 3.31% increase, and as for the last year, SOL / UST has decreased by −48.60%. See more dynamics on SOL price chart.
Keep track of coins' changes with our Crypto Coins Heatmap.
Keep track of coins' changes with our Crypto Coins Heatmap.
SOL / UST (SOL) reached its highest price on Jan 19, 2025 — it amounted to 295.46000000 USDT. Find more insights on the SOL price chart.
See the list of crypto gainers and choose what best fits your strategy.
See the list of crypto gainers and choose what best fits your strategy.
SOL / UST (SOL) reached the lowest price of 7.89110000 USDT on Dec 29, 2022. View more SOL / UST dynamics on the price chart.
See the list of crypto losers to find unexpected opportunities.
See the list of crypto losers to find unexpected opportunities.
The safest choice when buying SOL is to go to a well-known crypto exchange. Some of the popular names are Binance, Coinbase, Kraken. But you'll have to find a reliable broker and create an account first. You can trade SOL right from TradingView charts — just choose a broker and connect to your account.
Crypto markets are famous for their volatility, so one should study all the available stats before adding crypto assets to their portfolio. Very often it's technical analysis that comes in handy. We prepared technical ratings for SOL / UST (SOL): today its technical analysis shows the sell signal, and according to the 1 week rating SOL shows the sell signal. And you'd better dig deeper and study 1 month rating too — it's sell. Find inspiration in SOL / UST trading ideas and keep track of what's moving crypto markets with our crypto news feed.
SOL / UST (SOL) is just as reliable as any other crypto asset — this corner of the world market is highly volatile. Today, for instance, SOL / UST is estimated as 3.31% volatile. The only thing it means is that you must prepare and examine all available information before making a decision. And if you're not sure about SOL / UST, you can find more inspiration in our curated watchlists.
You can discuss SOL / UST (SOL) with other users in our public chats, Minds or in the comments to Ideas.