SOMI Perpetual BUY SETUP , Bought From $1.38SOMI BUY SETUP
Currently $1.38
Bought From $1.38
Stop loss $0.90
(Trading plan If SOMI go down ,
to $1.22 will add more longs)
Expecting target $1.48 OR ABOVE
In the event of an early exit,
this analysis will be updated.
Its not a Financial advice

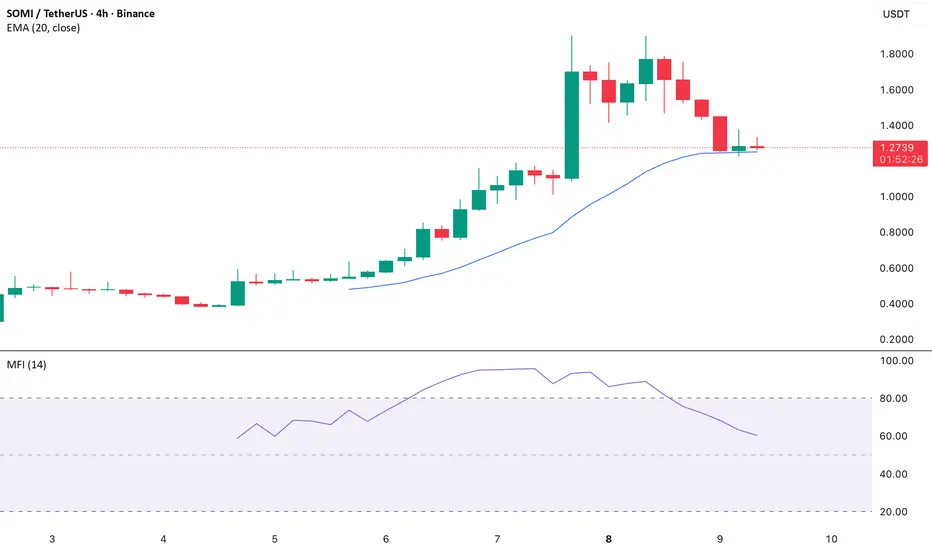
Money Flow Index Points to Selling Pressure
On the SOMI/USD four-hour chart, the Money Flow Index (MFI) has been trending downward, indicating a rise in selloffs. Since the MFI accounts for both price and volume, a decline confirms that sellers are steadily gaining control while buyers lose momentum.
SOMI’s recent price action has brought i
SOMI has had ENOUGHBINANCE:SOMIUSDT.P price action has created a big fair value gap at $1.28 area. This area must be revisited before the price can continue the bullish momentum.

SOMIUSDT – Watching Key Support Levels for Next Leg UpSomnia has shown strong bullish momentum on the 4H chart, forming consecutive continuation patterns before reaching the current consolidation zone. Price is now holding above the EMA, suggesting buyers still have control, but a correction into support is possible.
Key support levels:
1.01–1.19 (
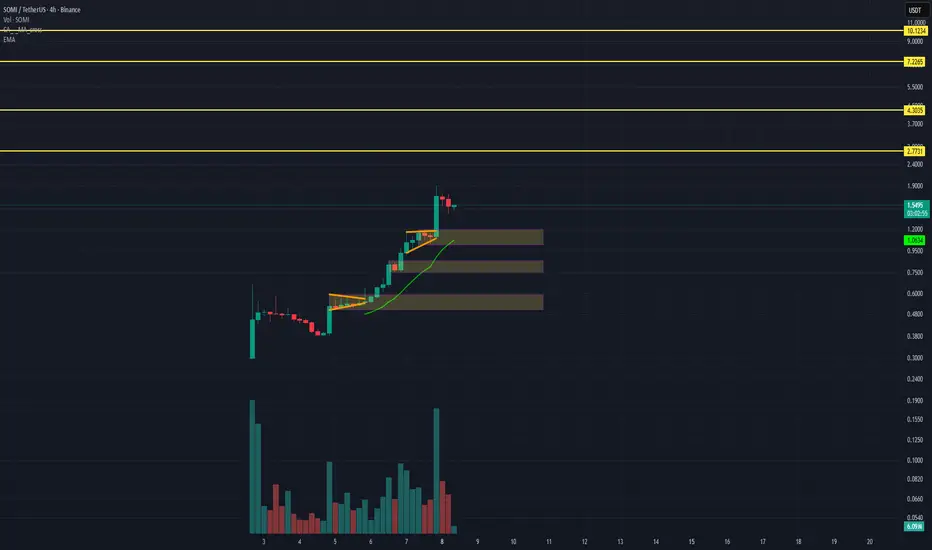
SOMI Coin Somnia Token Price Prediction and Technical AnalysisSOMI/USDT has staged an impressive recovery after bouncing strongly from the 0.8093 demand zone, reclaiming the 1.0816 support-turned-demand with momentum. Price is now pushing higher and approaching the 1.5758 resistance, which is the next major supply zone to watch. If bulls manage to hold above 1

SOMIUSDT - SHORT POSITION - 8XSOMIUSDT - SHORT POSITION - 8X
analysis only
your profit or loss is your business
no advice

somi short squeezesomi look good for short squeeze..
daily high volume in bottom.
potential tp 1 will be fibo 0.618.
tp 2: fibo 1
tp 3: fibo 1.618
tp 4: fibo 2

SOMIUSDT CHART ANALYSİSWHAT TYPE OF CRYPTO TRADER ARE YOU?
Perhaps the most important change is that the world has become much
more short-term oriented. All sorts of people who used to be investors
are now traders. In the 1990s and 2000s, the heroes were the long-term
investors; today, the heroes are the wise traders. T

See all ideas
Summarizing what the indicators are suggesting.
Oscillators
Neutral
SellBuy
Strong sellStrong buy
Strong sellSellNeutralBuyStrong buy
Oscillators
Neutral
SellBuy
Strong sellStrong buy
Strong sellSellNeutralBuyStrong buy
Summary
Neutral
SellBuy
Strong sellStrong buy
Strong sellSellNeutralBuyStrong buy
Summary
Neutral
SellBuy
Strong sellStrong buy
Strong sellSellNeutralBuyStrong buy
Summary
Neutral
SellBuy
Strong sellStrong buy
Strong sellSellNeutralBuyStrong buy
Moving Averages
Neutral
SellBuy
Strong sellStrong buy
Strong sellSellNeutralBuyStrong buy
Moving Averages
Neutral
SellBuy
Strong sellStrong buy
Strong sellSellNeutralBuyStrong buy