SOMI Perpetual BUY SETUP , Bought From $1.38SOMI BUY SETUP
Currently $1.38
Bought From $1.38
Stop loss $0.90
(Trading plan If SOMI go down ,
to $1.22 will add more longs)
Expecting target $1.48 OR ABOVE
In the event of an early exit,
this analysis will be updated.
Its not a Financial advice
SOMIUSDT.P trade ideas

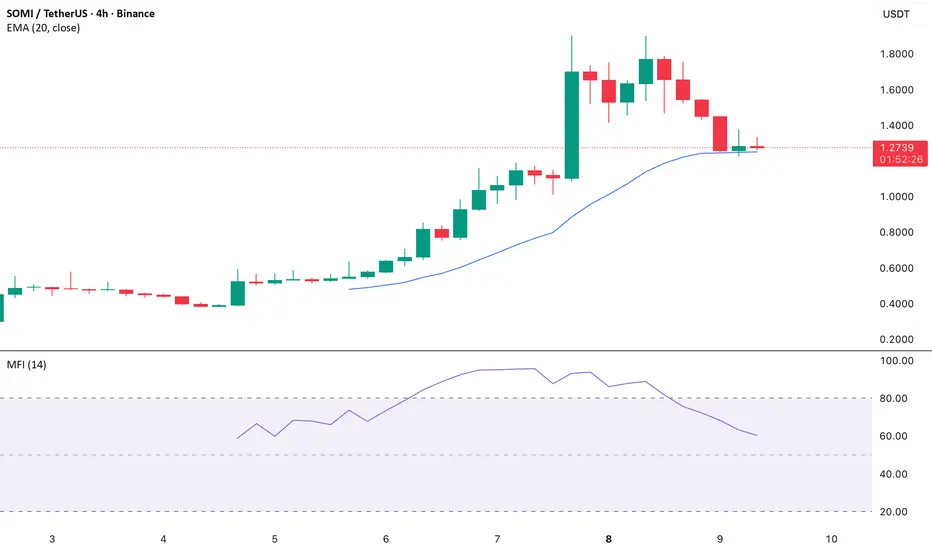
Money Flow Index Points to Selling Pressure
On the SOMI/USD four-hour chart, the Money Flow Index (MFI) has been trending downward, indicating a rise in selloffs. Since the MFI accounts for both price and volume, a decline confirms that sellers are steadily gaining control while buyers lose momentum.
SOMI’s recent price action has brought it closer to the 20-day Exponential Moving Average (EMA), underscoring fading buy-side strength. The EMA serves as a key gauge of short-term market sentiment—trading above it signals sustained bullishness, while a breakdown below suggests a bearish shift.
If SOMI closes decisively below the 20-day EMA, it would signal a move away from the token’s early post-launch optimism toward a more bearish phase. Such a breakdown could invite heavier selling pressure, paving the way for deeper losses ahead.
SOMI has had ENOUGHBINANCE:SOMIUSDT.P price action has created a big fair value gap at $1.28 area. This area must be revisited before the price can continue the bullish momentum.

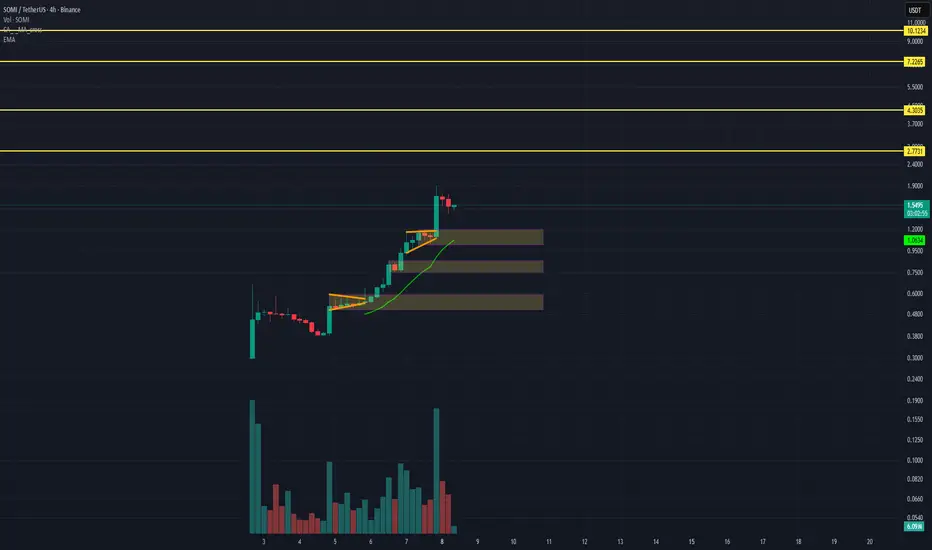
SOMIUSDT – Watching Key Support Levels for Next Leg UpSomnia has shown strong bullish momentum on the 4H chart, forming consecutive continuation patterns before reaching the current consolidation zone. Price is now holding above the EMA, suggesting buyers still have control, but a correction into support is possible.
Key support levels:
1.01–1.19 (1st demand zone, near EMA)
0.75–0.85 (2nd major support)
0.50–0.60 (deeper retracement)
Potential upside targets if bullish momentum resumes:
2.77 as the first resistance zone
4.30 , 7.23 , and 10.12 as extended targets on continuation
A break below 1.01 could signal a deeper pullback, while holding above this zone may fuel another impulsive move. Volume spikes support strong interest, but traders should be cautious of volatility.
Disclaimer: This is not financial advice; do your own research.
SOMI Coin Somnia Token Price Prediction and Technical AnalysisSOMI/USDT has staged an impressive recovery after bouncing strongly from the 0.8093 demand zone, reclaiming the 1.0816 support-turned-demand with momentum. Price is now pushing higher and approaching the 1.5758 resistance, which is the next major supply zone to watch. If bulls manage to hold above 1.0816, continuation toward 1.5758 looks likely. However, failure to maintain above this breakout area could send price back into the 0.8093 demand base for another retest before resuming higher.
📈 Key Levels:
Buy trigger: Retest/hold above 1.0816 support
Buy zone: 1.08 – 1.10 region
Target: 1.5758 resistance
Invalidation: Daily close below 0.8093 (would weaken bullish structure)
👉 Follow me for More Real Time Opportunities.
Share your Thoughts if you have any?

SOMIUSDT - SHORT POSITION - 8XSOMIUSDT - SHORT POSITION - 8X
analysis only
your profit or loss is your business
no advice

somi short squeezesomi look good for short squeeze..
daily high volume in bottom.
potential tp 1 will be fibo 0.618.
tp 2: fibo 1
tp 3: fibo 1.618
tp 4: fibo 2

SOMIUSDT CHART ANALYSİSWHAT TYPE OF CRYPTO TRADER ARE YOU?
Perhaps the most important change is that the world has become much
more short-term oriented. All sorts of people who used to be investors
are now traders. In the 1990s and 2000s, the heroes were the long-term
investors; today, the heroes are the wise traders. Trading created one of
the best ways to become wealthy in this decade. Why?
Your race does not matter. Your skin color does not matter. Your
education does not matter, whether you are a Ph.D. or a college drop out.
Your sex does not matter. Your origin does not matter. Your age does
not matter. Your background and history do not matter. Your language
does not matter. Your look does not matter. And your social status does
not matter as long as you have sufficient funds to trade. You do not have
to hire any employees. You do not have to buy or rent expensive office
space. I could go on and on, but I think you get the picture.
