MAJOR TURN 2/9/2026 plus or minus 1 TD This is the chart I promised to Post But waited till Now . This is my forecast Updated as I have said the market will see 5600/6100 easy my and on 10/10 to 10/20 2026 in the form a large ABC decline ! I see the market still seeing a 7031 in Cash SP 500 into 2/9/26 Best of trades WA
S&P 100 Index
No trades
Related indices

TOP of WAVE 5 OF 3 of 5 in the SP 100The chart posted is the SP 100 index this is a true reflection of what I see as the wave structure since my call at the low April 7th for wave 4 . I see a sharp panic nearing into oct 10 to the 20th with an outside chance 11/2/4 What I see is a drop of .238 to .382 from the low of April 21
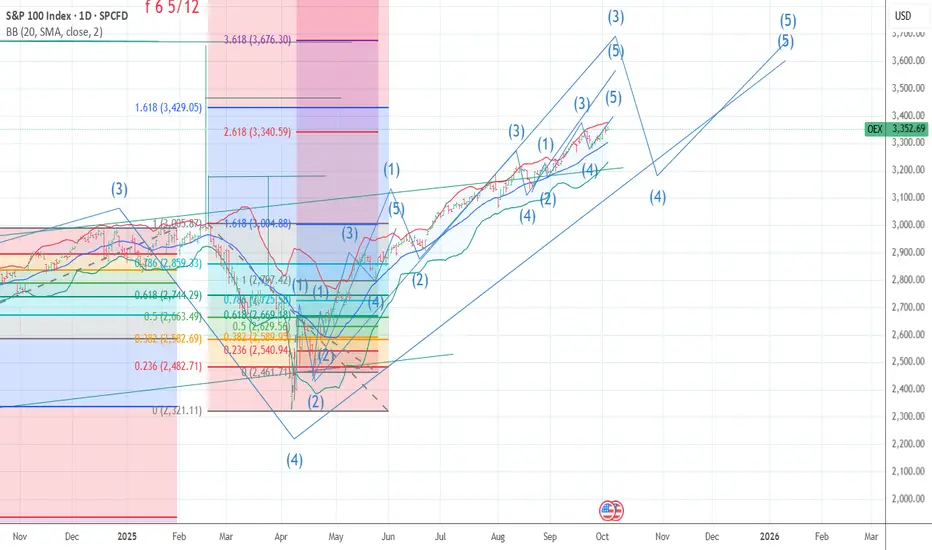
OEX /SPX Bullish wave 5 pattern crossroads The chart posted is the sp 100 I am posting it as we are now at the crossroad for bull or bear count .We have rallied to .786 as I will show and have a wave a x 1.27 = c at the .786 High But if we break above 5922 in the Cash SP 500 There is NOTHING to stop it from reaching a target of

Oex 4 hourly chart so you can see in detail The chart posted should be view as a guide to what is a Crossroad in all indexes Today best of trades wavetimer!

MAY 12th Major and Minor SPIRAL TURN Well we are now Knocking at the door of .786 of the drop and have met this at the spiral turn from feb 18th top 2020 and feb 18th 2025 I have moved back to a short based on 4 things 1 st PUT/call models 2nd fib relationship 3 rd wave structure 4th spirals best of trades WAVETIMER

spiral point turn 4/25 plus or minus .5 May 12th Major The chart posted is the SP 100 OEX we hit at the low near perfect math and now we are at 50 % of the drop Markets are at a crossroad best of trades WAVETIMER

OEX MonthlyHigh lite the last recent notable monthly timeframe corrections range from 9 to 24 months.

I have now moved to an 80 % long PUTS in SPY and QQQ and SMHBased on the chart posted the OEX 100 is at a crossroad I can count this Two ways first the bullish count we are ending a wave 1 up of 5 of 5 in the blowoff wave and we would see an small abc decline toa .382 then I would cover Or if we break the .50 % pullback would would look for a s

WAVE 5 of 5 of 5 late stagesThe chart posted shows my top view of the wave structure I see today as ending wave 3 of 5 of 5 of 5 look for a minor pullback and then a final peak into monday or tuesday 5554/5631 So why am i just moving to 90% long puts because naaim snd PUT/CALL spirals are in the window as I said from 7/5

Thin AIR OEX I am now 33% long puts The sp 100 has reached into the fib relationship of a major top the sp 500 has Entered the min 5510 to 5531 RSI bearish setup I had hoped and the word is HOPED we print 5554 /5585 BUT cycles are running out and the Fang sector aka AAPL targets and msft in the lower end of super cycle targets

See all ideas
Summarizing what the indicators are suggesting.
Oscillators
Neutral
SellBuy
Strong sellStrong buy
Strong sellSellNeutralBuyStrong buy
Oscillators
Neutral
SellBuy
Strong sellStrong buy
Strong sellSellNeutralBuyStrong buy
Summary
Neutral
SellBuy
Strong sellStrong buy
Strong sellSellNeutralBuyStrong buy
Summary
Neutral
SellBuy
Strong sellStrong buy
Strong sellSellNeutralBuyStrong buy
Summary
Neutral
SellBuy
Strong sellStrong buy
Strong sellSellNeutralBuyStrong buy
Moving Averages
Neutral
SellBuy
Strong sellStrong buy
Strong sellSellNeutralBuyStrong buy
Moving Averages
Neutral
SellBuy
Strong sellStrong buy
Strong sellSellNeutralBuyStrong buy
Displays a symbol's value movements over previous years to identify recurring trends.