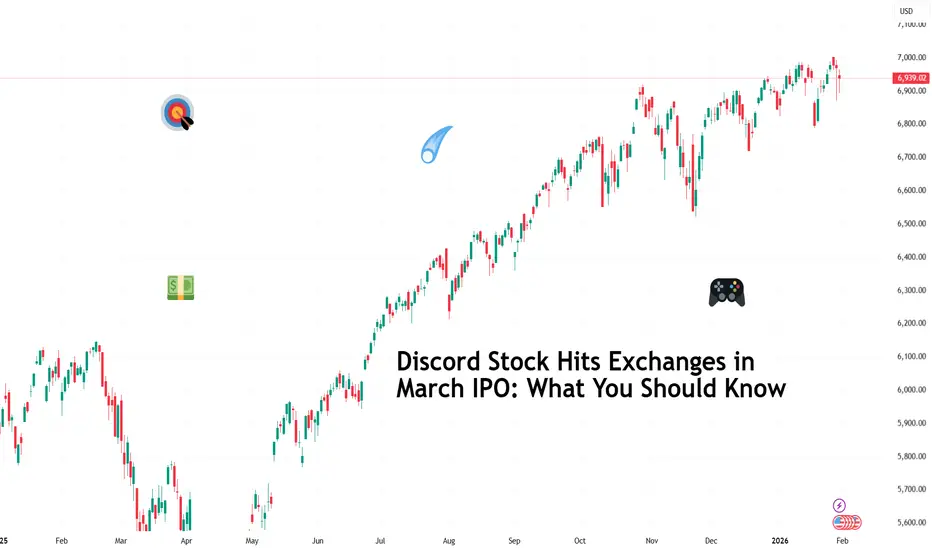
Discord Stock Hits Exchanges in March IPO: What You Should KnowDiscord NASDAQ:DISCORD has filed confidential IPO paperwork with the SEC and is aiming for a March debut (ref: the IPO calendar ), reigniting speculation around one of Silicon Valley’s most closely watched private companies.
The late-stage startup has lined up heavyweight underwriters Goldman Sa
S&P Index Cash CFD (USD)
No trades
US500: Risk of a Deeper CorrectionUS500: Channel breakdown should signal a risk of a deeper correction
US500 has been trading inside a rising channel, but recent price action shows clear weakness near the upper boundary. The rejection from the channel top suggests buyers are losing control and a corrective move may already be unde

S&P 500 Future Outlook: Green Zone Capital Targets 8,000Summary:
The TVC:SPX remains in a structural uptrend, trading within a defined rising channel. After a strong advance into our previous target of 7,000, price has pulled back and is consolidating near ~6,800, a healthy reset that keeps structure intact and offers a potential re-entry window.
T

A-B-C correction patternSeems like we have an ABC correction with the B wave at 0.618 Fibo level
If you have any idea please share
No financial advise

Wave B Completion at 0.786 Fib? Potential Flat Correction SetupTechnical Analysis:
Structure: Following the initial impulse (Wave A), the market executed a deep correction. By piercing the 0.618 level and rejecting the 0.786, the structure has likely shifted from a simple Zigzag to a Flat Correction.
Reaction: The 0.786 level acted as a strong resistance zone

Hellena | SPX500 (4H): SHORT to support area of 6849.I haven't updated my forecast for SNP in quite some time, but in reality, little has changed, and I believe that the upward movement is not yet over.
Within the higher-order upward wave “5,” I am observing the completion of the medium-order wave ‘1’ and therefore expect a correction in wave “2.”
I

SPX500: Bearish Drop to 6850?As the previous analysis worked exactly as predicted, FX:SPX500 is eyeing a bearish reversal on the 4-hour chart , with price testing a key resistance zone after lower highs, converging with a potential entry area that could trigger downside momentum if sellers defend amid recent volatility.

SPX500 | Risk Sentiment Weakens After Precious Metals SelloffSPX500 | Pressure Builds as Precious Metals Selloff Shakes Risk Appetite
U.S. stock index futures moved lower as a violent selloff in precious metals unsettled investor sentiment at the start of a week packed with corporate earnings and key economic data. The abrupt reversal in metals has raised br

Updated wave structure for the Cash sp 500 Major turn is at hand Under the current wave structure and Fib relationships within the waves We have forming a Major Top The breakdown in IGV is the canary in the coal mine and The 10 and 20 year bonds markets show a breakdown forming The rotation is nearing the end of what I call the g

S&P 500 Breakdown Retest — Bears in Control, Bigger Drop Ahead?Today, I want to share a short setup on the S&P 500( SP:SPX ). Given that the crypto market—especially Bitcoin( BINANCE:BTCUSDT )—has recently regained strong correlation with the S&P, this analysis may be important for the crypto community too.
The S&P 500, over the past 20 days, has shown upward

See all ideas
Displays a symbol's value movements over previous years to identify recurring trends.
Frequently Asked Questions
S&P Index Cash CFD (USD) reached its highest quote on Jan 28, 2026 — 7,017.39 USD. See more data on the S&P Index Cash CFD (USD) chart.
The lowest ever quote of S&P Index Cash CFD (USD) is 2,177.62 USD. It was reached on Mar 23, 2020. See more data on the S&P Index Cash CFD (USD) chart.
S&P Index Cash CFD (USD) is just a number that lets you track performance of the instruments comprising the index, so you can't invest in it directly. But you can buy S&P Index Cash CFD (USD) futures or funds or invest in its components.