SPX500 Blueprint Confirms a Bullish Flow Reversal!🏃♂️💨 SPX500 Heist: The Bullish Getaway Plan! (Swing Trade Blueprint)
The market's pulling back, but the big money is still accumulating! We've spotted a bullish setup on the SPX500, and we're planning a strategic "thief-style" entry to catch the next leg up. This isn't a reckless smash-and-grab; it's a calculated heist. 🗿
📊 The Master Plan: Technical Blueprint
Direction: 🟢 BULLISH
Trend Confirmation: Strong bullish structure confirmed by the Triangular Moving Average (TMA).
Entry Signal: We're looking for a retest and bounce from the Simple Moving Average (SMA), suggesting the pullback is a healthy accumulation phase before the next move higher.
🎯 The Heist Strategy: Execution & Logistics
🚪 Entry Protocol: "Layered Limit Orders"
We're not chasing the price. We're setting traps! Using a layered limit order strategy to average into the trade at key levels.
Suggested Buy Zones (Layer Your Orders):
Layer 1: 6780
Layer 2: 6760
Layer 3: 6740
Layer 4: 6700
Feel free to adjust the number of layers and levels based on your own risk appetite.
🚨 Escape Route: Stop Loss
Every good thief has an exit plan if the heist goes south.
Stop Loss (The Getaway Car): A break below 6680 suggests the plan is invalid. This is our "abort mission" signal.
⚠️ Note to the Thief OG's: This is my planned SL. You are the master of your own capital. Manage your risk accordingly!
💰 Profit Target: Cashing the Loot
We're aiming for a major resistance zone where the "police" (sellers) are likely waiting.
Take Profit Target: 6900
Why here? This area acts as a strong technical resistance, potentially an overbought trap. Our goal is to escape with the profits before any reversal!
⚠️ Note to the Thief OG's: This is my target. You can take money off the table whenever you see fit. Partial profits are always a smart move!
🔍 Related Markets to Watch
AMEX:SPY (SPDR S&P 500 ETF): The direct ETF tracker. Moves in near-perfect correlation.
CME_MINI:ES1! (S&P 500 E-mini Futures): The futures market often leads the price action in the index.
/ES (Micro E-mini S&P 500 Futures): A smaller contract size with the same directional bias.
NASDAQ:NDX (Nasdaq 100 Index): Often moves in tandem with the SPX; a strong NDX can pull SPX higher.
TVC:DXY (US Dollar Index): A strong inverse correlation. A weaker Dollar is generally bullish for US equities.
✨ Key Takeaways
Strategy: Bullish Swing Trade on a pullback.
Method: Layered limit order entries for optimal average price.
Catalyst: TMA & SMA support holding as accumulation zones.
Goal: Capture the move towards 6900 resistance.
✨ “If you find value in my analysis, a 👍 and 🚀 boost is much appreciated — it helps me share more setups with the community!”
Hashtags: #SPX500 #TradingSetup #SwingTrading #US500 #TradingPlan #Bullish #MarketAnalysis #TechnicalAnalysis #TradingView #ThiefStrategy
Trade ideas

S&P500 Both short and long term bullish targets intact.The S&P500 index (SPX) continues to trade within its 5-month Channel Up and last Friday's pull-back to its 1D MA50 (red trend-line) again is another testament to it as it rebounded exactly on its bottom, making yet another Higher Low.
As we've shown on our previous analysis its short-term Target is the 1.382 Fibonacci extension at 6850. Ahead of a massive 1D MACD Bullish Cross however, we can see (after another short pull-back) the index extending much higher to its 2.5 Fibonacci extension (orange) at 7150 before a larger correction takes place.
-------------------------------------------------------------------------------
** Please LIKE 👍, FOLLOW ✅, SHARE 🙌 and COMMENT ✍ if you enjoy this idea! Also share your ideas and charts in the comments section below! This is best way to keep it relevant, support us, keep the content here free and allow the idea to reach as many people as possible. **
-------------------------------------------------------------------------------
💸💸💸💸💸💸
👇 👇 👇 👇 👇 👇

SPX: S&P500 An Economical Reset Again?Technically, the chart is vivid and self-explanatory.
The RSI (14) is implicating an obvious Negative Divergence before the last downturn and the chart recent structure.
The US treasury has no other option but printing more and more bucks, or cutting the interest rates. I don't know any other financial instruments.
Fundamentally, no market structure can soar or fall eternally.
I have had a look on BTC and Gold Futures. Gold has some room during the coming years. Yet, regarding bitcoin, according to futures I prefer not to be too optimistic.
The implications at the moment are only some assumptions and the future remains a uncertain. This is a systematic luck guess and bet.
We have several barometers and tools based on which we can Approximate the possibilities through a few scenarios and nothing more.
Eventually, we need to check those factors and barometers and practice several reasonable scenarios on our capital.
This is not a financial advice, but it is a serious warning against perils if an over-financialization phenomenon following almost a century from that black era of high unemployment and economical downturn that the US experienced in 1930s.
DYOR
Please like and follow and have your comments inhere.

S&P 500 looks Bearish Correction But Fed is Coming...SPX500 – Technical & Fundamental Overview
The index remains under bullish momentum, but a short-term correction toward 6838 from the pivot line at 6889 is possible before the next directional move.
Technical Outlook:
A 1H close below 6839 would confirm a bearish reversal, targeting 6769 as the next support.
However, a 1H close above 6889 would reinforce the bullish trend, paving the way toward 6941 and 6991 — with potential for a momentum-driven continuation if sentiment stays positive.
Pivot Line: 6889
Support Levels: 6840 · 6800 · 6769
Resistance Levels: 6940 · 6991
Fundamental Context:
Traders are positioning cautiously ahead of this week’s Trump–Xi trade talks, which could shape near-term market sentiment. Optimism over a potential U.S.–China tariff framework and expectations that the Federal Reserve may cut rates again are supporting risk appetite.
However, with indices at record highs and AI-related stocks heavily concentrated, any disappointment in the trade outcome or earnings results could spark a sharper downside reaction.
In short, bullish while above 6889, but watch for volatility driven by trade headlines and Fed signals in the coming sessions.

S&P500 INDEX | Bulls in Control Above 6,889 Ahead of Fed CutSPX500 – MARKET OVERVIEW | Bullish Momentum Builds Ahead of Fed Decision 🇺🇸
Barclays equity strategists believe stocks will continue their strong rally into year-end, despite some “pockets of froth.”
The Federal Reserve is widely expected to cut interest rates later today, with growing speculation it may also slow or end balance sheet reduction, further supporting risk assets.
Technically, the SPX500 has stabilized above 6,889, confirming bullish momentum and signaling potential continuation toward 6,941 and 6,991.
As long as the index trades above 6,889, the bias remains bullish.
However, to shift toward a bearish trend, the price would need to stabilize below 6,889, which could trigger a decline toward 6,842 and 6,755.
Key Technical Levels
Pivot Line: 6,889
Resistance: 6,941 · 6,991
Support: 6,843 · 6,760
Outlook:
SPX500 remains bullish above 6,889, supported by expectations of a Fed rate cut and year-end equity strength.
A confirmed break below 6,889 would shift momentum to bearish, targeting deeper corrections toward 6,842–6,755.

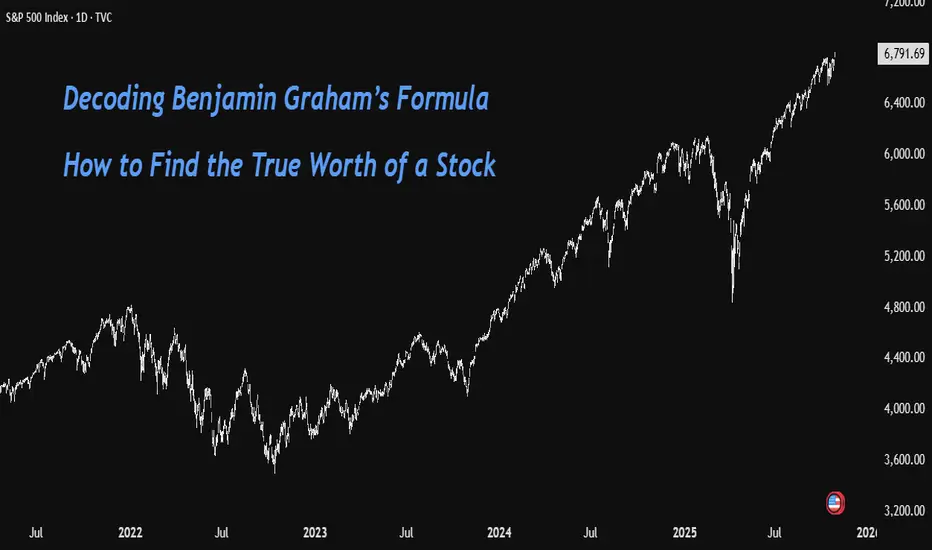
Graham's Formula for Intrinsic Value of a Stock➡ About Benjamin Graham
Benjamin Graham is widely known as the Father of Value Investing. He was a professor, economist, and mentor to great investors like Warren Buffett. Graham’s investment philosophy focused on buying stocks below their intrinsic value to ensure a margin of safety and protecting capital even when markets behave irrationally. His books The Intelligent Investor and Security Analysis remain timeless classics in the world of investing.
➡ His Formula to Calculate the Intrinsic Value of a Stock
Graham designed a simple mathematical model to estimate what a stock is truly worth- its intrinsic value.
Formula:
V=EPS×(8.5+2g)
Later, he modified it to account for changing interest rates:
V= /Y
Meaning of Each Value in the Formula
V: Intrinsic value or the fair value of the stock.
EPS: Earnings per share (trailing twelve months).
8.5: Base P/E ratio for a no-growth company.
g: Expected annual earnings growth rate (for next 7–10 years).
4.4: Average yield on high-grade corporate bonds when Graham proposed the formula.
Y: Current yield on AAA-rated corporate bonds (used to adjust for changing interest rate conditions).
➡ How to Calculate
Let' sunderstand the calculations with the help of an example of NVDA stock:
EPS= 3.5 (TTM)
Growth rate= 32.8 (next 3-5years)
Y= 4.09
All other values remain the same
V= / 4.09
V= 279
So, the intrinsic value of the stock would be around 279
Current price= 186
Difference= 67%
Hence the Formula suggests that the current price is still way below its fair value and hence buyable.
➡ Are these Too Aggressive Valuations?
Yes, it may be too optimistic. The term '2g' gives very high weightage to growth, which can inflate valuations quickly. In a world where corporate earnings growth is less predictable and global interest rates fluctuate, this approach may overvalue companies that appear to have strong growth potential on paper.
➡ Relevance in the Current Market Scenario
While Graham’s formula is historically important and a great conceptual framework for understanding valuation, it should not be used as a standalone tool today. Markets are far more complex and influenced by globalization, technology, inflation, and interest rate cycles.
A more balanced approach is to use Graham’s principles (margin of safety, valuation discipline) but rely on modern valuation models like Discounted Cash Flow (DCF) or Relative Valuation Ratios and treat the formula as a learning foundation rather than a precise valuation tool.
What do you think about this tool for calculating a stock's valuation?
Is it still relevant?
Do 🚀 comment 💬
Disclaimer: I am not a valuation analysis expert so apply your due diligence while investing. The stock example taken in this educational post is just for demonstration purpose and not a buy/sell recommendation.
SPX500 | Consolidation Phase Before BreakoutSPX500 – MARKET OUTLOOK | Consolidation Phase Before Breakout 🇺🇸
The S&P 500 is consolidating between 6,918 and 6,879, as traders await the next breakout following recent Fed guidance and earnings results.
Above 6,918: Bullish continuation toward 6,941 → 6,991.
Below 6,879: Opens correction toward 6,842 → 6,770.
Pivot: 6,918
Support: 6,879 · 6,843 · 6,770
Resistance: 6,941 · 6,991
SPX500 remains range-bound, but a breakout from this zone will define the next trend direction.

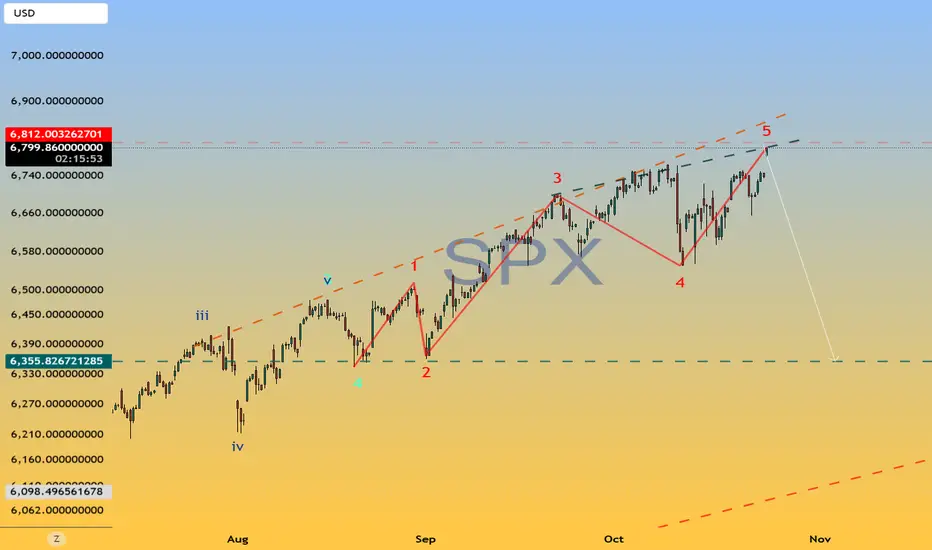
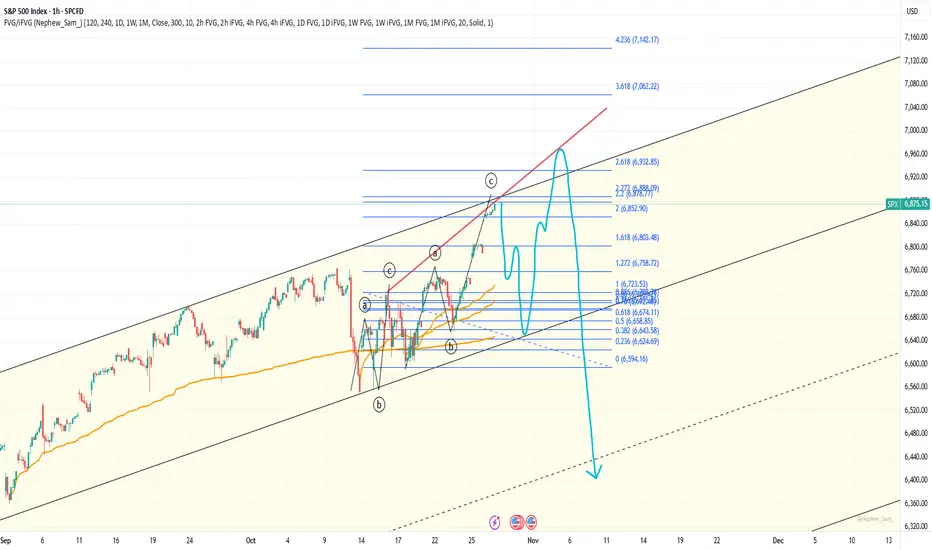
This is the END(ing diagonal)The ending diagonal has formed. If you check RSI you will see a double daily and fresh WEEKLY divergence. It will crash hard next week. 6480 is the first target, but it can be just a bounce area. 1.618 level from low to top of the diagonal is at 6400 level on SPX and at 6300 level on US500 - I think we can get a flash-crash into this area next week. And if this is a reversal, it can trend down to February peak and lower according to fibs.
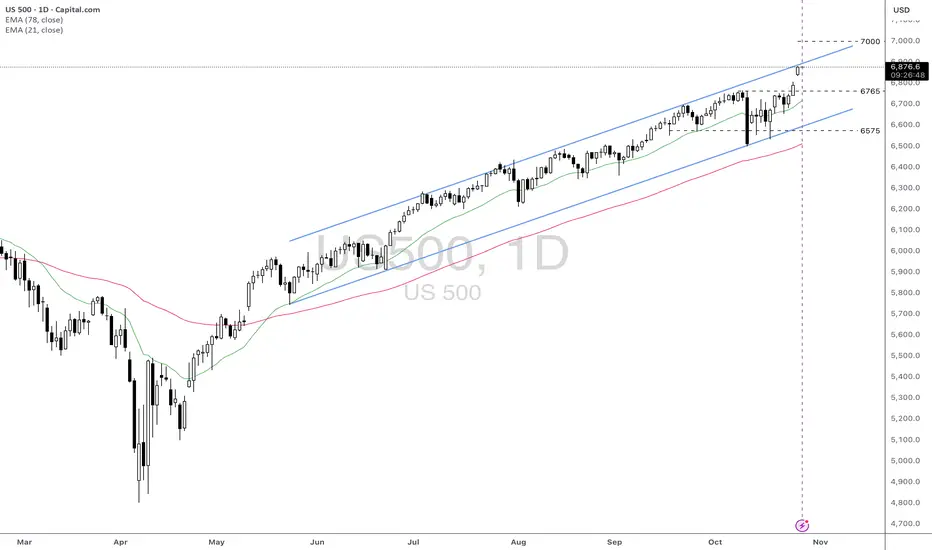
US500: Strong Upward Momentum Approaching 7000 LevelFundamental approach:
- The US500 advanced this week, propelled by strong earnings momentum from tech giants and robust performance in select sectors. Among top movers, Qualcomm rose over 11% following upbeat earnings guidance, while Alphabet and Tesla also rallied ahead of their highly anticipated quarterly results. W.R. Berkley Corporation and Welltower Inc. were notable gainers, reflecting sector rotation and risk-on flows in the index.
- Earnings from the 'Magnificent Seven', including Microsoft, Alphabet, and Meta, drove sentiment, with over 86% of S&P 500 companies reporting results above consensus expectations so far this quarter. Tesla's performance was mixed, while Amazon is set to announce slightly lower profits, but the broader group is still outpacing the rest of the market in earnings growth.
- Tech earnings and the upcoming FOMC decision are key catalysts that may influence future US500 moves. Broad sector participation and ongoing AI investment could sustain upward momentum if macroeconomic conditions remain supportive.
Technical approach:
- US500 created a new all-time high this week after breaching the key level at around 6765. The index showed an urgency in moving upward, creating a gap that remains unfilled. US500 is well above the diverging EMAs, indicating a strong upward momentum. However, the index is approaching the upper bound of the ascending channel, which may limit the price movement.
- If the current gap remains unfilled, the US500 may continue to move upward and test the psychological resistance at 7000.
- On the contrary, rejecting the channel's upper bound may prompt a correction and fill the gap around 6790, retesting the broken level at 6765.
Analysis by: Dat Tong, Senior Financial Markets Strategist at Exness
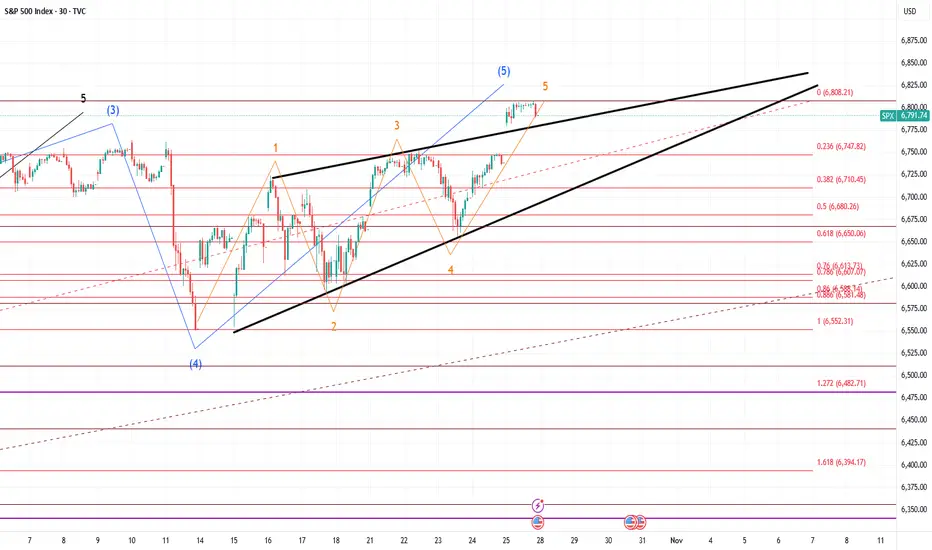
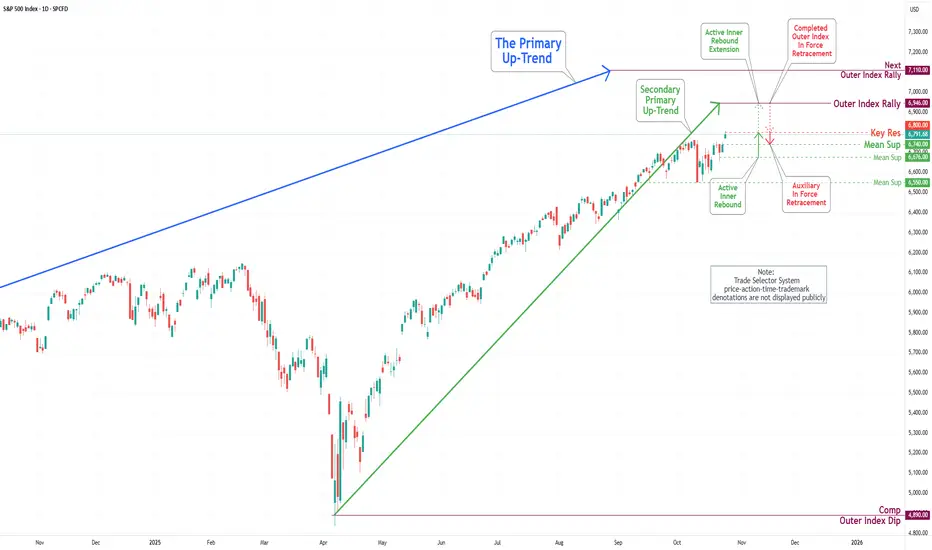
S&P 500 Daily Chart Analysis For Week of Oct 24, 2025Technical Analysis and Outlook:
The most recent trading session exhibited significant volatility in the S&P 500 Index, marked by pronounced price fluctuations between the Mean Resistance at 6671 and the Key Resistance at 6753. This range served as a crucial threshold for market participants, prompting a series of rapid buying and selling that influenced the index's overall wild movement. Ultimately, this price action culminated in a breakout above the completed Outer Index Rally at 6768.
At present, the index is situated at the newly established Key Resistance level of 6800, which lies just below the historical high of 6807. This positioning indicates the potential for further upward momentum, as the prevailing trend suggests a well-structured Active Inner Rebound extension toward the Next Outer Index Rally target of 7110.
Conversely, it is imperative to acknowledge the possibility of a sustained, steady-to-lower pullback from the Key Resistance level of 6800 to Mean Support 6740 for the Secondary Primary Up-Trend to continue on its path.
Failure to Reach 6813 Will Result In Bloodshed for SPXThis will get ugly very quick if buyers/investors can't reach 6813 quickly.
SPX500: Trump's trip to East Asia shakes marketsHello Traders,
This is the Daily Chart!!
We had great bullish year! A bullish channel is crystal clear! we are about to be considered as overbought buyers! But since it's stocks and the channel is broken, we are till bullish!!
And this is the chart of recent 3M,
1- the break is powerful.
2- we need a correction, technically.
3- we are about the mid-term channel.
4- top of the long-term channel could also be firsthand support, they call it SL hunt, I don't.

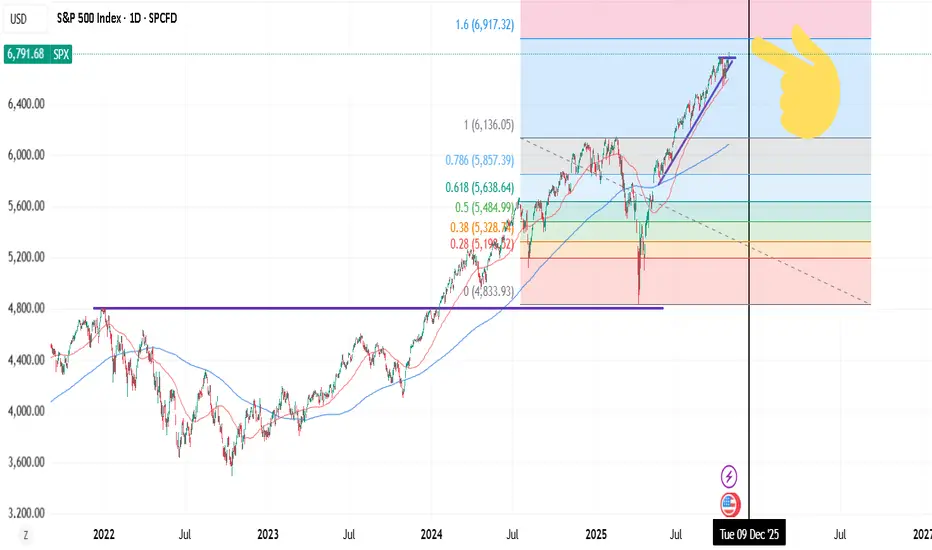
Fib's extensionIf so, then this thing won't stop until it reaches the purple level. That's where the correction could really begin. I'm not ready to say when yet, because the angle of attack could be either gradual or exponential, depending on the economy and the political situation.

1.6 FIB Ceiling - Stock market correction soon in NOV/DEC.You can apply 1.6 FIB to FAANG or QQQ for high probability ceilings. VIX "structure" (pattern) or setup also indicates it. Stocks forming a sharp "wedge drop", extension from 50dma.
Bullish near term (probably?), correction in NOV/DEC.
I wonder if the first 5 (monthly) trading days in NOV are not volatile AF. 😂
Weekend Analysis: DXY, BTC, Gold, Silver, Nas100 and SPX500In this video presentation I am expecting the dollar index to continue its uptrend on the lower time frame towards the liquidation level target of 99.500.
Bitcoin is still in a distribution range and currently correcting the sharp sell off from $126,296. I am observing an A-B-C corrective pattern potentially to targets of either $115,044 or $117,653. These are confluence of resistance level and will be expecting a sell off from these levels. If these levels gets invalidated then potentially the all time highs of $126k is in view. However that's not my expectation so a breach of the target level will invalidate the bearish analysis on Bitcoin.
I think Gold and Silver have peaked out for now and smart money is off loading to FOMO retail traders. I am expect Silver to sell off much faster than Gold.
Nas100 and SPX500 clinched to a breakout of new highs but the buying volume is fading out and seems to be a fake out. I will be watching if the breakout levels gets support or breakdown on pullback to decide a long position or short position.
This is my opinion on the market this week and I thank you for your time to visit my publications.
Have a great trading week and don't forget risk and money management is your first job as trader or investor. Cheers!!

THE SPX (S&P500) IS HEADING UPWARDS! time to buyThe SPX has been stuck inside an upward channel for many weeks and has been bouncing between both support and resistance levels. It has recently broken through a powerful resistance zone which was holding it... which means it is now very likely to keep heading to the upside.

SPX500 ShortElite analysis
2 Possibilities
Price reacted off 4h structural liquidity
targets, lower liquidity pools

SPX500 H4 | Potential Bearish ReversalS&P500 is reacting off the sell entry at 6,888.42, which aligns with the 100% Fibonacci projection and could reverse from this level to the take profit.
Stop loss is at 6,950, whic is a swing high resistance level.
Take profit is at 6,761.08, which is a pullback support that aligns with the 38.2% Fibonacci retracement.
Stratos Markets Limited (tradu.com ):
CFDs are complex instruments and come with a high risk of losing money rapidly due to leverage. 68% of retail investor accounts lose money when trading CFDs with this provider. You should consider whether you understand how CFDs work and whether you can afford to take the high risk of losing your money.
Stratos Europe Ltd (tradu.com ):
CFDs are complex instruments and come with a high risk of losing money rapidly due to leverage. 70% of retail investor accounts lose money when trading CFDs with this provider. You should consider whether you understand how CFDs work and whether you can afford to take the high risk of losing your money.

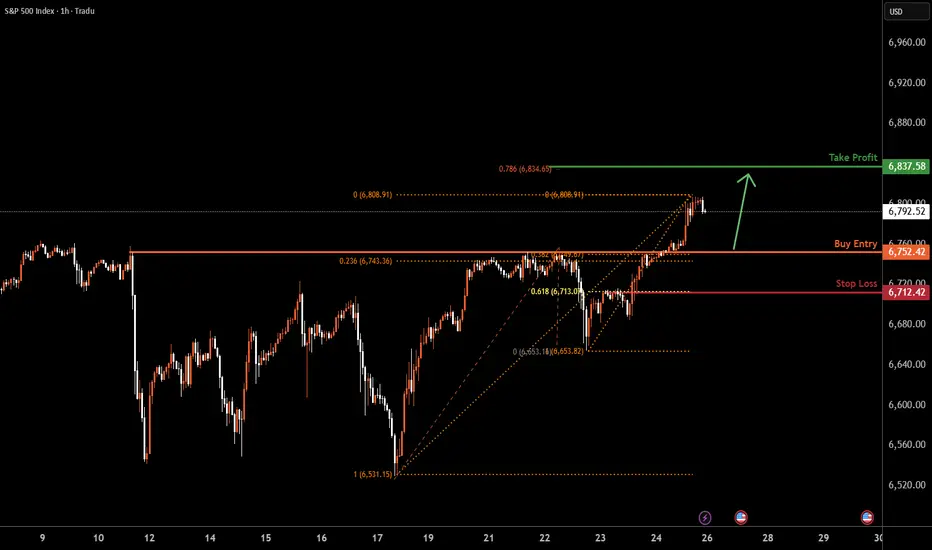
SPX500 | Price Falling Toward Key Pullback SupportS&P500 is falling towards the buy entry at 6,752.42, which is a pullback support that aligns with the 23.6% and the 38.2% Fibonacci retracement and could bounce from this level to the upside.
Stop loss is at 6,712.42, which is a pullback support that lines up with the 61.8% Fibonacci retracement.
Take profit is at 6,837.58, which aligns with the 78.6% Fibonacci projection.
Stratos Markets Limited (tradu.com ):
CFDs are complex instruments and come with a high risk of losing money rapidly due to leverage. 68% of retail investor accounts lose money when trading CFDs with this provider. You should consider whether you understand how CFDs work and whether you can afford to take the high risk of losing your money.
Stratos Europe Ltd (tradu.com ):
CFDs are complex instruments and come with a high risk of losing money rapidly due to leverage. 70% of retail investor accounts lose money when trading CFDs with this provider. You should consider whether you understand how CFDs work and whether you can afford to take the high risk of losing your money.
S&P 500 (US500) MASSIVE TECHNICAL BREAKDOWN | ULTIMATE Trading 🚀 S&P; 500 (US500) MASSIVE TECHNICAL BREAKDOWN | Oct 27-31, 2025 | ULTIMATE Trading Strategy 📊
Current Price: 6,792.5 | Strategy: Intraday Swing Trading | Timeframes: 5M → 1D Analysis ⏰
━━━━━━━━━━━━━━━━━━━━━━━━━━━━━━━━━━━━━━━━━━━━━━━━━━━━━━━━━━
💪 DAILY (1D) ANALYSIS - Swing Trader's Powerhouse Setup
S&P; 500 on the daily timeframe is displaying STRONG BULL STRUCTURE near support zones offering clean entry opportunities this week! 🎯
━━━━━━━━━━━━━━━━━━━━━━━━━━━━━━━━━━━━━━━━━━━━━━━━━━━━━━━━━━
⚡ 4-HOUR (4H) SWING TRADE SETUP - PRIMARY ENTRY BLUEPRINT
The 4H timeframe is showing TEXTBOOK BREAKOUT FORMATION! When price closes above 6,840 with volume spike = AGGRESSIVE LONG ENTRY triggered! Ichimoku Cloud on 4H shows bullish cloud color with price above all components = strong continuation bias locked in! 📊
━━━━━━━━━━━━━━━━━━━━━━━━━━━━━━━━━━━━━━━━━━━━━━━━━━━━━━━━━━
🎯 1-HOUR (1H) INTRADAY EXECUTION ZONE - Strike Point Identified
Hourly chart displaying PERFECT CONSOLIDATION BREAKOUT PATTERN!

Ending expanding diagonal scenarioJust a possible scenario. If I'm right, wave 3 ends here, and wave 4 correction should start very soon.
Thursday updateMarket sold off but the after hours bounced hard. Many of the markets need to make a decision tomorrow. Bias is still up on the SPX. Vix still above support. Gold looking bear flag like. BTC bounced to 110k to test resistance there. Oil still above the 18ma and consolidating still.

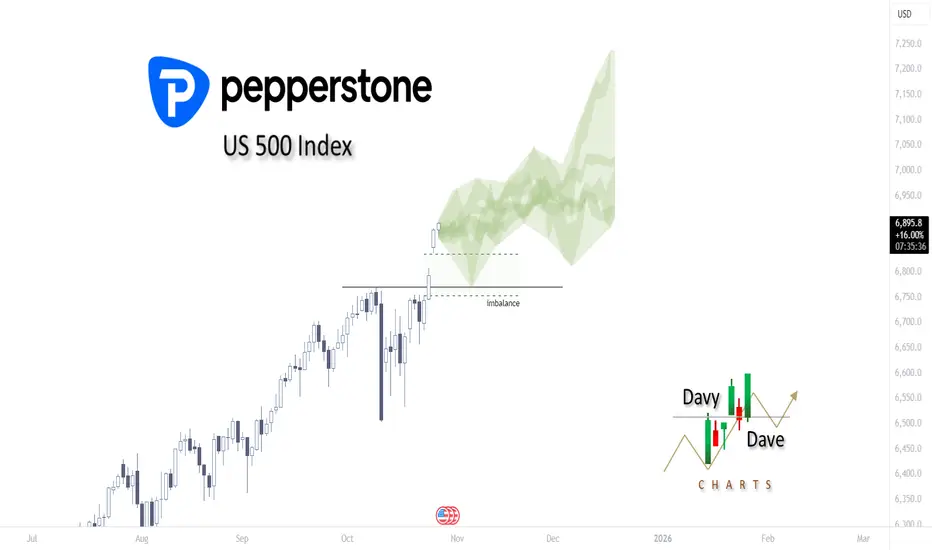
What does history say about the rest of this year?Taking a look at the US 500 Index and plotting the Late October to mid-December highs and lows on post-election year performances, the next two months are looking very bullish. PEPPERSTONE:US500 AMEX:SPY SP:SPX AMEX:VOO