S&P 500 Reaches Resistance in Both 1H and 1W TimeframesThe S&P 500 has made nearly a 40 percent run from the April dip despite rising stagflation risks. Traders have chosen to focus on earnings and AI optimism, and that is likely to continue.
However, the market has now reached a point where the upper lines of both the 1H and 1W trend channels are being tested, which should not be ignored. There is no reason to dismiss the strength of this magnificent bull market, but a bit of caution may be wise for those fully loaded with stocks or long the index via CFDs.
In the short term, there is a risk of a correction toward 6,500.
SP500 trade ideas


SPX500USD could go up againHi traders,
Last week I said we could see a little more upside and a bigger correction down for (orange) wave 4 for SPX500USD. And this is exactly what happened.
So next week we could see more upside again to make a new ATH.
Let's see what the market does and react.
Trade idea: Wait for a small pullback down and a change in orderflow to bullish on a lower timeframe to trade longs.
If you want to learn more about trading FVG's & liquidity sweeps with Elliott wavecount and patterns, then please make sure to follow me.
This shared post is only my point of view on what could be the next move in this pair based on my technical analysis.
Don't be emotional, just trade your plan!
Eduwave

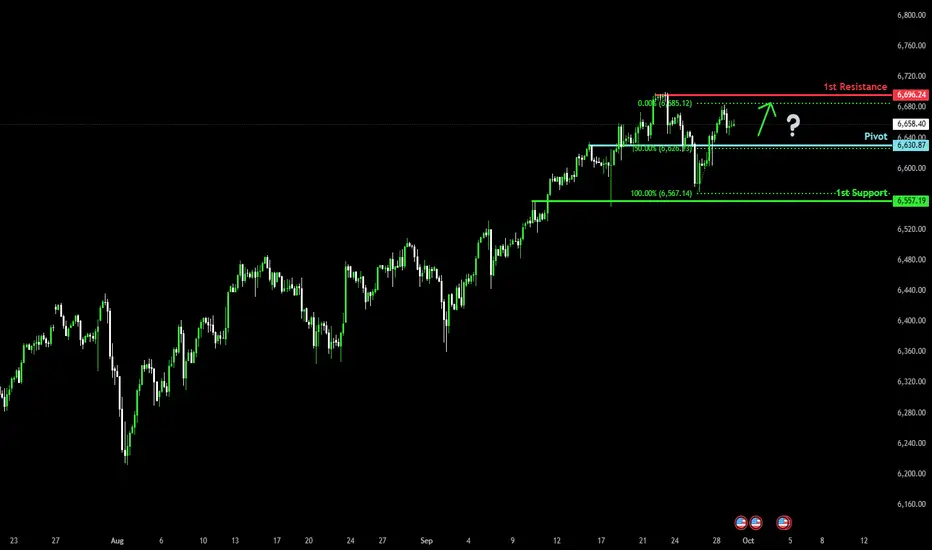
Falling towards 50% Fibonacci support?S&P500 (US500) is falling towards the pivot, which acts as an overlap support that aligns with t e 50% Fibonacci retracement and could bounce to the 1st resistance which has been identified as a swing high resistance.
Pivot: 6,630.87
1st Support: 6,557.19
1st Resistance: 6,696.24
Disclaimer:
The above opinions given constitute general market commentary, and do not constitute the opinion or advice of IC Markets or any form of personal or investment advice.
Any opinions, news, research, analyses, prices, other information, or links to third-party sites contained on this website are provided on an "as-is" basis, are intended only to be informative, is not an advice nor a recommendation, nor research, or a record of our trading prices, or an offer of, or solicitation for a transaction in any financial instrument and thus should not be treated as such. The information provided does not involve any specific investment objectives, financial situation and needs of any specific person who may receive it. Please be aware, that past performance is not a reliable indicator of future performance and/or results. Past Performance or Forward-looking scenarios based upon the reasonable beliefs of the third-party provider are not a guarantee of future performance. Actual results may differ materially from those anticipated in forward-looking or past performance statements. IC Markets makes no representation or warranty and assumes no liability as to the accuracy or completeness of the information provided, nor any loss arising from any investment based on a recommendation, forecast or any information supplied by any third-party.
Financial crisis like no other coming to the SPX V SOON!Guys, it is what it says in the title.
I don't know what will cause it.
But, some how it'll happen.
Max upside potential to 6,860$, which is nothing in comparison to max downside potential of 3,958$.
What do you think will happen to other traditional assets such as property etc ?
I am not here spreading FUD, I am just stating what I see, and very much so I am near always right in the long run.

SPX defying gravity!It's a BULL market until it's not! Some how some way the markets will set new ATHs? I don't know how or why every macro economic indicator is yelling recession or worse but the chart tells me a different story. Bulls ball.....

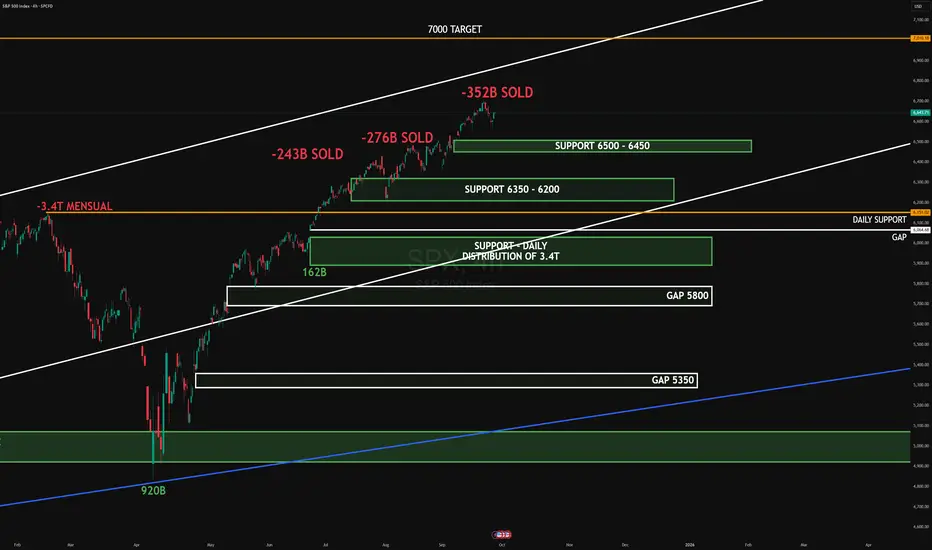
SPX SEP-OCT 2025SPX rejected at the 6600 area after heavy institutional distribution (-352B). Price is consolidating above key support zones at 6500–6450 and 6350–6200. Stronger demand sits at 6100, where the 3.4T daily absorption was previously noted. Below that, unfilled gaps remain at 5800 and 5350.
Upside target: 7000 if supports hold and momentum returns.
Downside target: 5800 gap fill if 6350 breaks.
#SPX #globaltrade #investment #investing #stockmarket #wealth #realestate #markets #economy #finance #money #forex #trading #price #business #currency #blockchain #crypto #cryptocurrency #airdrop #btc #ethereum #ico #altcoin #cryptonews #Bitcoin #ipo
FOMC 100% Breakout (Check) - Key Resistance and 6500 Gamma PinFOMC was in fact a NOISE candle
So I measured the candle, projected a 100% breakout bullish and bearish
Bulls took the bait and ran higher, but still resistance @ 6700 seen today and hopefully
a short-term window to see a bit of a slide lower into some technical levels
EMA support levels
-watching the 21 period daily EMA
-watching the 50 period daily EMA
6550 FOMC candle lows from last week
6500 Gamma Pin with JP Morgan's quarterly collar trade
This is the first day in several weeks where I've seen some actual follow through
in negative gamma option flows
If futures grinds prices lower, the cascade may take hold and we can see a 100-200 point
selloff quickly in the S&P
I still like scooping up premium and buying the dips, but hopefully at more attractive levels
like 4-5% lower or even 8-10% lower
Let's see how it plays out. I'll be in the markets grinding per usual.
Thanks for watching!!!

S&P 500 – Steady Uptrend Within Rising ChannelThe S&P 500 continues to grind higher within a well-defined rising channel, holding above both the 50-day SMA (6,486) and the 200-day SMA (6,023), which reinforces the broader bullish structure. Price action has respected the channel boundaries since May, with the recent bounce off the mid-line suggesting buyers remain in control.
Momentum indicators support the bullish bias:
MACD is positive, showing steady upside momentum.
RSI sits near 68, not yet overbought but approaching elevated levels, hinting at a possible test of the channel’s upper boundary.
As long as price holds above the 6,600 zone, the path of least resistance remains higher, with the channel top near 6,800 as the next potential target. A break below the channel support, however, could trigger a corrective pullback toward the 6,450–6,500 area, aligning with the 50-day SMA.
Overall, the trend remains bullish, with dips likely to be treated as buying opportunities while the channel structure holds. -MW

Quarterly Holdings Report:Quarterly Holdings Report:
Ripple/XRP
Dogecoin/DOGE
Ryujin/RYU
Amaterasu Omikami
Floki Inu
Brett (Based)
Injective/INJ
Render/RNDR
BITI:US
AAPL:US
NVDA:US
WEC:US
TJX:US
VGT:US
HD:US
GLD:US
LOW:US

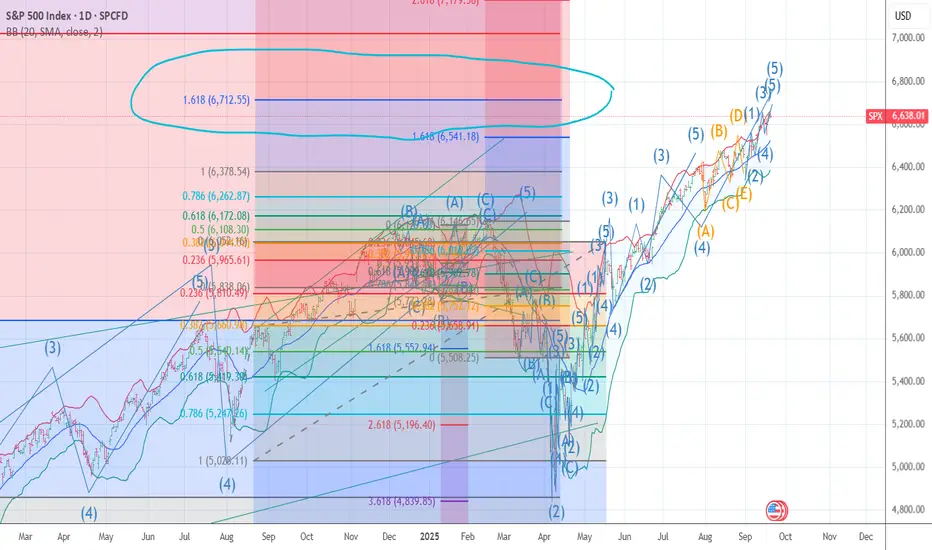
My top wave count alt 6681/6712I have moved back into puts for 2027 rather deep in the money As we are now up almost 24 to 26 weeks in this rally .The PUT to call ratio is now into level I see as mind blowing on 5 10 and now 20 day . and also have three bearish Divergences from Rsi to two of my private models .I have a major turn once again based on the Spirals 2/19 top and 4/7 low they are due near the end of next week . I am now 95 % in Puts and will move to 115% next week based on the dates or is the sp cash can rally to 6709 next week Best of trades WAVETIMER
Still going up for SPX500USDHi traders,
I show you week after week what price will do. If you follow my outlooks, you've made a lot of profit.
For example SPX500USD played out exactly as predicted in my previous outlook. After a sharp correction it continued the upmove and made a new ATH.
Now next week we could see a little more upside and a bigger correction down for (orange) wave 4.
Let's see what the market does and react.
Trade idea: Wait for a small pullback and a change in orderflow to bullish on a lower timeframe to trade longs.
If you want to learn more about trading FVG's & liquidity sweeps with Elliott wavecount and patterns, then please make sure to follow me.
This shared post is only my point of view on what could be the next move in this pair based on my technical analysis.
Don't be emotional, just trade your plan!
Eduwave

S&P 500: Pullback after flash dump is a Short opportunity
📝 1. Market Context
BLUEBERRY:SP500 recently witnessed a sharp drop from 6,698 down to 6,645, showing clear bearish momentum. After this fall, the index attempted a recovery, but the bounce was weak: green candles became smaller and stalled right at key resistance zones. A long red bearish engulfing candle then erased the entire recovery, proving sellers are back in control.
🟥 2. Static Resistance (Red Zone on Chart)
On the chart, the red zone represents static resistance, located around 6,671 – 6,664.62. This area aligns with:
• Dynamic resistance (moving averages).
• Static resistance (previous supply zone).
Every time price has tested this area, it faced rejection. This makes the red zone a high-probability level for sellers to step in again if price retests it.
🟩 3. Support Zone (Green Zone on Chart)
The nearest support lies at 6,639, highlighted as the green zone on the chart. This is the first logical downside target, where price might pause or react before choosing the next move.
🎯 4. Bearish Scenario
• Bias: Bearish continuation.
• Entry zone: 6,671 – 6,664.62 (red resistance zone).
• Target: 6,639 (blue support zone).
• Invalidation: If price closes firmly above 6,672, this bearish idea is no longer valid.
✅ 5. Summary
After a sharp decline, the weak bounce into resistance looks like an opportunity for sellers. As long as the index remains below the red resistance zone, the path of least resistance points lower, with 6,639 as the next key support to watch.
📈 Similar to the previous Buy setup, we can see that price is reacting in a similar manner — it touches the static support zone (marked in green) and the moving average (acting as dynamic resistance), before making a strong bounce.
Please like and comment below to support our traders. Your reactions will motivate us to do more analysis in the future 🙏✨

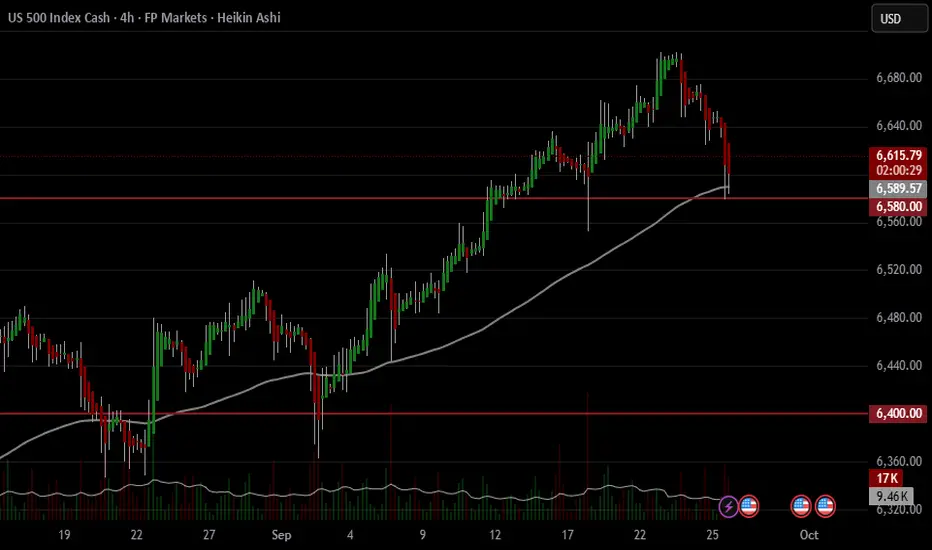
US500 Rally end?The S&P 500 is at a key moment right now, testing the 6580 support area after a sharp pullback from recent highs.
In my view, if this level breaks decisively with strong selling pressure, the market could head toward the 6400 zone, which has acted as an important support area in the past.
As long as 6580 holds, a bounce is still possible, but for now the risk seems tilted to the downside if we see a clear breakdown.
NOT FINANCIAL ADVICE.
Comment below with the ticker you’d like me to analyze next!
And don’t forget to leave a boost if you’d like to see more trading ideas like this :)
Despite AI valuation pressures, US500 outlook remains positive.
Robust US data tempered Fed rate-cut bets, dragging equities lower for a third day, though investors expect the pullback to be short-lived. Nvidia’s (NVDA) 100 bln USD investment in OpenAI has raised questions over vendor financing risks, deepening worries over elevated valuations. Still, institutions expect US equities to hold a tactical bullish stance. JPMorgan (JPM) projected that while a government shutdown and fragile sentiment may trigger midweek weakness, solid economic growth, a resilient labor market, and AI momentum could drive the S&P; 500 to 7,000 by year-end.
US500 remains within the ascending channel, sustaining its steady uptrend. After briefly testing EMA21 and the channel’s lower bound, the index rebounded, indicating the potential extension of a bullish structure. If US500 continues to hold within the channel, the index may gain upward momentum toward the resistance at 6700. Conversely, if US500 breaks below the channel’s lower bound and EMA21, the index could retreat toward the support at 6530.

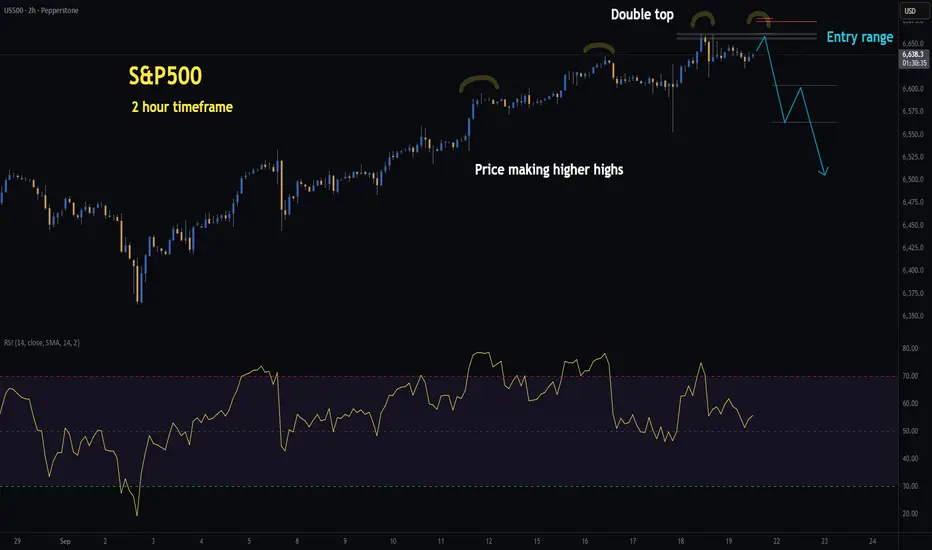
US500 | H2 Double Top | GTradingMethodHello Traders, I hope you’ve all had a profitable week!
🧐 Market overview:
The US500 has pushed into new highs since the FOMC and remains in an uptrend. However, price is advancing on weakening momentum — higher highs in price while RSI prints lower highs, a classic case of negative divergence. My system is flagging this as a potential double top setup on the 2H timeframe, but I am still waiting for confirmation before entering a short.
Interestingly, while my system highlights bearish risk, there are also bullish signals worth noting:
- Daily CMF money flow shows no negative divergence.
- Daily MACD remains on a buy signal.
- The recent rate cut adds further liquidity and stimulus to markets.
📊 My trade plan:
Risk/Reward: 3.6 – 4.5
Entry: 6,655.6 – 6,661.8
Stop Loss: 6,674.8 – 6,678.6
Take Profit 1 (50%): 6,604
Take Profit 2 (50%): 6,563
The entry and stop ranges vary depending on where the setup confirms within the zone.
Tip:
Divergences often act as early warning signs of trend exhaustion, but they work best when combined with pattern confirmation (like a double top) rather than traded in isolation.
🙏 Thanks for checking out my post!
Make sure to follow me to catch the next idea and keen to hear if you are trading the US500? :)
Please note: This is not financial advice. This content is to track my trading journey and for educational purposes only.
Will the U.S. Supreme Court strike down tariffs?In November 2025, the U.S. Supreme Court could issue a historic ruling: determining whether President Trump alone has the right to impose tariffs without going through Congress. Behind this legal debate lies a major issue for U.S. trade policy and the balance of powers.
The role of the Supreme Court
As the highest judicial authority in the country, the Supreme Court has the power to uphold or strike down any measure that does not comply with the Constitution. Its decisions are final and binding on all institutions. In this case, the Court must assess whether the President overstepped his authority by using the International Emergency Economic Powers Act (IEEPA) to impose tariffs.
Thanks to the principle of judicial review, the Court must verify whether the executive branch respects the separation of powers. For decades, presidents have invoked the IEEPA to act quickly, especially in times of economic tension. This practice, tolerated until now, is now being challenged.
A decisive choice – two possible outcomes:
• If the Court confirms presidential power, the White House will retain broad freedom to impose tariffs without immediate checks.
• If the Court limits or cancels this power, Congress will once again become the central actor in trade policy, slowing decisions but restoring institutional balance.
The issue goes beyond the legal framework. A confirmation would strengthen the executive and could encourage a more aggressive approach in international negotiations. Conversely, a restriction would force a return to legislative compromise, complicating the implementation of economic sanctions but providing greater predictability to trading partners.
A possible turning point for Fed monetary policy
This ruling could redefine U.S. trade policy for years to come. It will influence how Washington manages trade disputes, conducts international negotiations, and balances power between the President and Congress. It will also strongly impact the Fed’s future monetary policy trajectory and, more broadly, financial markets.
DISCLAIMER:
This content is intended for individuals who are familiar with financial markets and instruments and is for information purposes only. The presented idea (including market commentary, market data and observations) is not a work product of any research department of Swissquote or its affiliates. This material is intended to highlight market action and does not constitute investment, legal or tax advice. If you are a retail investor or lack experience in trading complex financial products, it is advisable to seek professional advice from licensed advisor before making any financial decisions.
This content is not intended to manipulate the market or encourage any specific financial behavior.
Swissquote makes no representation or warranty as to the quality, completeness, accuracy, comprehensiveness or non-infringement of such content. The views expressed are those of the consultant and are provided for educational purposes only. Any information provided relating to a product or market should not be construed as recommending an investment strategy or transaction. Past performance is not a guarantee of future results.
Swissquote and its employees and representatives shall in no event be held liable for any damages or losses arising directly or indirectly from decisions made on the basis of this content.
The use of any third-party brands or trademarks is for information only and does not imply endorsement by Swissquote, or that the trademark owner has authorised Swissquote to promote its products or services.
Swissquote is the marketing brand for the activities of Swissquote Bank Ltd (Switzerland) regulated by FINMA, Swissquote Capital Markets Limited regulated by CySEC (Cyprus), Swissquote Bank Europe SA (Luxembourg) regulated by the CSSF, Swissquote Ltd (UK) regulated by the FCA, Swissquote Financial Services (Malta) Ltd regulated by the Malta Financial Services Authority, Swissquote MEA Ltd. (UAE) regulated by the Dubai Financial Services Authority, Swissquote Pte Ltd (Singapore) regulated by the Monetary Authority of Singapore, Swissquote Asia Limited (Hong Kong) licensed by the Hong Kong Securities and Futures Commission (SFC) and Swissquote South Africa (Pty) Ltd supervised by the FSCA.
Products and services of Swissquote are only intended for those permitted to receive them under local law.
All investments carry a degree of risk. The risk of loss in trading or holding financial instruments can be substantial. The value of financial instruments, including but not limited to stocks, bonds, cryptocurrencies, and other assets, can fluctuate both upwards and downwards. There is a significant risk of financial loss when buying, selling, holding, staking, or investing in these instruments. SQBE makes no recommendations regarding any specific investment, transaction, or the use of any particular investment strategy.
CFDs are complex instruments and come with a high risk of losing money rapidly due to leverage. The vast majority of retail client accounts suffer capital losses when trading in CFDs. You should consider whether you understand how CFDs work and whether you can afford to take the high risk of losing your money.
Digital Assets are unregulated in most countries and consumer protection rules may not apply. As highly volatile speculative investments, Digital Assets are not suitable for investors without a high-risk tolerance. Make sure you understand each Digital Asset before you trade.
Cryptocurrencies are not considered legal tender in some jurisdictions and are subject to regulatory uncertainties.
The use of Internet-based systems can involve high risks, including, but not limited to, fraud, cyber-attacks, network and communication failures, as well as identity theft and phishing attacks related to crypto-assets.

SPX500 H1 | Bearish Momentum BuildingS&P500 is rising towards the sell entry at 6,647.13, which is an overlap resistance and could drop from this level to the take profit.
Stop loss is at 6,681.57, which is a multi-swing high resistance.
Take profit is at 6,614.24, which is a pullback support that aligns with the 61.8% Fibonacci retracement.
High Risk Investment Warning
Trading Forex/CFDs on margin carries a high level of risk and may not be suitable for all investors. Leverage can work against you.
Stratos Markets Limited (tradu.com ):
CFDs are complex instruments and come with a high risk of losing money rapidly due to leverage. 65% of retail investor accounts lose money when trading CFDs with this provider. You should consider whether you understand how CFDs work and whether you can afford to take the high risk of losing your money.
Stratos Europe Ltd (tradu.com ):
CFDs are complex instruments and come with a high risk of losing money rapidly due to leverage. 66% of retail investor accounts lose money when trading CFDs with this provider. You should consider whether you understand how CFDs work and whether you can afford to take the high risk of losing your money.
Stratos Global LLC (tradu.com ):
Losses can exceed deposits.
Please be advised that the information presented on TradingView is provided to Tradu (‘Company’, ‘we’) by a third-party provider (‘TFA Global Pte Ltd’). Please be reminded that you are solely responsible for the trading decisions on your account. There is a very high degree of risk involved in trading. Any information and/or content is intended entirely for research, educational and informational purposes only and does not constitute investment or consultation advice or investment strategy. The information is not tailored to the investment needs of any specific person and therefore does not involve a consideration of any of the investment objectives, financial situation or needs of any viewer that may receive it. Kindly also note that past performance is not a reliable indicator of future results. Actual results may differ materially from those anticipated in forward-looking or past performance statements. We assume no liability as to the accuracy or completeness of any of the information and/or content provided herein and the Company cannot be held responsible for any omission, mistake nor for any loss or damage including without limitation to any loss of profit which may arise from reliance on any information supplied by TFA Global Pte Ltd.
The speaker(s) is neither an employee, agent nor representative of Tradu and is therefore acting independently. The opinions given are their own, constitute general market commentary, and do not constitute the opinion or advice of Tradu or any form of personal or investment advice. Tradu neither endorses nor guarantees offerings of third-party speakers, nor is Tradu responsible for the content, veracity or opinions of third-party speakers, presenters or participants.

SPX500 – New Highs as Nvidia–OpenAI Deal Lifts Market SentimentSPX500 – Overview
U.S. indices hit new highs as markets digested fresh headlines, including Nvidia’s (NVDA) plan to invest up to $100 billion in OpenAI, with the first data-center gear expected to ship in the second half of 2026.
Analysts are split on the deal: bulls view it as confirmation that OpenAI sees no alternative to Nvidia GPUs, while skeptics question why Nvidia would fund a customer to buy its own equipment.
Attention also turns to the September flash PMIs, which will test U.S. economic resilience amid tariffs. Australian PMIs disappointed, but they carry little correlation to U.S. growth.
Technical Analysis
SPX500 has reached the key 6,700 resistance and is stabilizing above it, signaling continuation of the bullish trend while price trades above this pivot.
Bullish Path:
As long as price holds above 6,700, upside targets remain 6,722 → 6,742 → 6,780.
A strong 1H close above 6,742 would confirm further bullish extension.
Bearish Path:
A confirmed 1H close below 6,698 would signal a short-term correction toward 6,670.
For a deeper bearish shift, price must break the 6,663 pivot on a 1H close, opening the way to 6,634.
Key Levels
Pivot: 6,700
Resistance: 6,722 – 6,742 – 6,780
Support: 6,672 – 6,663 – 6,634

S&P500 pushing to a new ATH?The S&P 500 (+0.34%) pushed to another record high as Q4 began, showing resilience despite ongoing US government shutdown risks and a weaker ADP private payrolls report, which signaled contraction. Markets leaned on expectations of faster Fed rate cuts, with Treasury yields falling sharply as investors reassessed labor market strength.
Sector drivers:
Gold and defensive plays gained as shutdown uncertainty supported safe-haven demand.
Tech outperformed: OpenAI’s $500bn valuation lifted AI-linked sentiment, with gains spilling into suppliers like Samsung and SK Hynix.
Cybersecurity risk weighed on software names after hackers claimed a breach of Oracle’s E-Business Suite, demanding ransom payments.
Apple slipped on reports it is halting Vision Pro updates to prioritize AI glasses.
Market tone: Optimism around rate cuts and AI-driven growth continues to underpin the S&P 500, but shutdown risks and labor market fragility remain key watchpoints for near-term volatility.
Key Support and Resistance Levels
Resistance Level 1: 6750
Resistance Level 2: 6770
Resistance Level 3: 6800
Support Level 1: 6680
Support Level 2: 6660
Support Level 3: 6640
This communication is for informational purposes only and should not be viewed as any form of recommendation as to a particular course of action or as investment advice. It is not intended as an offer or solicitation for the purchase or sale of any financial instrument or as an official confirmation of any transaction. Opinions, estimates and assumptions expressed herein are made as of the date of this communication and are subject to change without notice. This communication has been prepared based upon information, including market prices, data and other information, believed to be reliable; however, Trade Nation does not warrant its completeness or accuracy. All market prices and market data contained in or attached to this communication are indicative and subject to change without notice.

US500 Post PCE OutlookThe short term outlook for the US 500 remains constructively bullish, with a bias towards further upside. The primary factor supporting this view is the recent in line Core PCE data 2.9% YoY, which matched expectations. This result has successfully alleviated fears of a more aggressive US Fed tightening path. The market interprets this steady inflation reading as giving the Fed "room to be patient" with future rate adjustments, thereby sustaining appetite for equities which are seen as risk assets. While the path forward may be choppy with volatility contained around current levels the overall momentum is positive and measured. Critical upcoming catalysts that could drive the next major move include future inflation prints, jobs data, and the start of the Q3 earnings season.
Fundamental Analysis
The market's resilience is built upon several key fundamental pillars:
Inflation Stability: The August Core PCE Index meeting expectations is the most significant fundamental driver, reducing the immediate risk of a growth stifling, aggressive Fed policy shift.
Corporate Strength: Underlying support continues to come from robust corporate earnings and sustained strong consumer spending. These elements suggest that the corporate sector can maintain profit growth even in the current economic environment.
Fed Clarity: Clear communication from the Fed regarding its path has reduced policy uncertainty, which generally supports higher equity valuations.
Sector Dynamics: There is evidence of defensive flows and sector rotation, indicating that investors are positioning for sustained but selective growth within the US economy, favoring both large caps and defensives in a measured approach.
Technical Analysis
The technical picture supports a consolidation phase near record highs, with momentum favoring a potential future breakout:
Resistance: The first resistance zone is identified between 6,675 and 6,700. A decisive, sustained break above this level would signal the next major rally attempt.
Support: Immediate support lies in the 6,605 - 6,570 zone. Maintaining price action above this band is crucial for keeping the constructive, short-term bullish trend intact.
Volatility: Volatility remains contained, reflecting the market's stability and lack of panic following the inflation data. Monitor technical indicators for overbought signals that might precede a pause or consolidation, but the sentiment remains constructive as long as key macroeconomic data remains steady.
Analysis by Terence Hove, Senior Financial Market Strategist at Exness

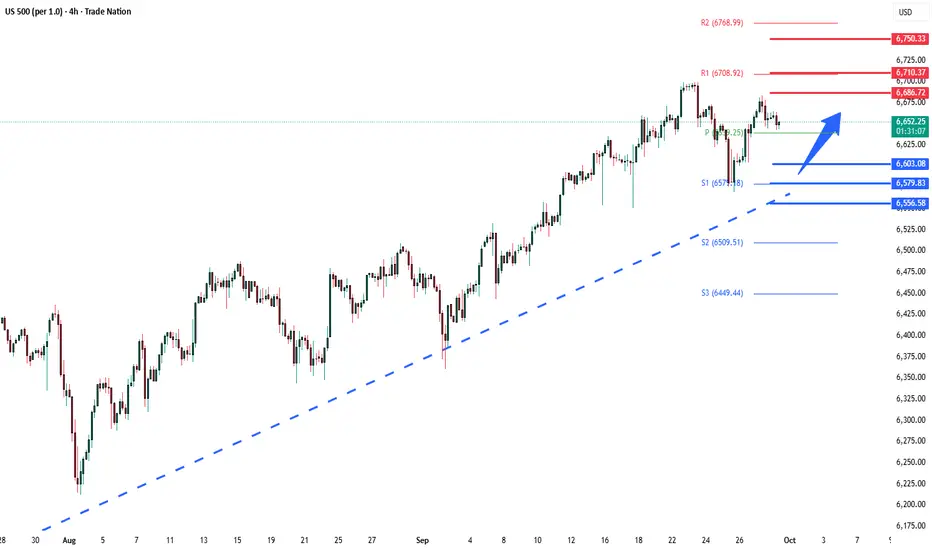
S&P500 uptrend continuation?Key Drivers for S&P 500
Government shutdown risk: With no deal in sight and a 79% market-implied probability of a shutdown tomorrow, headline risk is elevated. Historically, most shutdowns have been short, but lingering political uncertainty could weigh on sentiment.
Rates & bonds: A global bond rally (10yr USTs -3.6bps) supported equities, particularly rate-sensitive and cyclical sectors. Lower yields are helping housing-linked names, as shown by the strong pending home sales data.
Commodities: Oil’s sharp decline (-3.45%, biggest drop since June) reduced inflation concerns and eased pressure on equities.
Sector performance: Gains were broad-based; cyclical sectors and construction materials led, while tech (NASDAQ +0.48%, Mag 7 +0.37%) outperformed. Equal-weighted S&P also rose (+0.32%), confirming breadth.
Safe haven demand: Gold’s rally highlights investor caution despite equity gains—suggesting hedging activity alongside risk-on moves.
S&P 500 Trading Takeaway
Equities remain resilient, closing near record highs with support from falling yields and softer oil prices. However, government shutdown risks and political uncertainty could cap upside near term. Expect headline-driven volatility with cyclical and tech sectors best positioned to extend gains if yields stay contained.
Key Support and Resistance Levels
Resistance Level 1: 6686
Resistance Level 2: 6710
Resistance Level 3: 6750
Support Level 1: 6600
Support Level 2: 6580
Support Level 3: 6556
This communication is for informational purposes only and should not be viewed as any form of recommendation as to a particular course of action or as investment advice. It is not intended as an offer or solicitation for the purchase or sale of any financial instrument or as an official confirmation of any transaction. Opinions, estimates and assumptions expressed herein are made as of the date of this communication and are subject to change without notice. This communication has been prepared based upon information, including market prices, data and other information, believed to be reliable; however, Trade Nation does not warrant its completeness or accuracy. All market prices and market data contained in or attached to this communication are indicative and subject to change without notice.
Crash ... 10 % and up 6760 is very important Pivot that price can`t pass for many reasons :
its 720 GANN angle since the uptrend begins in apr 2025 @ 4840
and it comes with upper trend that contain the price and face it down evey time it touch
Now . its matter of time before the movie start
This is how the big whales punish you when you trade in the markets
Gold at a record high
The dollar is also rising
Bonds are rising
Political tensions are increasing
Inflation is rising
Unemployment is increasing
Government shutdown
High tariffs
Yet the market hits a new record every other day by day
Patience is a virtue
Wait for a 10-15% crash before the end of the year
After they wipe out the sellers, as they always do
have a sit , have a kit kat
