US500 Outlook Post US PCE Data
Fundamental Analysis
US500 experienced a pullback from record highs after the release of the PCE inflation data as traders absorbed persistent inflation pressures and reassessed the timing of US Fed rate cuts. The sentiment has shifted to cautious optimism with a moderate risk-off tone as traders took profits after a strong August rally and rotated out of high growth tech stocks. The PCE data matched market forecasts, maintaining expectations for a Sep Fed rate cut but offering no new bullish momentum for equities. Traders are now watching upcoming labor data and CPI releases for added confirmation before recommitting to aggressive upside positions.
Technical Analysis
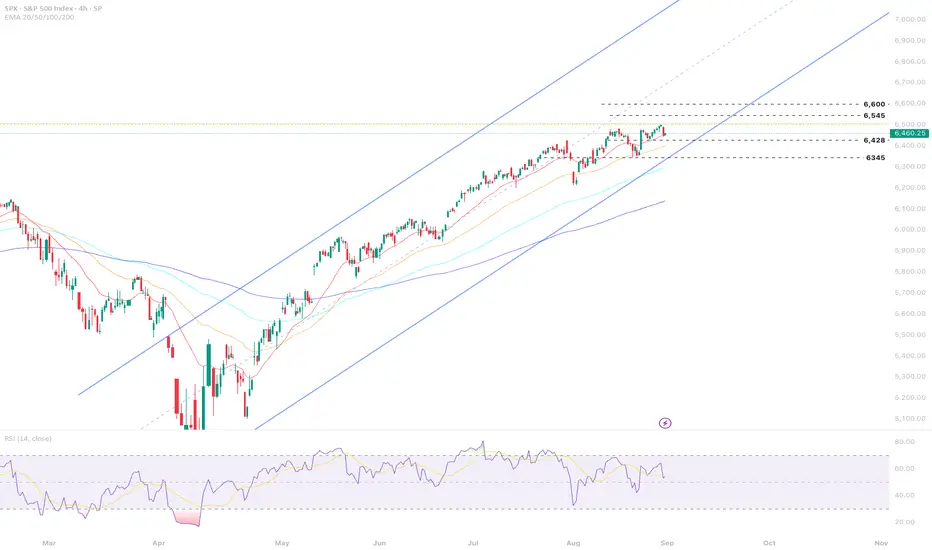
The US500 is in correction after reaching new highs, with the market positioned for possible sideways action until significant new economic headlines emerge. Traders are awaiting fresh macro catalysts and digesting possible elevated rates and inflation. Odds for a September cut remain high but sticky inflation means the Fed may stay cautious. Next week’s jobs and wage data are key for market direction. Weakness in technology stocks could continue to drag on the index if earnings and regulatory headwinds persist..
Key Technical Levels
Support 6,428 Protects against near-term declines
Resistance 6,545 Bulls need to reclaim for new record highs
Downside Target 6,380
Analysis by Terence Hove, Senior Financial Markets Strategist at Exness
SPCUSD trade ideas
Quick Recap - SPX Day TradeSharing some insight to help with getting you to better understand the moves i'm doing.

SPX500 & NAS100 AT RESISTANCE CROSSROADS, GOLD GAINING STEAMIn this weekend's analysis on the SPX500 and NAS100 indices, I see a potential bullish trend continuation but also at a key resistance level with hidden bears ready to attach bulls. This is one of the setups that patience is more rewarding than taking a bet.
Gold is gaining strength to the upper range and still in the sideways channel. Here too patience for a clear breakout will be more rewarding. I think based on the length of the sideways, once there is a clear breakout, Gold will really rally to it's next targets. Please watch the entire video to understand my analysis and thoughts. Cheers and have a great trading week.

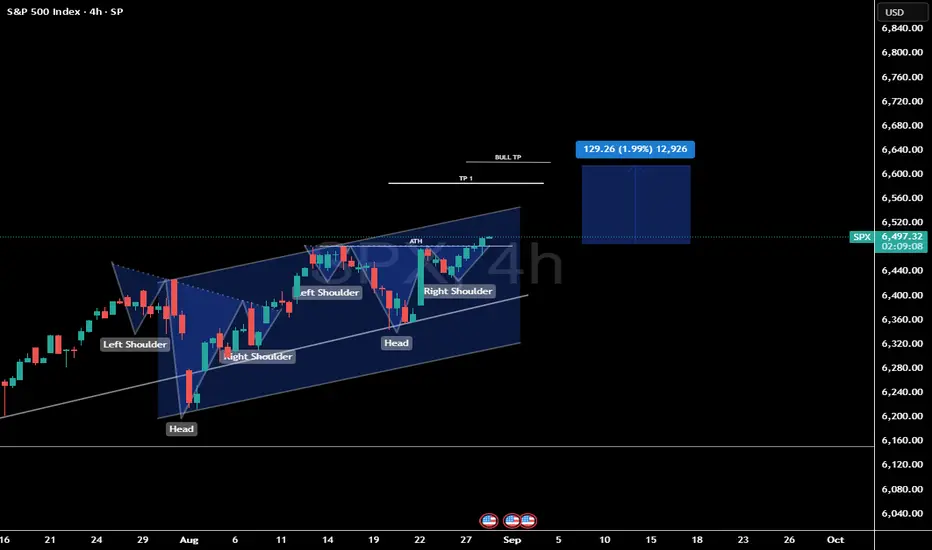
SPX shortSame like 2000 the concentration in AI related companies is 5 times as of russell 2000 combined companies.
Technical - Divergence in breadth and momentum
Fundamental - Expecting 3 rate cuts this year, when not delivered will start panic selling.
Chart pattern - Weekly doji

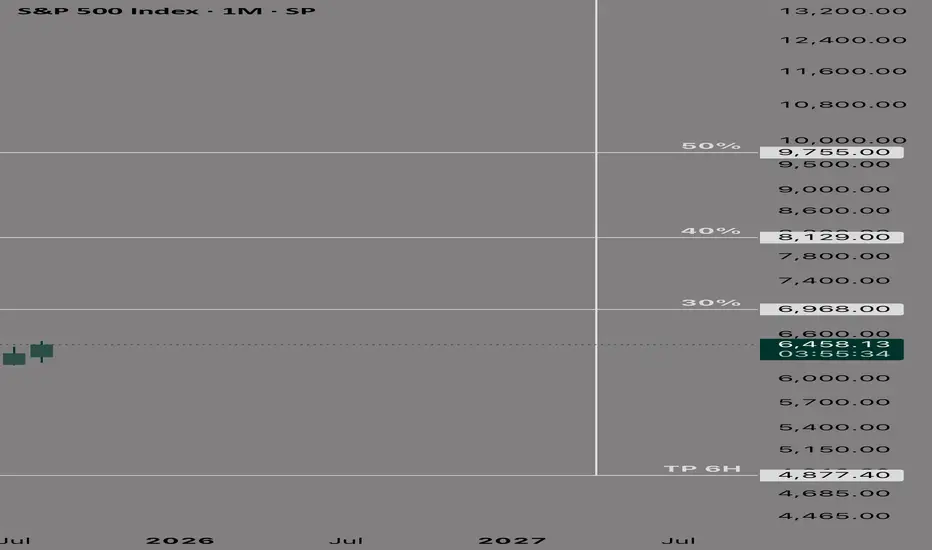
SPX - long term sell cycle SPX
Long Term Sell Cycle
TP at 4877
Term April 2027
% Bubble Ratio
Currently in a positive bubble with fair value at 4877
Bubble ratio levels (%) and duration capacity window are obtained.
Investment plan:
No entry in positive bubbles
DivergenceLike I have said in the previous idea, this divergence looks very similar to the divergence we saw in June. It can be broken on some extremely positive news, but now some correction will likely take place. The previous one ended with a tiny undercut of previous low and a positive 4h (2h) divergence. Maybe this time we will see a small correction with 6420 low undercut or maybe it will go lower (who knows). I'm shorting it. Will increase the short position if it goes higher first and will get out if I see atleast 1h positive divergence.

S&P500 INDEX (US500): To The New HighsThe 📈US500 has recently established a new All-Time High, breaking above a critical daily resistance cluster.
This breached structure has now transformed into a potentially robust support level.
Consequently, the index is projected to sustain its upward trajectory, with a target of 6529 anticipated in the near term.

SP500 here we go again -SHORTi had waited for another opportunity to reopen my closed position- if the prcie over the next days doesnt go above 6500 (daily candle) I'm pretty happy holding to my short
don't copy- just an idea not advise! also- protect your capital hence s/l always recommended

Hellena | SPX500 (4H): LONG to resistance area of 6596 .Dear colleagues, I haven't made a forecast for the SNP500 in a long time and was waiting for a correction, but it seems that a major correction is not yet close, and at the moment the price continues to be in an upward five-wave movement.
Therefore, I believe that we should expect to reach the 6596 area, which will mark the end of the medium-term wave “3.”
The corrections are not very deep at the moment, but the price may reach the 6317 area before continuing its upward movement.
Manage your capital correctly and competently! Only enter trades based on reliable patterns!

S&P 500 - Triple Top Breakout (BUYS)Recent price action reveals clear bearish and bullish structure. My focus lays in these two levels marked on the chart. Price is trending up and broke the higher low structure. After failing to push down lower, it left a mark of a big wick before going up to reach new highs again. A triple top pattern was then formed at the prior higher high before finally pushing through with three white soldiers. That being said, there are multiple indications now for a continuation up, and also combined with price failing to go lower when it last had the attempt going down. So now after the three white soldiers, price is smoothing and slowing at the beginning of today, kinda looking like it's forming a little bullish pennant. Confluences are set and here is my idea to buy S&P 500.

8/28/2025 Trade review 8/28/2025 SPX trade review .. Nive push up at the open and then rejection down to fill previous day gap. Bounce at support and opening range breakout to make new ATHs

sp500 prepares for a retracement fibonacci speaks clearly, we are ready for a bearish leg, which could bounce into the clear support, and which coincides with fibonacci 38.2, to continue its run, up to the illustrated area, made with the fibonacci reversal.

Still resistance and divergenceThe price is hitting VWAP and trendline resistance again, daily RSI divergence holds. It can squeeze higher, but holding longs at this point is like playing with fire from my point of view.

SPX500 Bullish Breakout!
HI,Traders !
#SPX500 is trading in a
Strong uptrend and is made a bullish
Breakout of the key
Horizontal level of 6470.89
Which is now a support
And as the breakout is
Confirmed we will be
Expecting a further bullish !
Comment and subscribe to help us grow !

SPX500USD – Holding Above 6,490, Targeting 6,540The S&P 500 Index has cleared the 6,490 resistance level, confirming bullish strength. Price is now holding above this zone, with momentum building toward the next upside target at 6,540.
Support at: 6,490 / 6,440 🔽
Resistance at: 6,540 🔼
🔎 Bias:
🔼 Bullish: Sustained strength above 6,490 keeps 6,540 in focus.
🔽 Bearish: A break back below 6,490 and 6,440 would weaken momentum.
📛 Disclaimer: This is not financial advice. Trade at your own risk.

SPX is in a clear breakout trend! SP:SPX has triggered 2 larger bullish patterns.
Both patterns result in higher price.
Despite the weakness in NVDA the markets have shrugged off the decline.
We are trading into new all time highs so price discovery mode is in a effect.
When you have no resistance pivots or volume to trade against at new all time highs you really have to be careful if you're shorting the market.
Volume trends. extension moves, ATR, deviations should all be included in your analysis to define upside target zones.
We continue to remain net long the markets with key shorts in place.
SPX500 27.08.2025~+ Dovish Fed
*Trading into NVDA earnings, gave a wider SL to potentially withstand erratic swings + didn't touch NDX.

S&P500 Nvidia’s guidance has tempered risk appetiteNvidia’s earnings dampened sentiment overnight, with shares down -3% in after-hours trading after a strong Q2 sales beat was overshadowed by softer guidance and concerns over a potential US plan to tax China AI chip sales. The disappointment weighed on futures, with NASDAQ 100 down -0.29% vs. -0.12% for S&P 500.
That said, prior to the results, the S&P 500 (+0.24%) closed at another record high, supported by strength in energy (+1.15%) on firmer oil prices and tech (+0.48%). Small-caps also outperformed, with the Russell 2000 (+0.64%) at an 8-month high, now just 3% below its November 2021 peak.
Takeaway for S&P traders: Nvidia’s guidance has tempered risk appetite, but sector rotation into energy and small-caps continues to support breadth, helping the index hold record levels despite tech headwinds.
Key Support and Resistance Levels
Resistance Level 1: 6516
Resistance Level 2: 6542
Resistance Level 3: 6564
Support Level 1: 6416
Support Level 2: 6400
Support Level 3: 6381
This communication is for informational purposes only and should not be viewed as any form of recommendation as to a particular course of action or as investment advice. It is not intended as an offer or solicitation for the purchase or sale of any financial instrument or as an official confirmation of any transaction. Opinions, estimates and assumptions expressed herein are made as of the date of this communication and are subject to change without notice. This communication has been prepared based upon information, including market prices, data and other information, believed to be reliable; however, Trade Nation does not warrant its completeness or accuracy. All market prices and market data contained in or attached to this communication are indicative and subject to change without notice.

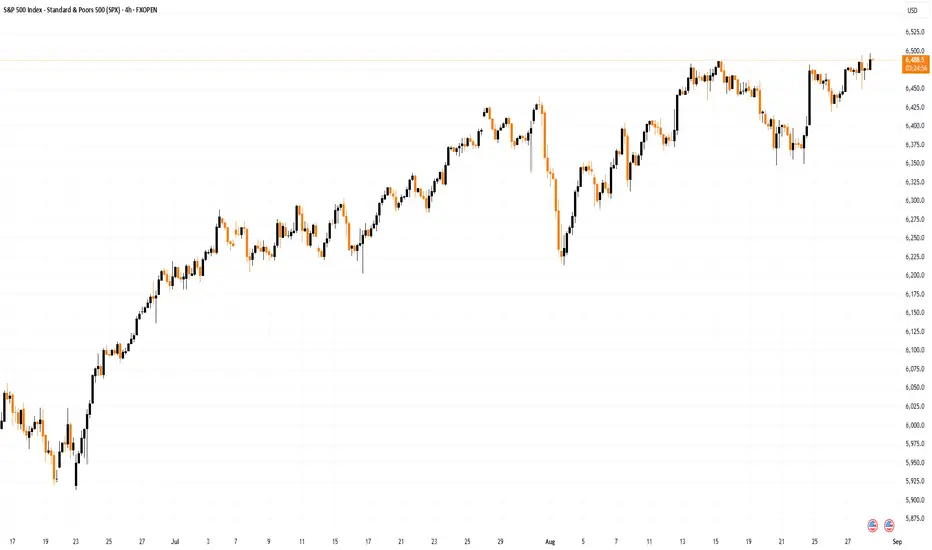
S&P 500 Index Reaches Another All-Time HighS&P 500 Index Reaches Another All-Time High
On 13 August, we wrote about the S&P 500 reaching an all-time high following the release of the CPI report. At that time, we suggested that the price might move towards the upper boundary of the ascending channel (highlighted in blue on the chart).
Since then:
→ the price has set a new record, forming peak 0 near the upper boundary of the channel;
→ it then fell back towards the lower boundary, where block A was formed;
→ and subsequently rose again to a fresh all-time high (F), coming close to the 6500 level.
The resilience of the blue channel underlines the prevailing bullish sentiment, which is supported by expectations of a Fed rate cut in September – an event seen as positive for the economy and potentially boosting corporate earnings. This optimism is so far outweighing the fact that Nvidia’s shares slipped slightly yesterday after the company’s earnings release (despite results exceeding investor expectations).
But is the outlook entirely cloudless?
S&P 500 Chart Technical Analysis
Looking at the 4-hour chart of the S&P 500, there are grounds to make slight adjustments to the slope and width of the ascending channel to better reflect the latest data.
At first glance, the picture appears bullish:
→ long lower shadows around block A point to strong buying interest;
→ downward pullbacks (B→C following impulse A→B, and D→E following impulse C→D) halted near the classic 50% Fibonacci retracement;
→ higher lows in late August give reason to consider the formation of a cup and handle pattern.
However, the bears also have their counterarguments:
→ the 6,500 level could act as psychological resistance (with the risk of a false bullish breakout);
→ the upper boundary of the channel may provide resistance;
→ the marked extremes resemble a bearish rising wedge pattern.
Progress in establishing new highs is becoming weaker each time – it seems that the S&P 500 bull market is running out of steam. This raises concerns about a correction – and with September’s long-standing reputation as the most unfavourable month for markets, a noticeable pullback could happen.
This article represents the opinion of the Companies operating under the FXOpen brand only. It is not to be construed as an offer, solicitation, or recommendation with respect to products and services provided by the Companies operating under the FXOpen brand, nor is it to be considered financial advice.
SPX500 Hits 6,495 Before Pullback, Key Pivot at 6,468SPX500 Futures – Overview
The S&P 500 continues to record new highs, peaking at 6,495 before pulling back for a correction.
Price action has since settled above 6,485 on the 4H candle — the previous high — and is now correcting back toward this level, preparing for a potential new upward move.
🔹 Technical Outlook
Holding above 6,485 will support bullish continuation toward 6,512 → 6,528 new ATH.
⚠️ A break below 6,485 and a confirmed 1H close under 6,468 (pivot) would signal a new decline toward 6,425 support.
Key Levels
Pivot: 6,468
Resistance: 6,512 – 6,528
Support: 6,485 – 6,468 – 6,438 – 6,425
✅ Summary:
SPX500 remains in a bullish structure after reaching new highs. Watch 6,485 as the key decision level — holding above favors continuation higher, while a drop below 6,468 could trigger a deeper correction.

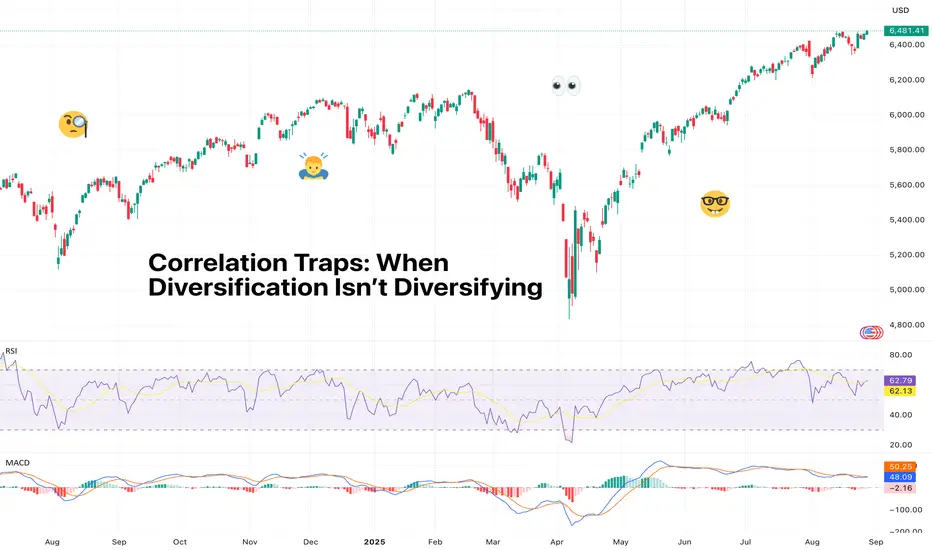
Correlation Traps: When Diversification Isn’t DiversifyingYou thought you were diversified. You had tech, energy, crypto, gold — a little bit of everything. Then a single headline nuked your entire portfolio in one day. Welcome to the sneaky world of correlation traps.
🧩 The Diversification Myth
Everyone loves to brag about their diversified portfolio. Some Tesla NASDAQ:TSLA here, Rocket Lab NASDAQ:RKLB there, maybe sprinkle in some Solana COINBASE:SOLUSD “for balance.”
But if your carefully curated mix of assets moves in the same direction every time Powell says “Good afternoon” at a Fed event… are you really diversified? Or are you just collecting different-shaped eggs in the same basket?
This is the correlation trap — the illusion of safety when your assets are secretly plotting against you. On paper, your portfolio says “hedged.” In practice, one bad CPI ECONOMICS:USCPI print, a tariff tweet, or an AI bubble hiccup can torch your entire P&L statement for the month.
And it works both ways. When Powell signals cuts, everything rallies: stocks, crypto, commodities, even meme ETFs. Suddenly, your “balanced” portfolio becomes a leveraged bet on a single narrative.
📉 Positive Correlation = Double Trouble
Correlation measures how two assets move relative to each other. Positive correlation means they tend to move together. That sounds fine on the upside — everyone’s a genius in bull markets. But when the markets get stressed, it doesn’t really matter if you’re holding traditional stocks or crypto assets.
Here's an example. March 2020. The S&P 500 SP:SPX cratered. Bitcoin BITSTAMP:BTCUSD lost more than half of its value in a week. Gold OANDA:XAUUSD dipped. Even safe-haven treasury ETFs had a panic moment. When markets really go risk-off, assets that are usually uncorrelated can suddenly drop in sync.
Why does this happen? Herd behavior, mostly. When traders, funds, and algos all unwind positions at once, correlations spike. In times of panic, cash is king.
🛡️ Negative Correlation = Your Actual Friend
True diversification comes from mixing assets with low or negative correlation. Historically, think equities vs. treasuries, or stocks vs. gold. When risk assets like stocks get wrecked, safe-haven assets like gold often move up to soften the blow.
But even these aren’t bulletproof anymore. Rising inflation, aggressive tariff broadside, and geopolitical headlines can disrupt traditional correlations. Traders relying on “old rules” learn quickly that markets evolve, and yesterday’s safe havens don’t always save you today.
Traders often assume “low correlation” equals “zero risk” or “perfect hedge.” Not really. Low correlation can vanish during high-volatility events — exactly when you need it the most.
Correlation creep is real — and unless you check, you could be risking more than you think.
🧠 Trading Psychology Meets Correlation
Correlation traps aren’t just technical — they can mess with your thinking. Traders often overestimate how diversified they are, which breeds overconfidence. You assume your downside is limited… until a risk event wipes you out across positions you thought were independent.
The result? Revenge trading . Over-sizing. Ignoring stop-losses. The correlation trap becomes a psychological spiral if you don’t plan your true exposure correctly.
🛠️ Avoiding the Trap: Practical Moves That Work
Run the numbers. You’ve built out a perfect portfolio? Check where your picks are coming from and where they fit using the TradingView Heatmaps and Screeners .
Diversify by driver, not ticker. If multiple assets react to the same narrative, you’re likely not truly diversified.
Add true hedges. Bonds, gold, cash, and volatility products can help — but only if you size them correctly.
Watch cross-asset flows. Use correlations between equities, commodities, FX, and crypto to spot when risk is clustering.
The key takeaway? Diversification isn’t about owning “a little of everything.” It’s about owning different risk exposures.
👉 Bottom Line
Diversification fails when you mistake quantity for quality. Five correlated trades don’t make you hedged; they make you levered without you knowing it.
Correlation traps creep up quietly, especially during euphoric rallies when every chart goes up together. But when sentiment flips — and it does flip — you find out real quickly what’s actually diversified and what isn’t.
Next time someone brags about holding “uncorrelated” assets, ask them one question: “Did they all move the same way on the last CPI print ?” If the answer’s yes, maybe it’s time to rethink what diversification really means.
Off to you : How do you balance your portfolio? Or maybe you’re not after diversification and instead you’re chasing concentration? Share your approach in the comments!
S&P500 INDEX (US500): To the New Highs?!
US500 is going to break a resistance based on a current all-time high.
A daily candle close above the underlined structure will provide a confirmation.
A bullish continuation will be expected at least to 6520 then.
❤️Please, support my work with like, thank you!❤️
I am part of Trade Nation's Influencer program and receive a monthly fee for using their TradingView charts in my analysis.

SEPTEMBER, the worst month for the S&P 500?What trend for the S&P 500 index this September 2025? A highly anticipated September as the fundamental back-to-school issues are crucial for the year-end trend.
September is the worst month for the S&P 500 index in terms of seasonality, and investors fear a drop in the US stock market this September while fundamental challenges are not lacking (the FED on Wednesday, September 17) and the S&P 500 is as expensive as it was at the end of 2021 in terms of valuation. Is this bearish consensus a trap?
On the topic of the S&P 500 valuation, I invite you to reread the analysis we published on July 30 by clicking on the image below.
1. Is September really the worst month in terms of performance for the S&P 500 index?
YES! Yes, September is indeed the worst month in the history of the S&P 500 index in terms of average performance. The average performance of September is negative, and no other month of the year shows a negative performance for the S&P 500.
However, be very cautious with this type of statistics, as it is only an average, and still, 47% of the September months in S&P 500 history have recorded a positive performance.
The data source below is indicated at the bottom right of the table.
2. The final performance of September 2025 will be dictated by fundamentals, in particular the Fed’s monetary policy decision on Wednesday, September 17.
The Fed has not lowered the federal funds rate since the end of 2024, and the US stock market now needs an accommodative monetary shift to preserve its long-term bullish trend. In one of my articles last week, I examined the 3 possible scenarios for the federal funds rate by the end of the year as well as the stock market impact for equities, bonds, the US dollar, and Bitcoin.
The table below summarizes the 3 possible cases and the potential market impact; you can access all details by clicking on it.
It is Powell’s Fed monetary choice on Wednesday, September 17 that will determine the final September performance for the S&P 500 index. The next two figures likely to influence the Fed’s decision are the PCE inflation on Friday, August 29 and the NFP report on Friday, September 5.
DISCLAIMER:
This content is intended for individuals who are familiar with financial markets and instruments and is for information purposes only. The presented idea (including market commentary, market data and observations) is not a work product of any research department of Swissquote or its affiliates. This material is intended to highlight market action and does not constitute investment, legal or tax advice. If you are a retail investor or lack experience in trading complex financial products, it is advisable to seek professional advice from licensed advisor before making any financial decisions.
This content is not intended to manipulate the market or encourage any specific financial behavior.
Swissquote makes no representation or warranty as to the quality, completeness, accuracy, comprehensiveness or non-infringement of such content. The views expressed are those of the consultant and are provided for educational purposes only. Any information provided relating to a product or market should not be construed as recommending an investment strategy or transaction. Past performance is not a guarantee of future results.
Swissquote and its employees and representatives shall in no event be held liable for any damages or losses arising directly or indirectly from decisions made on the basis of this content.
The use of any third-party brands or trademarks is for information only and does not imply endorsement by Swissquote, or that the trademark owner has authorised Swissquote to promote its products or services.
Swissquote is the marketing brand for the activities of Swissquote Bank Ltd (Switzerland) regulated by FINMA, Swissquote Capital Markets Limited regulated by CySEC (Cyprus), Swissquote Bank Europe SA (Luxembourg) regulated by the CSSF, Swissquote Ltd (UK) regulated by the FCA, Swissquote Financial Services (Malta) Ltd regulated by the Malta Financial Services Authority, Swissquote MEA Ltd. (UAE) regulated by the Dubai Financial Services Authority, Swissquote Pte Ltd (Singapore) regulated by the Monetary Authority of Singapore, Swissquote Asia Limited (Hong Kong) licensed by the Hong Kong Securities and Futures Commission (SFC) and Swissquote South Africa (Pty) Ltd supervised by the FSCA.
Products and services of Swissquote are only intended for those permitted to receive them under local law.
All investments carry a degree of risk. The risk of loss in trading or holding financial instruments can be substantial. The value of financial instruments, including but not limited to stocks, bonds, cryptocurrencies, and other assets, can fluctuate both upwards and downwards. There is a significant risk of financial loss when buying, selling, holding, staking, or investing in these instruments. SQBE makes no recommendations regarding any specific investment, transaction, or the use of any particular investment strategy.
CFDs are complex instruments and come with a high risk of losing money rapidly due to leverage. The vast majority of retail client accounts suffer capital losses when trading in CFDs. You should consider whether you understand how CFDs work and whether you can afford to take the high risk of losing your money.
Digital Assets are unregulated in most countries and consumer protection rules may not apply. As highly volatile speculative investments, Digital Assets are not suitable for investors without a high-risk tolerance. Make sure you understand each Digital Asset before you trade.
Cryptocurrencies are not considered legal tender in some jurisdictions and are subject to regulatory uncertainties.
The use of Internet-based systems can involve high risks, including, but not limited to, fraud, cyber-attacks, network and communication failures, as well as identity theft and phishing attacks related to crypto-assets.
