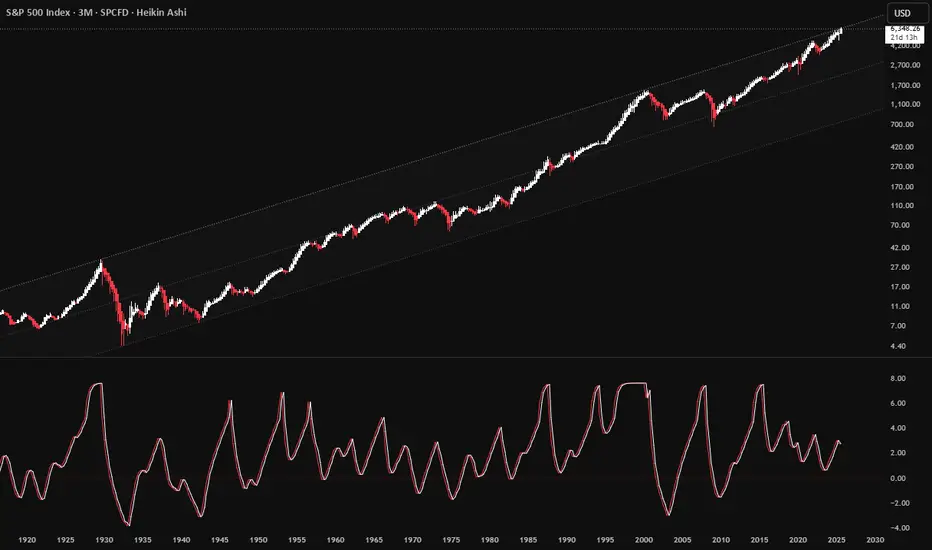
RevAs it breaks above the top of the logarithmic channel, the indicator is generating a sell signal. Clearly, medium-term investors should remain cautious.
SPCUSD trade ideas
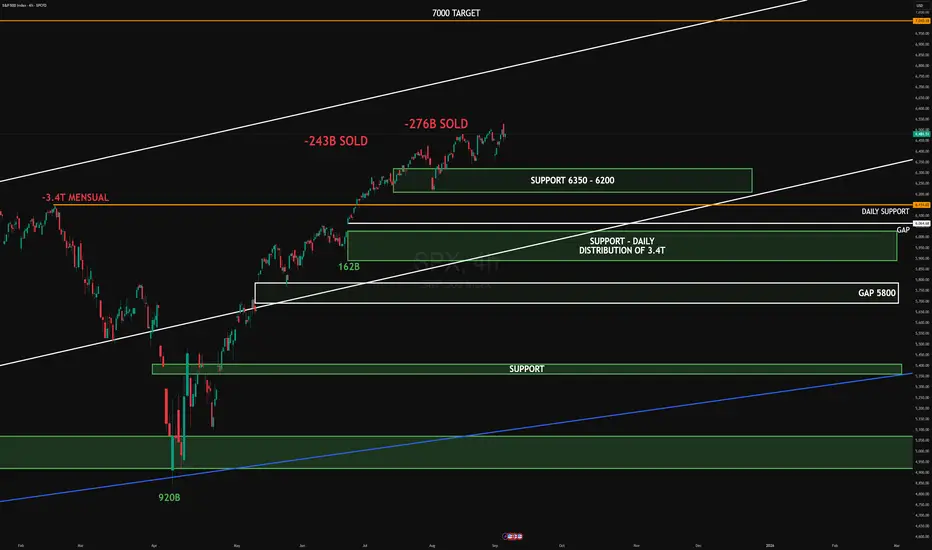
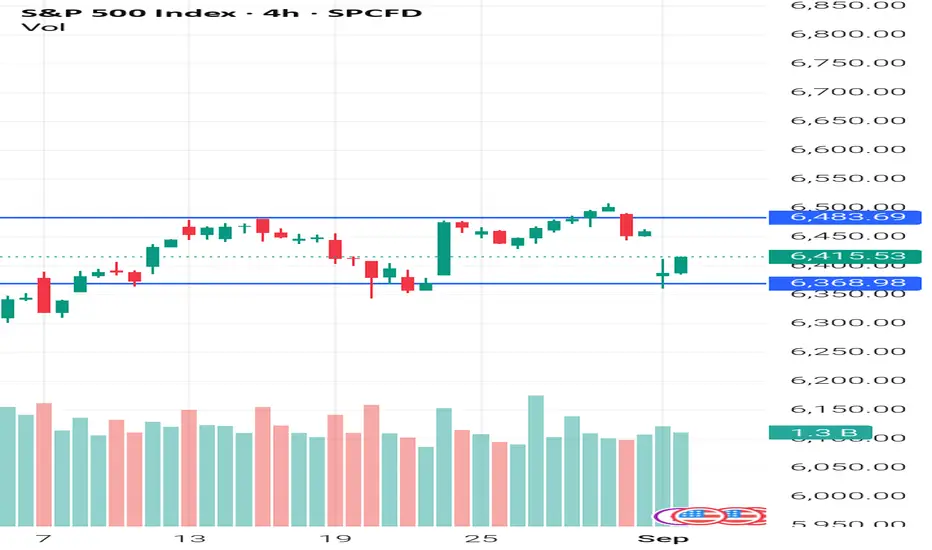
SPX DISTRIBUTION 2025SPX on the 4H chart is facing rejection near recent highs after notable sell volume (-243B and -276B).
Institutional absorption is visible, but upside momentum remains intact as long as the 6350–6200 support holds. Below that, the 3.4T daily distribution zone and the 5800 gap are key downside targets.
On the upside, the projected path points toward the 7000 area.
target: 7000
target: 5800
#SPX #globaltrade #investment #investing #stockmarket #wealth #realestate #markets #economy #finance #money #forex #trading #price #business #currency #blockchain #crypto #cryptocurrency #airdrop #btc #ethereum #ico #altcoin #cryptonews #Bitcoin #ipo
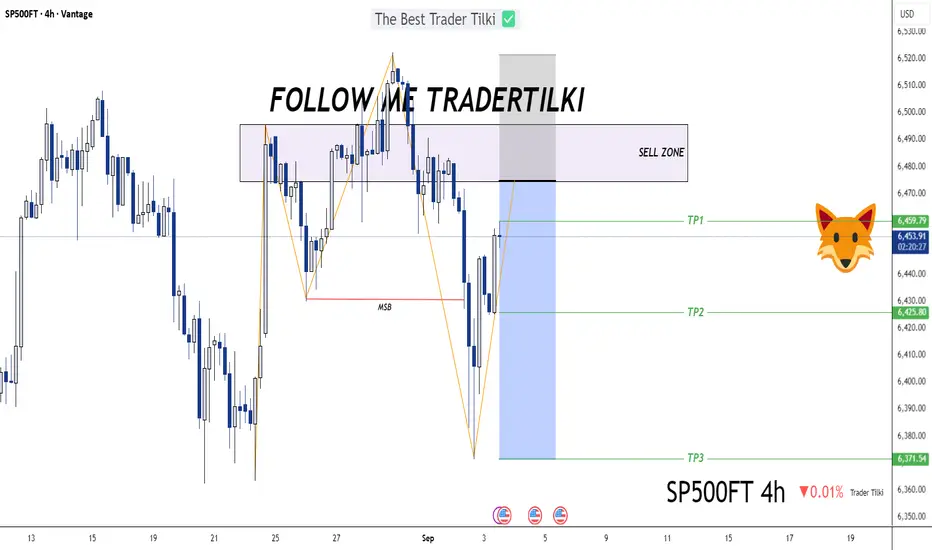
SP500 Structure Shift: Sell Zone ActivatedHey Guys 👋
I’ve prepared an SP500 analysis for you. Since the market structure has shifted, I’ll be opening a sell position from my designated sell zone.
📌 Entry: 6,474.90
📌 Stop: 6,522.12
🎯 TP1: 6,459.79
🎯 TP2: 6,425.80
🎯 TP3: 6,371.54
RISK REWARD - 2,21
Every single like you send my way is a huge source of motivation for me to keep sharing these analyses. Big thanks to everyone supporting with a like 🙏
In September, the S&P 500 Index Reached a New All-Time HighIn September, the S&P 500 Index Reached a New All-Time High
September is a month that statistically has the worst reputation for the S&P 500. However, in 2025 things may be different, as today the index hit a record high, rising above 6,520 points.
Bullish sentiment is being driven by:
→ expectations of an interest rate cut in September, which is believed will give the US economy a positive boost (and increase corporate profits);
→ yesterday’s release of the ISM Services PMI (actual = 52.0, forecast = 50.9), which pointed to industrial growth;
→ strong corporate results – for example, Broadcom (AVGO) published a solid report yesterday.
Technical Analysis of the S&P 500 Chart
Analysing the 4-hour chart of the S&P 500 on 28 August, we:
→ identified a support zone below 6,370;
→ noted several bearish signals and suggested that 6,500 could act as psychological resistance (with a potential false bullish breakout).
Indeed, since then (as shown by the blue arrows):
→ the price made a false breakout above 6,500;
→ then dropped to 6,370 to test the support zone;
→ after which it turned upwards again, forming a broad bullish engulfing pattern.
New data allows us to refine the position of the short-term channel (marked in blue), with the following perspectives:
→ Bearish view: the price is close to the upper boundary of the channel, which already showed resistance this morning (highlighted by the red arrow) – the candlestick has a long upper shadow.
→ Bullish view: yesterday’s rally demonstrated signs of imbalance in favour of buyers (as detailed in the description of the Fair Value Gap pattern), and the breakout above 6,500 looks genuine (since the price is consolidating above it).
Both viewpoints seem to be well-reasoned, but the market is unlikely to remain in balance, as today (15:30 GMT+3) the release of US labour market data is scheduled – arguably the key event of the week in the economic calendar.
Depending on the figures, the S&P 500 might:
→ attempt to break through the upper boundary;
→ or retreat towards the median of the blue channel.
Be prepared for volatility spikes.
This article represents the opinion of the Companies operating under the FXOpen brand only. It is not to be construed as an offer, solicitation, or recommendation with respect to products and services provided by the Companies operating under the FXOpen brand, nor is it to be considered financial advice.

$SPX500 Swing Trade: Bullish SMA Setup!📈 S&P 500 CFD: Thief’s Bullish Pullback Plan 🤑💰
🚨 Swing/Day Trade Setup: S&P 500 Index CFDSteal profits with this 200 SMA Pullback Plan using the "Thief" layered entry strategy! 📊💸 Below is a detailed breakdown combining technicals, fundamentals, and market sentiment to help you navigate this bullish opportunity. Let’s dive in! 🐂
🎯 Trading Plan Overview
Asset: S&P 500 Index CFD ( FOREXCOM:SPX500 )
Bias: Bullish 🐂
Strategy: Pullback to 200 SMA with layered "Thief" limit orders for entries
Why This Plan?
Technicals: The S&P 500 is riding record highs with strong momentum, supported by the 200 SMA as a dynamic support level.
Fundamentals: Cooling inflation (PPI -0.1% vs. +0.3% expected), 100% Fed rate cut probability, and robust corporate earnings (+10% in 2025, +13% in 2026) fuel bullish sentiment.
Sentiment: Neutral Fear & Greed Index (51/100) with low volatility (VIX ~15.04) and AI-driven institutional flows (e.g., Oracle +30%).
📊 Thief’s Technical Setup
Entry Strategy:
Use the Thief Layered Entry approach with multiple buy limit orders to catch pullbacks:
🔔 Buy Limit 1: $6,460
🔔 Buy Limit 2: $6,480
🔔 Buy Limit 3: $6,500
🔔 Buy Limit 4: $6,520
💡 Pro Tip: Adjust layer levels based on your risk tolerance and market conditions. You can enter at any price level or add more layers for flexibility!
Entry Trigger: Pullback to the 200 SMA for optimal risk-reward.
Stop Loss (SL):
Suggested "Thief" SL: $6,440 (below key support).
⚠️ Note: Adjust your SL based on your risk management and strategy. Trade at your own risk, dear Traders!
Take Profit (TP):
Target: $6,700 (near resistance, potential overbought zone, or "police barricade" trap).
🚨 Note: Escape with profits before resistance hits! Set your TP based on your goals—don’t blindly follow mine. Take money at your own risk!
📡 Real-Time Market Data (10 Sept 2025, UTC+1)
Daily Change: +37.43 points (+0.57%)
YTD Performance: Record highs driven by AI optimism and Fed rate cut expectations.
😰😊 Fear & Greed Index
Current Sentiment: Neutral (Score: 51/100)
Breakdown:
📈 Market Momentum: Bullish (S&P 500 above 125-day MA).
🌬️ Volatility (VIX): Low (~15.04), signaling calm markets.
🛡️ Safe Haven Demand: Moderate (bonds lagging stocks).
💰 Junk Bond Demand: Slight greed (narrowing yield spreads).
⚖️ Options Activity: Balanced put/call ratio.
🏛️ Macro & Fundamental Analysis
Producer Price Index (PPI): August PPI fell -0.1% (vs. +0.3% expected), easing inflation concerns.
Fed Rate Cut: 100% probability of a 25-50 bps cut in September 2025.
Labor Market: Weaker-than-expected (911K jobs revised down through March 2025).
Corporate Earnings: Strong outlook (+10% growth in 2025, +13% in 2026).
Key Drivers:
🚀 AI investment surge (e.g., Oracle +30%, Nvidia strength).
🌍 Geopolitical risks (Poland-Russia tensions, Middle East concerns).
📉 Trade policy uncertainties (Trump tariff threats).
🐂🐻 Sentiment Analysis
Institutional Outlook: Cautiously optimistic
🏦 Deutsche Bank & Wells Fargo: S&P 500 targets at 7,000+ by 2026.
💡 Focus: AI capex and earnings resilience.
Retail Trader Mood: Mixed but leaning bullish
📈 Meme stock activity (e.g., GameStop +10%).
₿ Crypto correlation (Bitcoin at $111.9K, Solana at 7-month highs).
⚡ Why This Plan Stands Out
Technical Edge: The 200 SMA pullback is a proven strategy for swing/day traders, offering high-probability entries.
Thief Strategy: Layered limit orders maximize flexibility and reduce risk of missing the move.
Macro Support: Cooling inflation, Fed rate cuts, and AI-driven earnings create a bullish backdrop.
Sentiment Boost: Neutral sentiment with low volatility supports steady upside potential.
Risks to Watch: Geopolitical shocks, overvaluation concerns, and seasonal market weakness.
🔍 Related Pairs to Watch (in USD)
Nasdaq 100 CFD ( NASDAQ:NDX ): Tracks tech-heavy AI stocks driving S&P 500 momentum.
VIX ( TVC:VIX ): Monitor volatility spikes for potential reversals.
US 10-Year Treasury Yield ( TVC:TNX ): Impacts risk sentiment and stock valuations.
FX:USDJPY : Correlates with risk-on/risk-off market moves.
Bitcoin ( BITSTAMP:BTCUSD ): Tracks retail sentiment and risk appetite.
🚨 Key Takeaways
🏆 S&P 500 at record highs, supported by soft PPI and Fed cut expectations.
😎 Neutral sentiment with a greedy tilt if macro data improves.
🤖 AI trade dominates institutional flows, powering bullish momentum.
📅 Watch upcoming CPI data and Fed meeting for next catalysts.
✨ “If you find value in my analysis, a 👍 and 🚀 boost is much appreciated — it helps me share more setups with the community!”
#SPX500 #SwingTrading #DayTrading #ThiefStrategy #Bullish #TechnicalAnalysis #Macro #AI #FedRateCut #TradingIdeas

US 500 – Preparing for the Pivotal US Non-Farm Payrolls ReleaseAfter a slow start to trading in September due to the US Labour Day bank holiday on Monday, volatility for US indices has picked up across the week as traders react to multiple drivers, including concerns about the sustainability of government debt in the US, Europe and the UK which weighed on sentiment Tuesday, big tech getting a key win in one of the biggest anti-trust cases for years which provided support off the lows, and updates on the current health of the US economy and labour market, including a slightly disappointing ISM Manufacturing PMI Survey on Tuesday, and a weaker than expected JOLTs Job Openings report on Wednesday afternoon.
Unsurprisingly, the different responses to these drivers has seen the US 500 index trade from a Monday high of 6483 to a low of 6363 on Tuesday and then move back higher again to current levels around 6450 (0700 BST), as traders cautiously initiate fresh risk positions to kick off the start of September.
However, it could be said that the two biggest data releases of the week for traders to digest may still be to come. The first is the US ISM Services PMI which is released later today at 1500 BST. This reading surprised markets last month by falling below expectations to 50.1, just above the 50 level which separates economic expansion and contraction. Traders will be looking to see whether this new print confirms a trend of weaker service activity or if the July reading was just a one-off blip.
Then on Friday, it’s the release that potentially every trader has been waiting for since Federal Reserve Chairman Powell mentioned concerns about the strength of the US labour market in his keynote speech from Jackson Hole, and noted how policymakers will be watching employment data closely to determine whether a rate cut at their meeting on September 17th would be appropriate to help support the economy. The outcome of the components of this release, including the unemployment rate and average hourly earnings could determine not only the direction of the US 500 into the weekend but how it performs across the early part of September, a month which is historically one of the worst for US 500 performance.
Technical Update: Trend Extension or Trend Reversal?
A bullish uptrend is defined by higher price highs and higher price lows, reflecting positive sentiment. Traders within this backdrop are seen to buy dips in price at a higher level each time and are able to push prices above the previous high.
As the chart above shows, the US 500 index appears a classic example of an uptrend, with a pattern of higher highs and higher lows emerging since the April 7th low.
While the US 500 index may currently be tracing out a bullish trend, further price strength isn’t guaranteed, especially with Friday’s payrolls data looming. This release has the potential to shift investor sentiment in either direction, so traders could find it useful to monitor key support and resistance levels closely.
Potential Resistance Levels to Monitor:
The recovery from the September 2nd low of 6363, which was above the prior August 20th low of 6347, suggests the uptrend remains intact, keeping the focus on the August 28th all-time high at 6512. A close above this level could signal further price strength.
While no guarantee of continued upside, a break above 6512 may open a path towards 6775, which is the 100% Fibonacci extension, and potentially higher.
Potential Support Levels to Monitor:
If the US 500 index is maintaining an uptrend in price, the potentially important support focus is the August 20th low at 6347. A close below 6347 could see a negative shift in sentiment and increase the risk of a deeper decline.
A close below 6347 might well be a trigger for renewed weakness, with potential then to test 6214, the August 1st low, and possibly further.
The material provided here has not been prepared accordance with legal requirements designed to promote the independence of investment research and as such is considered to be a marketing communication. Whilst it is not subject to any prohibition on dealing ahead of the dissemination of investment research, we will not seek to take any advantage before providing it to our clients.
Pepperstone doesn’t represent that the material provided here is accurate, current or complete, and therefore shouldn’t be relied upon as such. The information, whether from a third party or not, isn’t to be considered as a recommendation; or an offer to buy or sell; or the solicitation of an offer to buy or sell any security, financial product or instrument; or to participate in any particular trading strategy. It does not take into account readers’ financial situation or investment objectives. We advise any readers of this content to seek their own advice. Without the approval of Pepperstone, reproduction or redistribution of this information isn’t permitted.

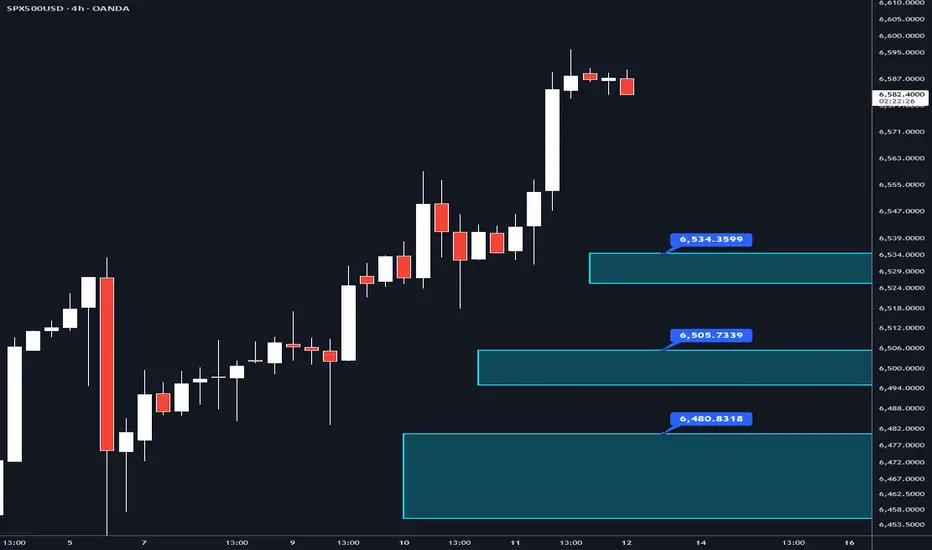
SPX500USD – Important Levels Below (Watch for Next Week)The S&P 500 is holding near all-time highs. When markets sit at extremes, it’s useful to map out where the structure lives underneath. These are levels that:
Could act as strong support if price pulls back (buy interest).
Or, if broken, could accelerate downside momentum into deeper zones.
Here are some confluent areas to keep in mind for next week (as today is Friday):
6.525 – 6,534 → Weekly vWAP, weekly time POC, and a poor low.
6,495 - 6,506 → Naked weekly POC and naked daily POC.
6,455 – 6,479 → Naked daily, naked weekly, monthly vWAP, daily naked POC, weekly naked POC, current monthly POC, and weekly time naked POC. So clearly the biggest level to watch!
Why these matter: when multiple levels overlap (VWAP, POC, HTF highs/lows, etc, liquidity often pools there. That makes them “decision points” — either support for a bounce or, if broken, fuel for a larger move down.
If you’re new to terms like VWAP or POC, don’t worry — they can be confusing at first. Leave a comment and I’ll happily explain, or DM me if you prefer to ask privately.
This post is for educational purposes only. It is not financial advice or a trading signal.

SPX500USD is still going up slowlyHi traders,
Last week SPX500USD finished the correction (Flat) and went up again just as I've said in previous outlook.
Price is not very impulsive. It looks like it forms an ending diagonal.
So next week we could see this pair slowly going up some more.
Let's see what the market does and react.
Trade idea: Wait for a small pullback and a change in orderflow to bullish on a lower timeframe to trade longs.
If you want to learn more about trading FVG's & liquidity sweeps with Wave analysis, then please make sure to follow me.
This shared post is only my point of view on what could be the next move in this pair based on my technical analysis.
Don't be emotional, just trade your plan!
Eduwave

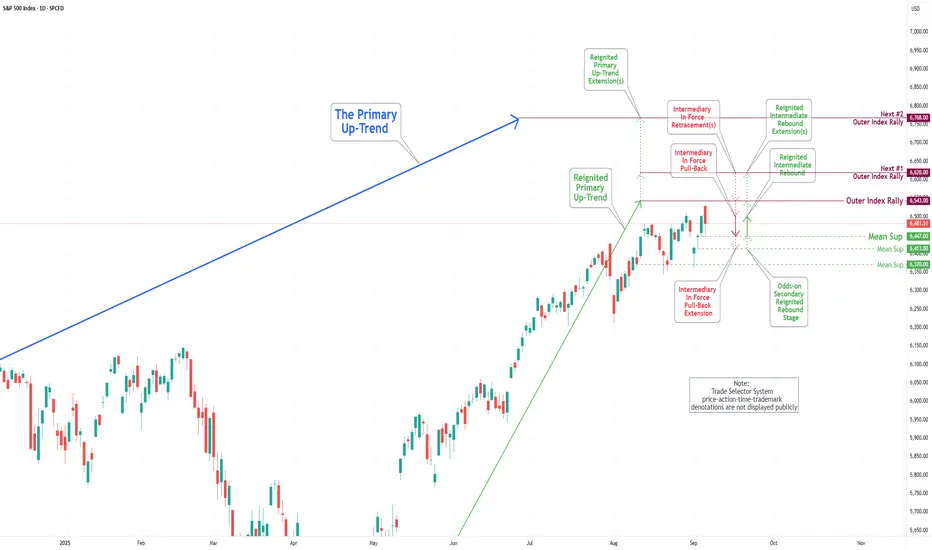
S&P 500 Daily Chart Analysis For Week of Sep 5, 2025Technical Analysis and Outlook:
During the trading sessions of the previous week, the S&P 500 Index exhibited a notable downward movement, reaching the Intermediary In Force Pullback Extension of 6370. An Odds-on Secondary Rebound subsequently followed this decline, as the index restored its upward trajectory by achieving the Mean Resistance level of 6502, although it subsequently settled below this benchmark.
It is essential to acknowledge that the current rebound from the Mean Support level of 6447 suggests a significant probability of a sustained upward movement toward the long-term objective, namely the Outer Index Rally at 6543, as detailed in the prior S&P 500 Daily Chart Analysis. Conversely, one must consider the potential for a substantial pullback to the Mean Support extension level of 6413, which would likely precede another rebound.
Moreover, it is critical to recognize that the ongoing price fluctuations may induce a considerable pullback after the fulfillment of the Outer Index Rally target at 6543. Following this anticipated downward adjustment, the index will likely resume its upward trend, targeting the completion of the Outer Index Rally at 6420.
SPX500USD could go higherHi traders,
Last week SPX500USD played out exactly as predicted in my previous outlook. Right at the open it started the upmove and it continued the whole week making a new ATH.
Next week we could see this pair going up some more.
Let's see what the market does and react.
Trade idea: Wait for a small pullback and a change in orderflow to bullish on a lower timeframe to trade longs.
If you want to learn more about trading FVG's & liquidity sweeps with Wave analysis, then please make sure to follow me.
This shared post is only my point of view on what could be the next move in this pair based on my technical analysis.
Don't be emotional, just trade your plan!
Eduwave

SPX 6600 Target HitHello Traders, Well I expected a retrace by now but this market keeps powering higher. Well it finally hit the target many were talking about 6600 . It hit that number the other day on the ES as well. Its the 1.618 fib and the first resistance level and RSI is well overbought. Also we have a rate cut for Wednesday so a drop Monday and Tuesday before the rate cut on Wednesday powers the market and crypto higher makes sense. I don't think we are gonna get that big retrace I kind of expected yet. after we hit these targets we probably head up towards the dreaded 6666. See ya there!

SPX500USD – Rejected at 6,550, Holding 6,490 SupportThe S&P 500 Index faced rejection at the 6,550 resistance zone after a strong bullish run. Price is now pulling back toward the 6,490 support, which will be key for buyers to defend in order to maintain upside momentum.
Support at: 6,490 / 6,455 / 6,350 🔽
Resistance at: 6,550 🔼
🔎 Bias:
🔼 Bullish: A rebound from 6,490 could retest 6,550, and a breakout above would extend gains.
🔽 Bearish: A break below 6,490 and 6,455 would expose the 6,350 zone.
📛 Disclaimer: This is not financial advice. Trade at your own risk.

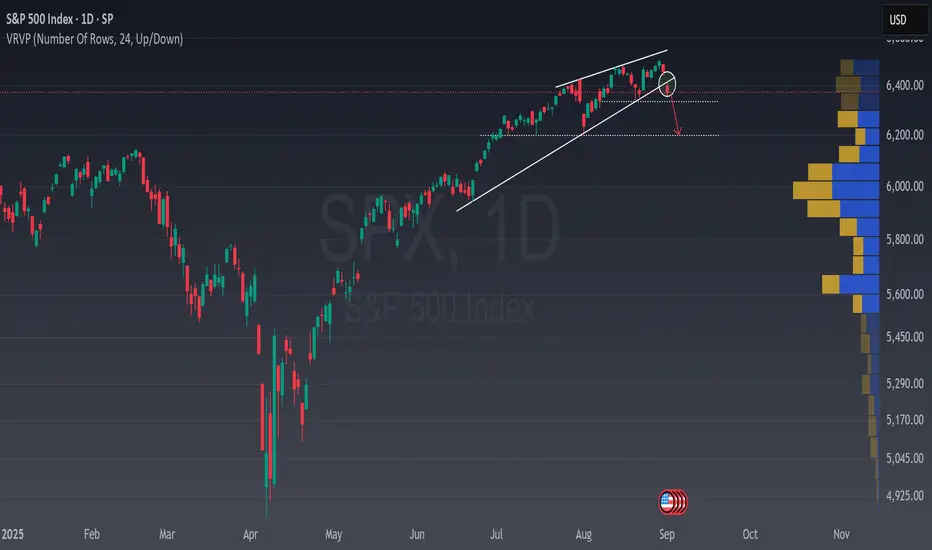
Early alert on SPX🚨 Early alert on SP:SPX
The S&P 500 just broke down from a rising wedge , a pattern that has historically marked the end of several bull legs in this index.
📊 In the image below you can see:
In one case, the wedge resolved with only a -4% pullback before the uptrend resumed.
In the second one, the correction went much deeper at around -17% before stabilizing.
👉 A rising wedge is not automatically a BIG crash signal , but it is REAL a warning flag . Losing key supports could open the door to a larger correction, while a quick recovery would keep the broader bull structure intact.
⚠️ Stay vigilant, SPX has a history of respecting this pattern. This is just an early alert for you all!
I'll be sharing in my newsletter more about rising wedges soon , I'm seeing many of them and that could mean that the bull trend, at least, needs a pause.
Yields front and center: Fundamental analysis Following 'labour day' the first trading day proper of September has kicked off with a bang. 'Rising yields' being a concern during the European session. A UK cabinet reshuffle caused UK GILTS to rapidly rise as the market grows increasingly concerned about the government's ability to guide the UK economy. The GBP weakened considerably.
Bonds in particular can be difficult to interpret, why would the GBP weaken so much with rising yields, but the USD strengthen when the US10 year is rising at the same time? I would suggest today's movement highlights the precarious situation the UK economy is currently in compared to the US economy. Meaning the market thinks the US consumer can withstand higher interest rates better than the UK consumer. There is also the case to say the USD was bought as a 'safe haven' in what amounted to a yields up / stocks down = risk off European session.
During the North American session, 'soft ISM data' put the breaks on the rising yield narrative, creating a 'bad news is good news' scenario. Meaning 'soft US data' still keeps rate cuts on the table. And overall, my underlying 'risk on' bias remains in tact. The market has (not yet) reacted to the tariff supreme court ruling, which is something to keep an eye on.
I also think the door has been open for potential GBP short 'relative fundamental' trade. Something like an AUD GBP short (depending on the outcome of upcoming AUD GDP data).
Signals Align for an S&P 500 PullbackThe VANTAGE:SP500 has broken below the EMA 200/100/50/20 while forming a bearish rising wedge and completing an Elliott 5-wave sequence. A MACD bearish crossover and an RSI near 40 further confirm downside momentum. However, this sets the stage for attractive buying opportunities in the near term.

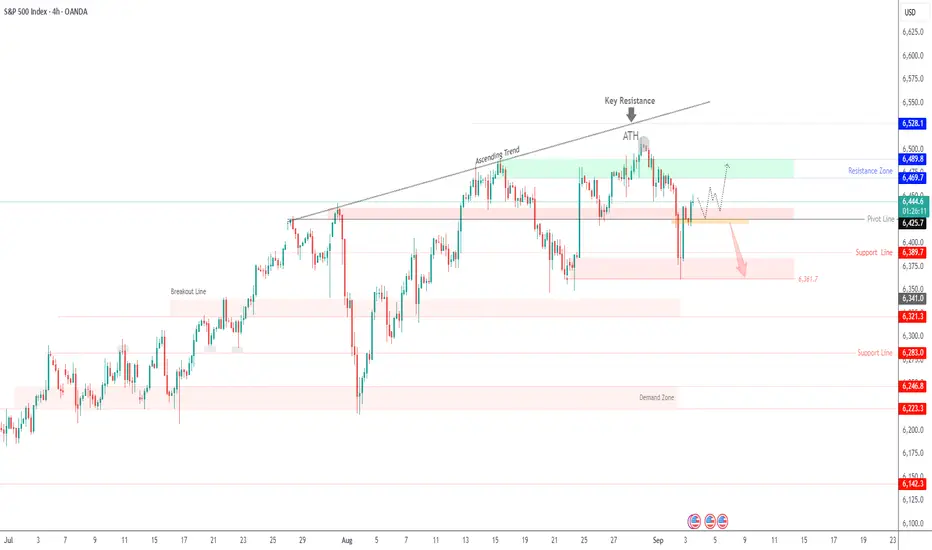
SPX500 | Indexes Rise Ahead of JOLTS Data – Key Pivot 6,438S&P 500 & Nasdaq Futures – Update
Futures tied to the S&P 500 and Nasdaq rebounded on Wednesday, led by gains in Alphabet after its antitrust ruling. Dow futures edged slightly lower as traders await fresh labor market data. The focus today is the JOLTS report (10 a.m. ET), the first of several key releases this week, with nonfarm payrolls on Friday being the most important.
Technical Outlook (SPX500):
🔼 Price reversed from the 6,366 support mentioned in yesterday’s update and has now stabilized above the pivot line at 6,438.
As long as price holds above 6,438, upside momentum is expected toward 6,469 → 6,489, with extended resistance at 6,528.
🔻 On the downside, a confirmed 1H close below 6,420 would shift momentum bearish, exposing 6,389 → 6,361.
Key Levels:
Resistance: 6,469 – 6,489 – 6,528
Support: 6,420 – 6,389 – 6,361
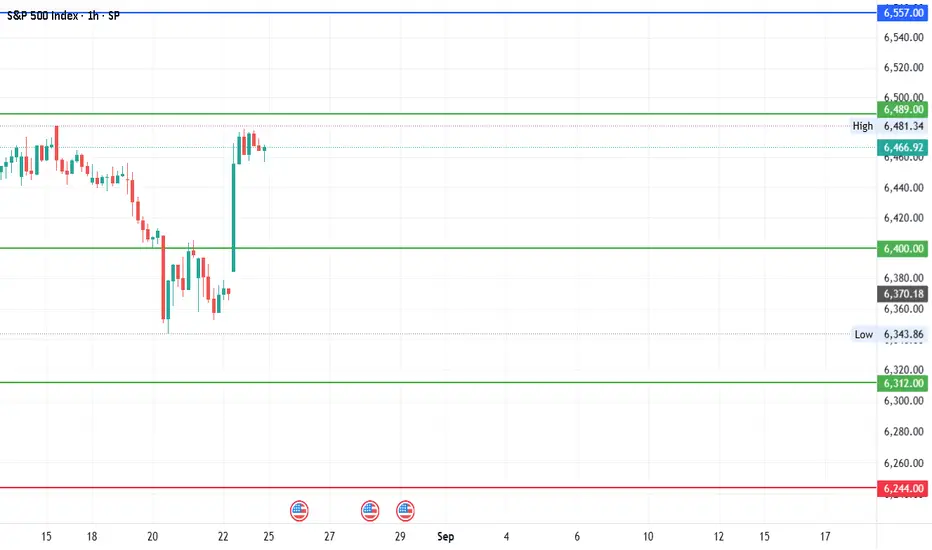
#SPX - 300 points move?Date: 24-08-2025
SPX- Current Price: 6466.92
Pivot Point: 6400
Support: 6312
Resistance: 6489
Upside Targets:
--------------------------------
| Target | Price |
---------------------------------
| 🎯 Target 1 | 6557 |
| 🎯 Target 2 | 6625 |
| 🎯 Target 3 | 6710 |
| 🎯 Target 4 | 6794 |
Downside Targets:
| 🎯 Target 1 | 6244 |
| 🎯 Target 2 | 6175 |
| 🎯 Target 3 | 6090 |
| 🎯 Target 4 | 6006 |
#TradingView #Nifty #BankNifty #DJI #NDQ #SENSEX #DAX #USOIL #GOLD #SILVER
#BHEL #HUDCO #LT #LTF #ABB #DIXON #SIEMENS #BALKRISIND #MRF #DIVISLAB
#MARUTI #HAL #SHREECEM #JSWSTEEL #MPHASIS #NATIONALUM #BALRAMCHIN #TRIVENI
#USDINR #EURUSD #USDJPY #NIFTY_MID_SELECT #CNXFINANCE
#SOLANA #ETHEREUM #BTCUSD #MATICUSDT #XRPUSDT #PEPEUSDT #SHIBUSDT
#Crypto #Bitcoin #BTC #CryptoTA #TradingView #PivotPoints #SupportResistance
SPX at verge of breaking down?SP:SPX is treading dangerously in a bearish wedge formation with multiple bearish divergences in RSI.
A breakdown from here could send it around 6200 zone. And that might just be beginning of the fall everyone is waiting for, on account of excessive debt and inflation situation.

S&P500 | Daily Double Top | GTradingMethodHello Traders.
Welcome to today's trade idea by GTradingMethod.
🧐 Market Overview:
I’ve opened a short on the cash500 (S&P 500) at 6521. All GTradingMethod variables have been met, which means this trade setup qualifies under my system.
Additional confluences suggesting weaker buying strength include:
- RSI making lower highs while price pushed higher highs.
- Volume tapering off toward the latter part of the rally.
- MACD on sell signal
The only hesitation is that money flows have not decreased in the later stages of this move — but rules are rules. My edge is probability-based, so when my variables align, I must take the trade consistently.
📊 Trade Plan:
Risk/reward = 9.2
Entry price = 6520
Stop loss price = 6544
Take profit level 1 (50%) = 6370
Take profit level 2 (50%) = 6215
💡 GTradingMethod Tip:
A high RR doesn’t make a trade safer — it simply reflects how far the market could move relative to your risk. Always focus on process and probability, not just the potential payout.
🙏 Thanks for checking out my post!
Make sure to follow me to catch the next idea and please share your thoughts - I would like to hear them.
📌 Please note:
This is not financial advice. This content is to track my trading journey and for educational purposes only.

U.S. Macroeconomic DashboardThis is more of a cheatsheet/how-to for my own reference on my macro indicators charting layout. If the chart layout is helpful to the community, all the better! I find it useful for studying events and crises.
Indicators used: SPX, VIX, FEDFUNDS + US10Y + T10Y2Y, USIRYY + USCIR, UNRATE, USBCOI, BAMLH0A0HYM2, DXY
Row 1: Equity and volatility benchmarks
Row 2: Policy stance and inflation
Row 3: Unemployment and growth metrics
Row 4: Credit spreads and USD strength
SPX
Measuring : Equity benchmark
Relevance : Broadest market barometer
Observe : Trend direction, key levels, divergence vs other indicators
VIX
Measuring : Volatility index
Relevance : Market's implied volatility (read: "fear/greed gauge")
Observe : Spike --> risk-off, hedging demand; sustained lows --> complacency
FEDFUNDS + US10Y + T10Y2Y
Measuring : U.S. policy stance and yield curve
Relevance : Monetary tightening and loosening; yield curve recession slope
Observe : T10Y2Y curve inversion --> recession risk; bear steepening --> watch for inflation/deficit concerns; bull steepening --> Fed easing, recovery signal
USIRYY + USCIR
Measuring : Inflation
Relevance : Headline: all prices; Core: Excluding food + energy
Observe : Headline stat drives short-term moves. Core stat drives Fed policy
UNRATE
Measuring : Unemployment rate
Relevance : Labor market health (this is a lagging indicator)
Observe : Rising trend --> recession risk; very low --> possible overheating
USBCOI
Measuring : Manufacturing PMI; Business activity
Relevance : Leading growth indicator for manufacturing, services
Observe : >50 means expansion, <50 means contraction
BAMLH0A0HYM2
Measuring : U.S. High Yield Option-Adjusted Spread (the extra yield/spread investors demand to hold junk bonds vs risk-free Treasuries)
Relevance : Stress in corporate bond markets; risk sentiment
Observe : Widening --> investors demand more compensation for credit risk; narrowing --> investors are confident, low fear of defaults. 2-4 is normal, 4-6 is stressed, 6+ is distress, 10+ is crisis level
DXY
Measuring : USD strength
Relevance : Global liquidity, capital flows, financial conditions
Observe : Strong USD = tighter conditions and pressure on risk assets; inverse for weak USD

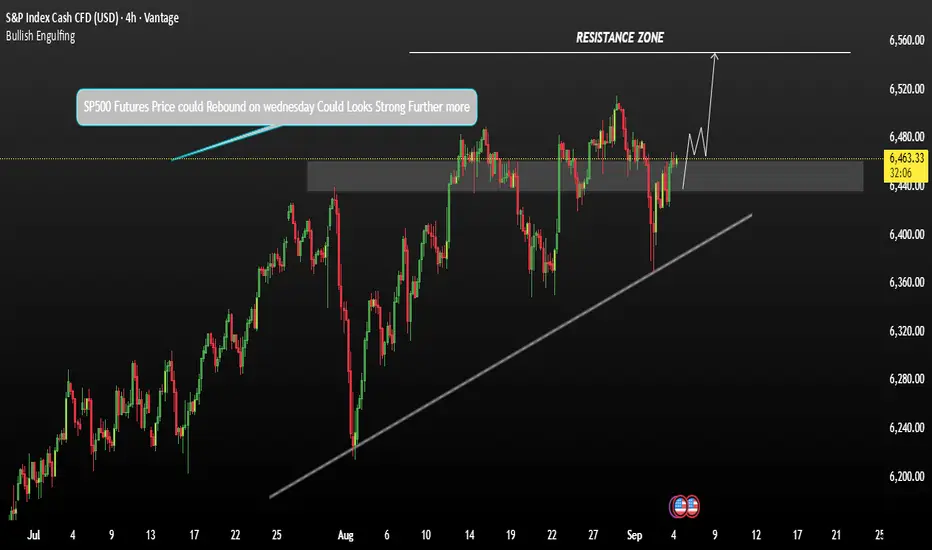
SP500 Futures Looks Reverse from support SP500 outlook On Wednesday, September 3, 2025, the S&P 500 rose by 0.5%, powered by substantial gains in Alphabet, which jumped over 9% following a favourable antitrust ruling. The Nasdaq also gained around 1%, while the Dow edged slightly lower by about 0.05%.
Analysts viewed this as a clear win for Alphabet and Apple, prompting raised price targets and renewed optimism for the broader tech sector.
S&P 500 futures climbed roughly 0.3%, and Nasdaq futures rose by about 0.7%, reflecting optimistic expectations for further upside. Fed officials signalled a possible rate cut, with investors pricing in a 96% chance of a 25 bps cut by the Fed meeting on September 17, 2025. The market now eyes Friday’s Nonfarm Payrolls report as the most critical release of the week, alongside the usual weekly data.
SP500 support around 64.30 (though SPY is currently at 6430, the level might reflect a different index or instrument) is interesting—the upside momentum appears to be heading toward resistance near 6,505,
You may find more details in the chart.
Trade wisely best of Luck.
Ps; Support with like and comments for better analysis.
S&P500 Strong buy signal if the 4H MA200 holds.The S&P500 index (SPX) has been pulling back since the August 28 All Time High (ATH) and is headed for a 4H MA200 (orange trend-line) test.
This is a major short-term buy point as since April 25, every contact with this trend-line (6 so far) resulted into a new rally/ Bullish Leg.
The last two in particular rose as high as the 1.236 Fibonacci extension. So as long as the 4H MA200 holds, that gives us a 6530 short-term Target.
-------------------------------------------------------------------------------
** Please LIKE 👍, FOLLOW ✅, SHARE 🙌 and COMMENT ✍ if you enjoy this idea! Also share your ideas and charts in the comments section below! This is best way to keep it relevant, support us, keep the content here free and allow the idea to reach as many people as possible. **
-------------------------------------------------------------------------------
💸💸💸💸💸💸
👇 👇 👇 👇 👇 👇
