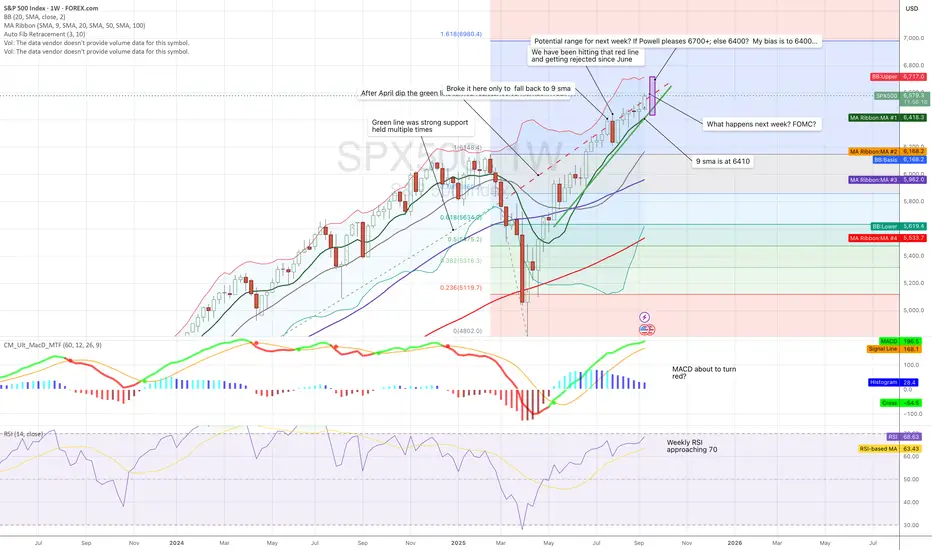
A perspective as we approach FOMC next weekAnalysis on SP:SPX , see notes attached on chart. Feedback welcome. Thanks
SPCUSD trade ideas
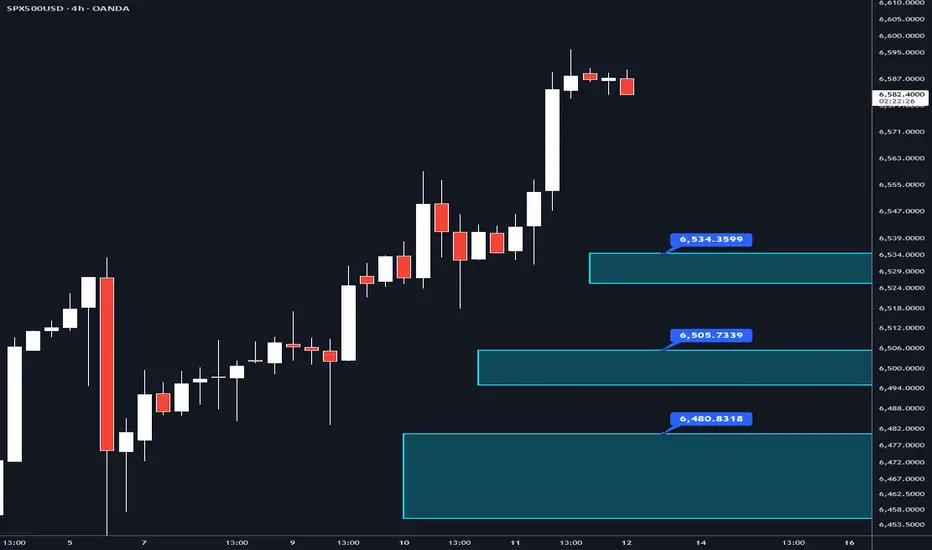
SPX500USD – Important Levels Below (Watch for Next Week)The S&P 500 is holding near all-time highs. When markets sit at extremes, it’s useful to map out where the structure lives underneath. These are levels that:
Could act as strong support if price pulls back (buy interest).
Or, if broken, could accelerate downside momentum into deeper zones.
Here are some confluent areas to keep in mind for next week (as today is Friday):
6.525 – 6,534 → Weekly vWAP, weekly time POC, and a poor low.
6,495 - 6,506 → Naked weekly POC and naked daily POC.
6,455 – 6,479 → Naked daily, naked weekly, monthly vWAP, daily naked POC, weekly naked POC, current monthly POC, and weekly time naked POC. So clearly the biggest level to watch!
Why these matter: when multiple levels overlap (VWAP, POC, HTF highs/lows, etc, liquidity often pools there. That makes them “decision points” — either support for a bounce or, if broken, fuel for a larger move down.
If you’re new to terms like VWAP or POC, don’t worry — they can be confusing at first. Leave a comment and I’ll happily explain, or DM me if you prefer to ask privately.
This post is for educational purposes only. It is not financial advice or a trading signal.
Multinational Corporations (MNCs) & Their Impact on Global TradiHistorical Evolution of MNCs in Global Trade
Early Forms (Pre-19th Century):
Trading companies like the British East India Company and Dutch East India Company (VOC) in the 17th century were precursors of modern MNCs.
These entities controlled trade routes, natural resources, and colonies, combining commercial with quasi-governmental powers.
They were central to early globalization, particularly in spices, textiles, and precious metals.
Industrial Revolution (19th Century):
Rise of steamships, railways, and telegraphs facilitated international business expansion.
Companies like Singer Sewing Machine and Coca-Cola began setting up operations in multiple countries.
Access to new markets and raw materials became driving forces.
20th Century Expansion:
Post-WWII era saw unprecedented growth in MNC activity.
Organizations like the World Bank, IMF, and GATT/WTO created favorable conditions for cross-border trade.
Automotive companies (Ford, Toyota), pharmaceuticals (Pfizer, Novartis), and oil firms grew into global giants.
21st Century Globalization & Digital Age:
MNCs now dominate global trade through sophisticated supply chains and digital platforms.
Technology firms like Amazon, Google, Meta, and Alibaba reshape e-commerce and services.
The scale and influence of MNCs rival those of many nation-states.
MNCs’ Role in Shaping Global Trade
1. Expansion of Global Markets
MNCs increase trade volumes by producing goods in one country and selling them in another. For instance:
Apple designs in the U.S., manufactures in China, and sells globally.
Nestlé sources raw materials from Africa, processes them in Europe, and distributes worldwide.
This multiplies cross-border flows of goods, services, and intellectual property.
2. Creation of Global Supply Chains
MNCs pioneered the idea of fragmented production. A single product may pass through 10–15 countries before reaching consumers.
Example: A smartphone’s chips from Taiwan, software from the U.S., assembly in Vietnam, packaging in China, and final sales in India.
This supply chain structure makes global trade deeply interconnected.
3. Foreign Direct Investment (FDI)
MNCs contribute significantly to global trade through FDI, where they invest in factories, offices, or infrastructure abroad.
FDI increases production capacity and export potential.
Countries like India, Vietnam, and Mexico attract MNCs for low-cost production and skilled labor.
4. Technology Transfer
MNCs carry cutting-edge technologies across borders, fostering industrial upgrades in host nations.
For example, Toyota’s lean manufacturing system spread globally, revolutionizing efficiency.
Tech giants bring digital innovations to developing economies.
5. Employment Generation & Skill Development
MNCs provide millions of jobs in host countries and train local workforces in global standards.
BPOs in India (Infosys, Accenture, IBM) boosted IT-enabled services exports.
Manufacturing hubs in Southeast Asia thrive because of MNC-driven employment.
6. Influence on Trade Policies
MNCs lobby governments for trade liberalization, favorable tax regimes, and investment treaties.
WTO and regional trade agreements are shaped significantly by corporate interests.
They encourage reduction of tariffs, opening markets for goods and services.
Positive Impacts of MNCs on Global Trading
1. Increased Efficiency & Lower Costs
MNCs exploit comparative advantages across countries—cheaper labor in Asia, advanced R&D in Europe, or abundant resources in Africa.
This leads to cost efficiency, making products affordable globally.
2. Market Expansion for Developing Nations
Countries gain access to international markets by integrating into MNC supply chains.
Example: Vietnam emerged as a textile and electronics hub thanks to MNC-led exports.
3. Enhanced Consumer Choices
Consumers worldwide enjoy diverse products—from Starbucks coffee to Samsung phones—reflecting cultural and trade interconnections.
4. Rising Standards of Living
Jobs created by MNCs, along with affordable goods, enhance purchasing power and lifestyles in host countries.
5. Stimulation of Competition
MNC entry often forces domestic firms to innovate, improve efficiency, and adopt international best practices.
Negative Impacts of MNCs on Global Trading
1. Economic Dependence & Vulnerability
Host nations may become overly dependent on MNCs for exports and employment.
Example: Mexico’s reliance on U.S. auto firms makes its trade highly vulnerable to U.S. policy changes.
2. Unequal Power Relations
MNCs sometimes exploit weak regulatory systems, extracting resources without fair returns to host nations.
Oil and mining companies in Africa often face criticism for resource exploitation.
3. Cultural Homogenization
Global brands replace local products, diluting cultural uniqueness.
McDonaldization or Coca-Colonization symbolizes cultural dominance.
4. Tax Avoidance & Profit Shifting
MNCs use complex accounting methods to shift profits to low-tax jurisdictions.
Example: Google and Apple have faced criticism for using tax havens.
5. Environmental Challenges
Global production driven by MNCs often leads to pollution, deforestation, and carbon emissions.
Fashion MNCs contribute significantly to fast fashion waste and water pollution.
6. Labor Exploitation
MNCs are accused of paying low wages, unsafe working conditions, and exploiting cheap labor.
Sweatshops in Southeast Asia producing garments for Western brands are prime examples.
MNCs and the Future of Global Trade
Digital Globalization:
E-commerce, cloud services, and fintech expand trade without traditional borders.
Geopolitical Tensions:
U.S.-China trade war shows MNCs must adapt supply chains to political risks.
Sustainability Pressure:
ESG (Environmental, Social, Governance) standards are pushing MNCs to adopt greener practices.
Technological Disruption:
AI, automation, and blockchain reshape trade operations, logistics, and transparency.
Deglobalization Trends:
Some countries are reshoring industries, reducing reliance on foreign supply chains.
MNCs must balance globalization with localization strategies.
Conclusion
Multinational Corporations are at the heart of global trade. They are engines of growth, technology transfer, and cultural exchange, but they also raise questions about fairness, sustainability, and sovereignty. As global trading continues to evolve in the 21st century, MNCs will remain both drivers and disruptors. Their influence is likely to increase as technology erases borders, but they must balance profit with responsibility.
Ultimately, the future of global trading will be shaped not only by governments and international institutions but also by the strategies, ethics, and adaptability of MNCs. Their choices will determine whether globalization leads to inclusive prosperity or deepening divides.


SPX looking vulnerableThose intense uptrend usually cannot be maintained for long periods.So possibly a tad vulnerable

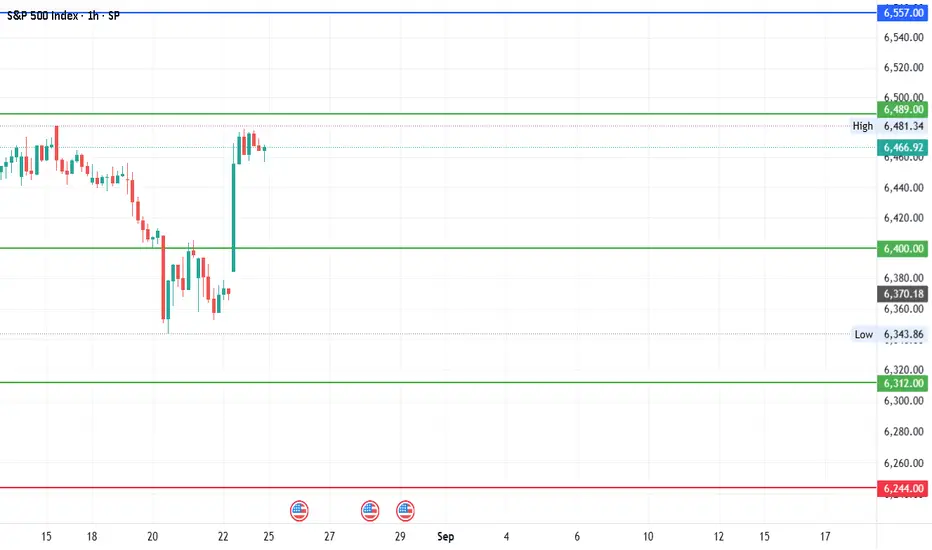
#SPX - 300 points move?Date: 24-08-2025
SPX- Current Price: 6466.92
Pivot Point: 6400
Support: 6312
Resistance: 6489
Upside Targets:
--------------------------------
| Target | Price |
---------------------------------
| 🎯 Target 1 | 6557 |
| 🎯 Target 2 | 6625 |
| 🎯 Target 3 | 6710 |
| 🎯 Target 4 | 6794 |
Downside Targets:
| 🎯 Target 1 | 6244 |
| 🎯 Target 2 | 6175 |
| 🎯 Target 3 | 6090 |
| 🎯 Target 4 | 6006 |
#TradingView #Nifty #BankNifty #DJI #NDQ #SENSEX #DAX #USOIL #GOLD #SILVER
#BHEL #HUDCO #LT #LTF #ABB #DIXON #SIEMENS #BALKRISIND #MRF #DIVISLAB
#MARUTI #HAL #SHREECEM #JSWSTEEL #MPHASIS #NATIONALUM #BALRAMCHIN #TRIVENI
#USDINR #EURUSD #USDJPY #NIFTY_MID_SELECT #CNXFINANCE
#SOLANA #ETHEREUM #BTCUSD #MATICUSDT #XRPUSDT #PEPEUSDT #SHIBUSDT
#Crypto #Bitcoin #BTC #CryptoTA #TradingView #PivotPoints #SupportResistance
Melt-Up into FOMC - Post FED Expect CorrectionMore all-time highs
I shouldn't be upset (and I'm really not as the portfolio continues to make new YTD highs)
But technically, it is extremely frustrating to see nothing more than slow grind higher after slwo grind higher on the indexes - and also see blowout moves on individual stocks (ORCL, GOOGL, AVGO for example)
Rising Wedge still hasn't rolled over, resistance at 6500 hasn't been a wall yet
50 Day Moving Average is now over 90 bars from price. I could see price action melting up
into a crescendo or peak pre, during, or post FOMC and then fading lower after to find
some technical levels I've been eyeing for weeks
Enjoy the melt-up, just be ready for some action and volatility in the indexes, gold, silver,
bitcoin, and the bond/yield markets
I won't complain about YTD highs, but it's the caution ahead that I don't want to be
surprised by in the coming weeks
Plan accordingly - I'll continue to grind through it the best and safest way I know how
Thanks for watching!!!

If the market wants to go up, we followThe US500 is breaking the resistance level and trading to new highs. We have to remind ourselves that we are not here to predict, but rather to follow the market. The market is breaking higher, and thus we follow.
For this trade, likely best to just use a trailing stop loss using either a 2-day low price, or ATRx2 trailing stop loss.

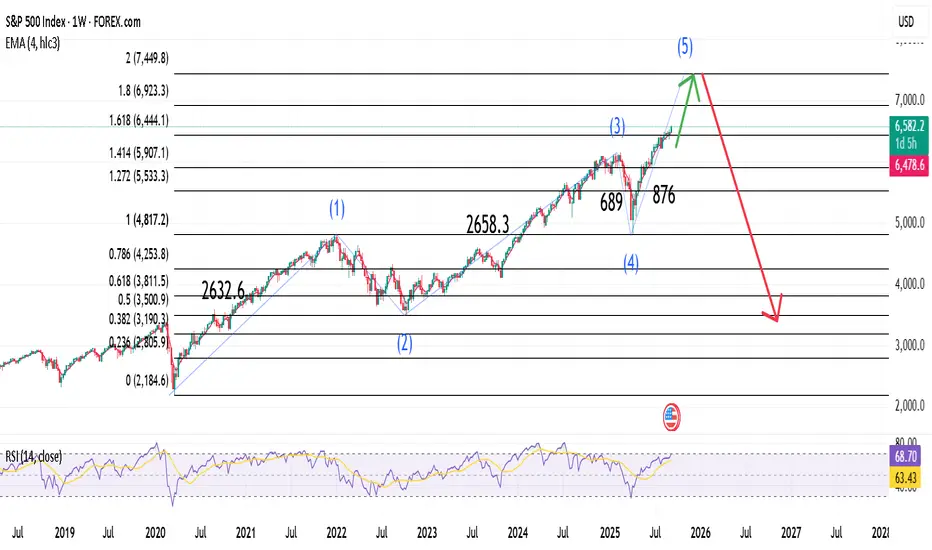
SPX 7450 end of bull cycle then3400In my view bullish cycle started in 2020 will complete at 7450 where massive crash will start to target 3400 area
SPX500 - 10% historical gains aheadThe Fed is shifting gears – and history shows what usually follows. Looking back at the past 21 Fed cutting cycles since 1957, the S&P 500 delivered +9.6% average returns within 12 months after the first cut.
This rally wasn’t just luck:
+6.1% from multiple expansion as valuations re-rate higher
+3.5% from earnings growth as financial conditions ease
Technically, the SPX500 has just broken out of consolidation and remains in a strong upward channel. Momentum is aligned with history – positioning the index for another leg higher. 🚀
If history rhymes, we could be looking at double-digit gains over the next year. The risk/reward couldn’t be clearer.
>> The white box shows you what a +10% gain would mean.
👉 Are you positioned for the next Fed-cut bull leg?
Stay safe and happy trading,
Meikel


Good time to get out of the MARKET (Too Heated)The market has never been this expensive and retailers are being the exit liquidity for whales / institutions. Almost like many people are just sitting a sipping away on an active volcano. The market could be jumping for a few days, but a rate cut confirms that the market is weak and needs a boost / help. Unfortunately, it's too little too late. Most macros show a clear sign of stress, which is not being reflected in the market (for now). Don't get too complacent...the VIX will spike at astronomical levels when the hammer falls. Best of luck!
SPX500 watch 6572-6664: Major Resistance may stall/stop Bull RunMarkets continue the bull run anticipating rate cuts.
SPX just hit a major resistance zone $6572.53-6664.59
Looking for a Dip or at least Consolidation in the red zone.
.

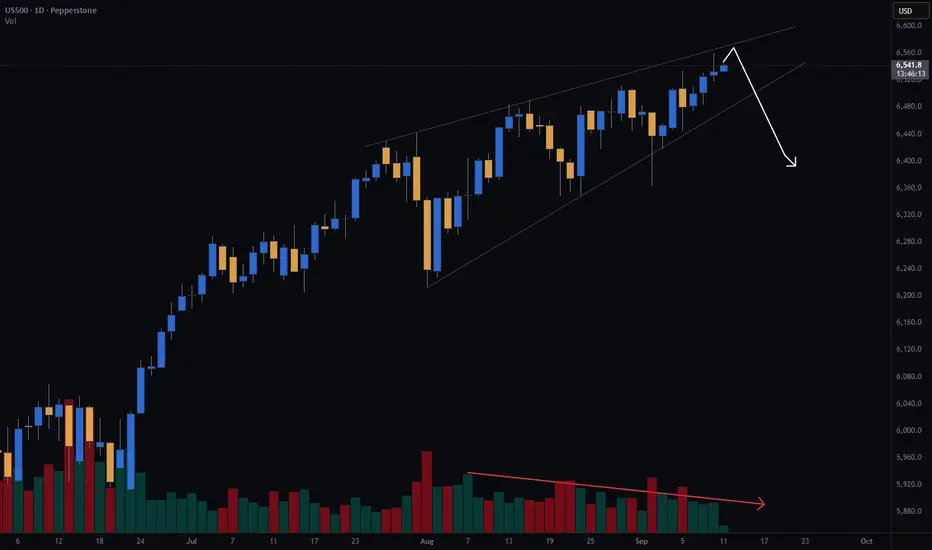
S&P500 | Daily rising wedge | GTradingMethodGood morning fellow traders,
S&P price action is tightening inside a rising wedge on the daily chart, with volume steadily dropping.
Rising wedges often signal potential reversals, but with CPI on deck, volatility could go either way.
My guess, price tests top of rising wedge, finds resistance and down we go - a long way down.
Keen to hear your thoughts on whether CPI is going to be a catalyst for a breakout or breakdown?
S&P500 reactsd to US Inflation dataUS CPI rose to 2.9% YoY in August (vs. 2.7%), showing inflation is re-accelerating.
Markets still expect a 25bp Fed cut next week, but scope for deeper easing is reduced.
For equities, this means headwinds for tech and other rate-sensitive growth stocks, while defensives and commodity-linked sectors may hold up better.
Overall, the print adds to volatility ahead of the Fed meeting, with equities likely to trade cautiously.
Key Support and Resistance Levels
Resistance Level 1: 6590
Resistance Level 2: 6610
Resistance Level 3: 6630
Support Level 1: 6440
Support Level 2: 6410
Support Level 3: 6380
This communication is for informational purposes only and should not be viewed as any form of recommendation as to a particular course of action or as investment advice. It is not intended as an offer or solicitation for the purchase or sale of any financial instrument or as an official confirmation of any transaction. Opinions, estimates and assumptions expressed herein are made as of the date of this communication and are subject to change without notice. This communication has been prepared based upon information, including market prices, data and other information, believed to be reliable; however, Trade Nation does not warrant its completeness or accuracy. All market prices and market data contained in or attached to this communication are indicative and subject to change without notice.

SPX500 ShortElite Analysis
Executed off 4H structural liquidity
Targeting lower structural liquidity
Executed in a lower time frame

S&P 500 Hits Record High Ahead of CPI ReportS&P 500 Hits Record High Ahead of CPI Report
Today at 15:30 GMT+3, the Consumer Price Index (CPI) report will be released.
In anticipation of the figures, traders remain optimistic – the S&P 500 index reached a new all-time high yesterday, climbing above 6,560 points.
The bullish sentiment is driven by:
→ Expectations of an interest rate cut in September, which is believed to provide a positive boost to the US economy (and increase corporate profits).
→ A sharp rally in Oracle (ORCL) shares. The company announced it had signed four multibillion-dollar contracts with three different clients.
Technical Analysis of the S&P 500
On the 4-hour chart of the S&P 500 index, the price continues to move within an ascending channel, shown in blue.
From a bearish perspective:
→ the price is near the upper boundary of the channel, which has acted as resistance for several weeks;
→ the RSI indicator is close to the overbought zone, which may discourage buyers from entering at higher prices;
→ yesterday’s candle had a long upper shadow (marked with an arrow), indicating increased selling pressure.
From a bullish perspective:
→ the local level of 6,520, after being broken, has switched from resistance to support;
→ in September, the price has followed a steep upward trajectory (marked with orange lines), with the lower line showing signs of support.
Taking this into account, we could assume that the market is in a short-term state of balance while awaiting the release of inflation data – arguably the key event of the week in the economic calendar.
Favourable figures could encourage the bulls to attempt a breakout above the upper boundary of the channel, lifting the S&P 500 to a new all-time high. Be prepared for spikes in volatility.
This article represents the opinion of the Companies operating under the FXOpen brand only. It is not to be construed as an offer, solicitation, or recommendation with respect to products and services provided by the Companies operating under the FXOpen brand, nor is it to be considered financial advice.


Hellena | SPX500 (4H): LONG to resistance area of 6600.Colleagues, the main idea is still the upward movement in the impulse of the middle wave “5”.
Wave “4” is likely to take place, because the bulls need to gain strength to update the local maximum of 6512.
The most important thing here is that the target of 6600 is a round number, which is quite attractive for buyers and limit sellers.
Manage your capital correctly and competently! Only enter trades based on reliable patterns!

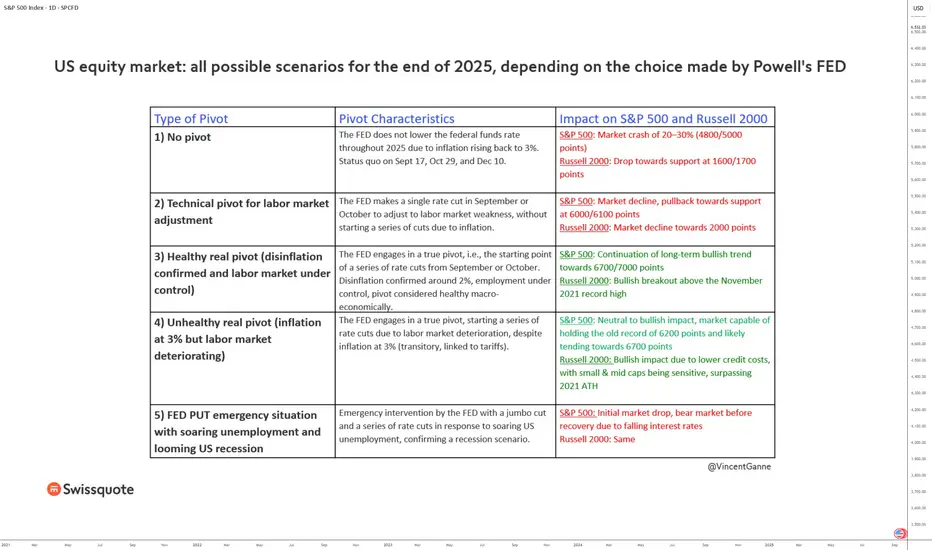
S&P 500: What Is the Chart Impact of the Fed on 09/17?The Federal Reserve’s monetary policy decision on Wednesday, September 17, will be decisive for the trajectory of U.S. equity markets at the end of 2025. Depending on Jerome Powell’s choice, scenarios range from a stock market crash to a new all-time high, with more neutral consolidation phases in between. Five possible options emerge, each with specific implications for the S&P 500 and the Russell 2000, which I describe below.
First case: no pivot.
If the Fed decides to keep rates unchanged throughout 2025 due to overly resilient inflation, then the scenario is clearly bearish. The lack of monetary support would suffocate market momentum, triggering a 20–30% crash in the S&P 500, dropping it to between 4,800 and 5,000 points. The Russell 2000, more fragile and sensitive to the macroeconomic environment, would retreat toward its critical support zone of 1,600–1,700 points.
Second case: a limited technical pivot.
The Fed might opt for just one rate cut in September or October, justified by a temporary adjustment to the labor market. In this case, markets would not see it as a strong easing signal but rather as a circumstantial gesture. Result: the S&P 500 would decline toward the 6,000–6,100 area, with a parallel correction of the Russell 2000 around 2,000 points.
Third case: a real and healthy pivot.
This is the most favorable scenario for Wall Street. Disinflation is confirmed near 2%, employment remains under control, and the Fed initiates a genuine rate-cutting cycle starting in September or October. In this context, the underlying bullish trend would regain full strength: the S&P 500 would head toward 6,700–7,000 points, while the Russell 2000 would break out of its consolidation to surpass its November 2021 record.
Fourth case: an unhealthy pivot.
Here, the Fed cuts rates in a more fragile environment: inflation remains near 3%, but it is primarily labor market deterioration that drives the decision. Markets could still find support from lower credit costs. The S&P 500 would preserve its former record at 6,200 points and likely aim for 6,700 points. The Russell 2000, more sensitive to financing conditions, would fully benefit from this easing, also surpassing its 2021 high.
Fifth case: the emergency Fed Put.
Finally, in the darkest scenario, a shock to employment would trigger a brutal Fed intervention, with a “jumbo cut” and a series of rapid rate reductions. While this support might contain the recession, the immediate reaction would be a sharp drop: the S&P 500 would plunge into bear market territory before a potential recovery tied to monetary easing. The Russell 2000 would follow the same trajectory.
DISCLAIMER:
This content is intended for individuals who are familiar with financial markets and instruments and is for information purposes only. The presented idea (including market commentary, market data and observations) is not a work product of any research department of Swissquote or its affiliates. This material is intended to highlight market action and does not constitute investment, legal or tax advice. If you are a retail investor or lack experience in trading complex financial products, it is advisable to seek professional advice from licensed advisor before making any financial decisions.
This content is not intended to manipulate the market or encourage any specific financial behavior.
Swissquote makes no representation or warranty as to the quality, completeness, accuracy, comprehensiveness or non-infringement of such content. The views expressed are those of the consultant and are provided for educational purposes only. Any information provided relating to a product or market should not be construed as recommending an investment strategy or transaction. Past performance is not a guarantee of future results.
Swissquote and its employees and representatives shall in no event be held liable for any damages or losses arising directly or indirectly from decisions made on the basis of this content.
The use of any third-party brands or trademarks is for information only and does not imply endorsement by Swissquote, or that the trademark owner has authorised Swissquote to promote its products or services.
Swissquote is the marketing brand for the activities of Swissquote Bank Ltd (Switzerland) regulated by FINMA, Swissquote Capital Markets Limited regulated by CySEC (Cyprus), Swissquote Bank Europe SA (Luxembourg) regulated by the CSSF, Swissquote Ltd (UK) regulated by the FCA, Swissquote Financial Services (Malta) Ltd regulated by the Malta Financial Services Authority, Swissquote MEA Ltd. (UAE) regulated by the Dubai Financial Services Authority, Swissquote Pte Ltd (Singapore) regulated by the Monetary Authority of Singapore, Swissquote Asia Limited (Hong Kong) licensed by the Hong Kong Securities and Futures Commission (SFC) and Swissquote South Africa (Pty) Ltd supervised by the FSCA.
Products and services of Swissquote are only intended for those permitted to receive them under local law.
All investments carry a degree of risk. The risk of loss in trading or holding financial instruments can be substantial. The value of financial instruments, including but not limited to stocks, bonds, cryptocurrencies, and other assets, can fluctuate both upwards and downwards. There is a significant risk of financial loss when buying, selling, holding, staking, or investing in these instruments. SQBE makes no recommendations regarding any specific investment, transaction, or the use of any particular investment strategy.
CFDs are complex instruments and come with a high risk of losing money rapidly due to leverage. The vast majority of retail client accounts suffer capital losses when trading in CFDs. You should consider whether you understand how CFDs work and whether you can afford to take the high risk of losing your money.
Digital Assets are unregulated in most countries and consumer protection rules may not apply. As highly volatile speculative investments, Digital Assets are not suitable for investors without a high-risk tolerance. Make sure you understand each Digital Asset before you trade.
Cryptocurrencies are not considered legal tender in some jurisdictions and are subject to regulatory uncertainties.
The use of Internet-based systems can involve high risks, including, but not limited to, fraud, cyber-attacks, network and communication failures, as well as identity theft and phishing attacks related to crypto-assets.
SPX500 Awaits CPI – Pivot 6,527 in Focus (Details Below...)SPX500 – Overview
U.S. futures were flat Thursday as traders awaited the August CPI report, which could shape expectations for a potential 50bps Fed rate cut next week. Earnings from Kroger and Adobe are also due.
On Wednesday, the S&P 500 gained +0.3% and the Nasdaq +0.03% to fresh record highs after a surprise drop in PPI and strong Oracle guidance, while the Dow fell -0.48% on Apple weakness.
Technical Outlook
📉 Below 6,527 → bearish momentum may extend to 6,506 → 6,490 → 6,470.
📈 Above 6,527 → bullish bias continues toward 6,550 → 6,565, with a potential push to 6,600 if CPI comes in softer (<2.9%).
⚠️ A hotter CPI print could trigger sharp downside volatility.
Key Levels
Pivot: 6,527
Resistance: 6,550 – 6,565 – 6,600
Support: 6,506 – 6,490 – 6,470

SPX - 2 Month Bearish DivergenceHello Traders,
As shown you can see the two month bearish divergence on the index. My thoughts are it needs resolved soon than later and the inflation data coming up next could be the spark that finally gets it going.... We will find out tomorrow at 8:30 if the data comes in hot the market will not like that.. We could get a selloff in stocks and crypto on no other than 9-11 anniversary. Stay tunes and lets see if I nailed this one or not.

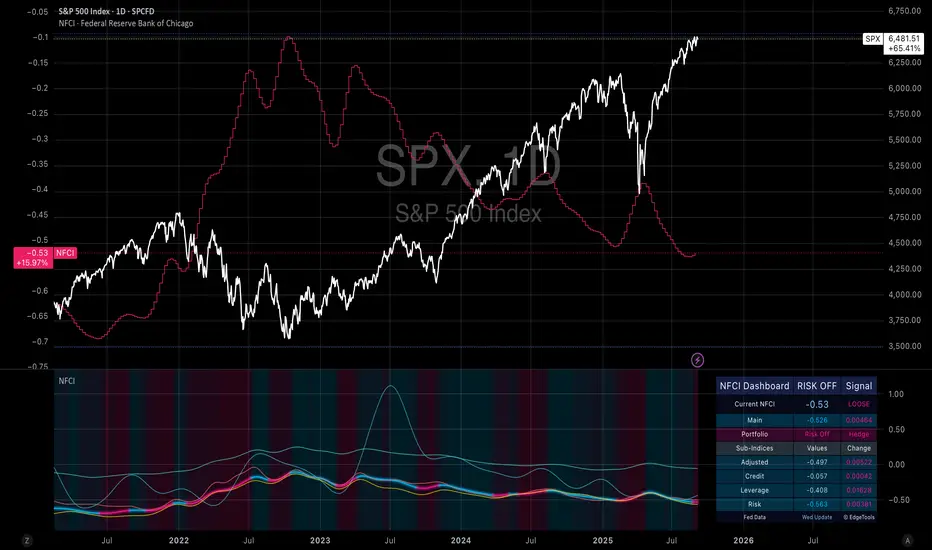
THE FED'S SECRET INDICATOR JUST FLASHED REDHERE'S WHAT IT MEANS FOR YOUR PORTFOLIO
The National Financial Conditions Index from the Chicago Federal Reserve has sent a clear signal this week: financial market conditions are deteriorating. After months of relative calm at a level of -0.53, the index rose on Wednesday, triggering the first "Risk Off" signal in an extended period. For institutional investors and risk-conscious traders, this is a moment that deserves attention.
The NFCI is not just another technical indicator. It represents the most comprehensive assessment of American financial market conditions available. Over 100 different data points flow into its calculation: from credit conditions to volatility measures to banking sector stress indicators. When this index rises, it means liquidity conditions are deteriorating, credit risks are increasing, and financial market stability is under pressure.
The historical evidence is clear. Both in 2008 and 2020, NFCI increases warned weeks before major market crashes of deteriorating conditions. The strategy of building defensive positions during NFCI rises has proven its effectiveness over long periods. While it doesn't deliver the spectacular returns of a pure buy-and-hold approach, it offers something far more valuable: capital protection in critical moments.
BASE CASE SCENARIO
Our base case assumes that the current NFCI rise marks the beginning of a typical correction phase. Historical data shows that such signals typically anticipate market declines of 10 to 15 percent over a period of three to six months. The correction would be driven by a combination of tighter credit conditions, increased volatility, and diminishing investor risk appetite.
In this scenario, we expect the S&P 500 to retreat from its current level of approximately 6,470 points to a level between 5,500 and 5,800 points. This would correspond to a decline of about 10 to 15 percent, equivalent to a normal, healthy correction in an otherwise intact bull market. Recovery would begin once the NFCI starts falling again, signaling that financial market conditions are relaxing.
This scenario is supported by the fact that the American economy remains fundamentally robust. Unemployment is low, corporate earnings continue to grow, and the Federal Reserve still has room for monetary policy support. A moderate decline would correct overvalued areas of the market without triggering a systemic crisis.
WORST CASE SCENARIO
The more pessimistic scenario considers the possibility that the current NFCI rise is the beginning of a more serious financial market disruption. In this case, the index could continue deteriorating and reach values historically associated with genuine financial crises. A sustained rise over several weeks, especially if the NFCI reaches positive values, would indicate systemic problems.
In this scenario, we would have to expect a market decline of 25 to 40 percent extending over 12 to 18 months. The S&P 500 would fall to levels between 3,900 and 4,900 points in this case. Such movements typically arise from a combination of credit squeeze, liquidity shortages, and self-reinforcing selling spirals.
The triggers for such a scenario could be diverse: an unexpected escalation of the geopolitical situation, the bursting of a speculation bubble in an important market segment, or a revaluation of credit risks in the banking sector. The worst-case scenario would also mean that the Federal Reserve would have to respond with aggressive measures, which in turn could lead to longer-term structural changes in monetary policy.
POSITIONING STRATEGY
Given these scenarios, a graduated defense strategy is appropriate. The first line of defense consists of reducing existing long positions and taking profits. This is particularly important for overvalued growth stocks that suffer disproportionately in correction phases.
The second stage involves building direct hedging positions. Put options on the S&P 500 with maturities of three to six months offer cost-effective protection against larger declines. Strike prices between 10 and 20 percent below the current market level should be chosen to achieve a balanced ratio between costs and protective effect.
For more aggressive traders, direct short positions are also available, but with strict risk management. Short positions should not exceed 5 to 10 percent of the total portfolio and must be closed immediately upon a reversal of the NFCI signal.
TIMING AND EXIT STRATEGY
Timing is crucial for NFCI-based strategies. The index is updated only once weekly, meaning signals don't immediately react to daily market movements. However, this is a feature, not a bug. The weekly frequency filters out market noise and focuses on substantial changes in financial market conditions.
The exit strategy is as important as the entry. As soon as the NFCI begins falling again, defensive positions should be gradually reduced. A decline of the index below its previous low would represent a clear "Risk On" signal and justify building new long positions.
It's particularly important not to try to catch the absolute bottom. The NFCI strategy is designed to capture the big moves, not to trade every small fluctuation. Patience and discipline are more important here than precision.
The current NFCI rise is a warning signal that should be taken seriously. While we cannot predict with certainty whether we are at the beginning of a small correction or a larger bear market, the historical evidence justifies defensive positioning. The combination of profit-taking, hedging strategies, and increased liquidity provides the best possible protection against the uncertainties that may lie ahead.
At a time when many investors are blinded by ongoing market euphoria, the NFCI reminds us that markets are cyclical and that caution is often the better part of valor. Those who position defensively today will have the flexibility tomorrow to act from a position of strength when better opportunities arise again.