Spk long to $0.07150JUst went long on spk
Sl: 0.06845
Tp1: 0.07150
Tp2: 0.076
Time sensitive
Get updates faster on X
SPKUSDT.P trade ideas

Spark SPK price analysisThis day has come and a new trend-narrative is emerging ?
Instead of memecoins on CRYPTOCAP:SOL , projects from the CRYPTOCAP:ETH ecosystem will now shooting ?)
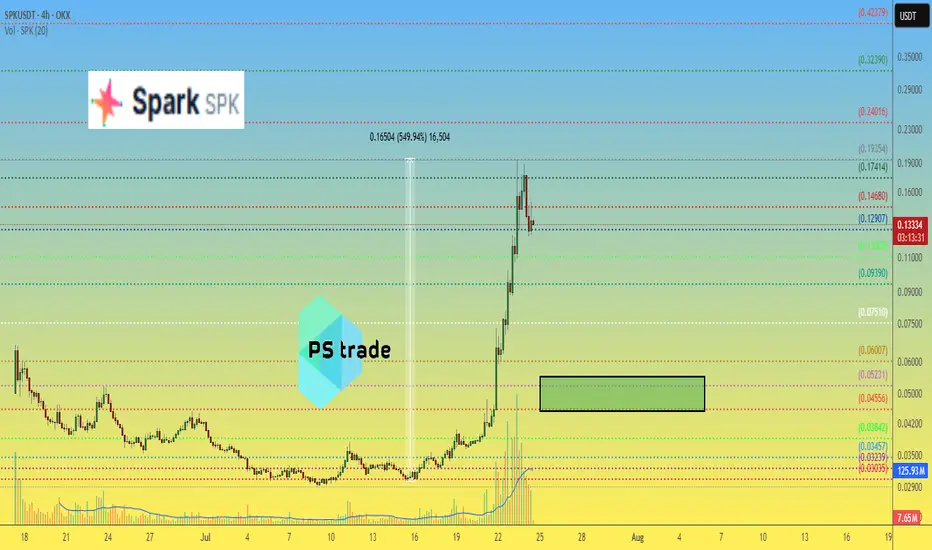
The #SPK coin has made + 550% in less than 10 days
and the capitalization of the #Spark project is "only" $150 million.
We personally do not feel comfortable buying at the current price of OKX:SPKUSDT
At $0.045-0.055 it would be much more comfortable
But it's definitely worth watching, maybe this narrative will be the same "money" button in the future ?)
What do you think?
spk short to $0.05230Just recently opened up a short position on spk
sl: 0.06112
scaling out 50% at $0.05532
Full tp at $0.05230

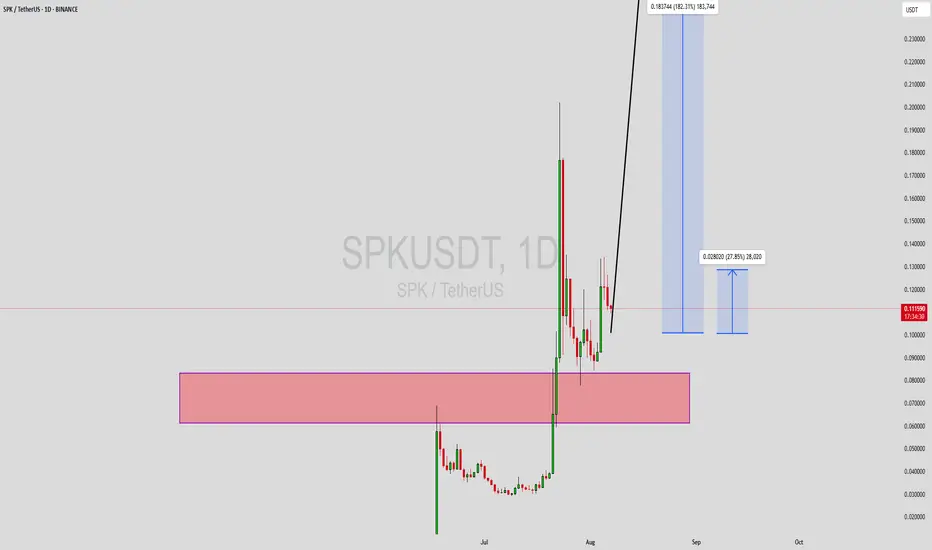
SPKUSDT Forming Bullish MomentumSPKUSDT is currently trading at a key support zone after a sharp correction, and this consolidation phase is creating a strong base for the next potential move. The chart suggests that the price has respected historical demand levels, which could trigger a powerful bullish rally once buyers regain control. With strong buying interest starting to build up, SPKUSDT has the potential to deliver an impressive 190% to 200%+ gain if momentum continues to align with technical signals.
The current setup reflects a classic accumulation pattern where smart money enters at discounted levels before the next breakout. Volume remains healthy, further supporting the possibility of an upside move. Once the price begins to lift from this support region, the momentum could accelerate quickly, pushing SPKUSDT towards higher resistance levels that align with its projected targets.
Investor confidence is growing around this project, and with the broader crypto market showing signs of recovery, SPKUSDT stands out as one of the coins with significant short-term growth potential. If the price successfully breaks above the consolidation zone with strength, it could trigger a wave of buying that drives the pair toward its next major resistance, making this a strong opportunity for bullish traders.
✅ Show your support by hitting the like button and
✅ Leaving a comment below! (What is You opinion about this Coin)
Your feedback and engagement keep me inspired to share more insightful market analysis with you!

SPK Market Update📊 INDEX:SPK Market Update
INDEX:SPK is now testing the red resistance zone 🔴 and showing signs of a potential Double Bottom pattern forming 📈
👉 If buyers achieve a confirmed breakout above resistance, this would validate the pattern and signal a bullish continuation ✅
⚠️ Until then, sellers may still defend this zone, so wait for clear confirmation before entering.

Spark · Corrections, Retraces, Sideways & Bull MarketSpark just entered the bearish zone but is having a reaction. On this chart we have a full 0.786 retracement. The action just moved below. SPKUSDT daily.
There was some volume 25-Aug, higher than average; then today again we are seeing a market reaction as a new low is hit after the late July major advance. Support will be found and established soon.
SPKUSDT can go sideways a little bit while forming the bottom. See the arrow working as cup pattern. In this sideways periods there are lots of price swings. New lows are possible or no new lows, makes no difference.
After the bullish wave there is a correction. After the correction the market consolidates, accumulation. The accumulation transitions into a new market phase, cycle or wave. Since SPKUSDT is already bullish, right now trading as a higher low compared to the last low, we can expect the market to resolve bullish once the accumulation phase is over.
As soon as support is hit, we can say the correction ends. There is always a period of sideways before a new wave of growth. In this type of chart setup, the sideways period can go for 1-3 months.
Namaste.

Long Swing on SPKUSDTExpecting a bullish trend reversal at 0.03772 price level. This might take a while to happen but limit order has been placed already.

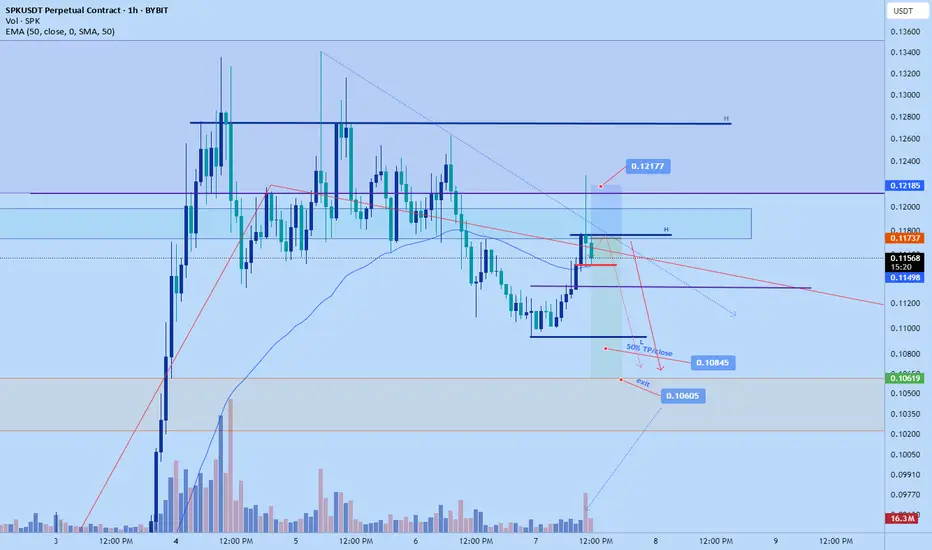
Spk short to $0.10605Recently opened a short on this. Just now started to push down a bit but still can possibly get 2RR or close with a bit tighter stop if interested
Tp1: 0.10845 area
Close: 0.10605
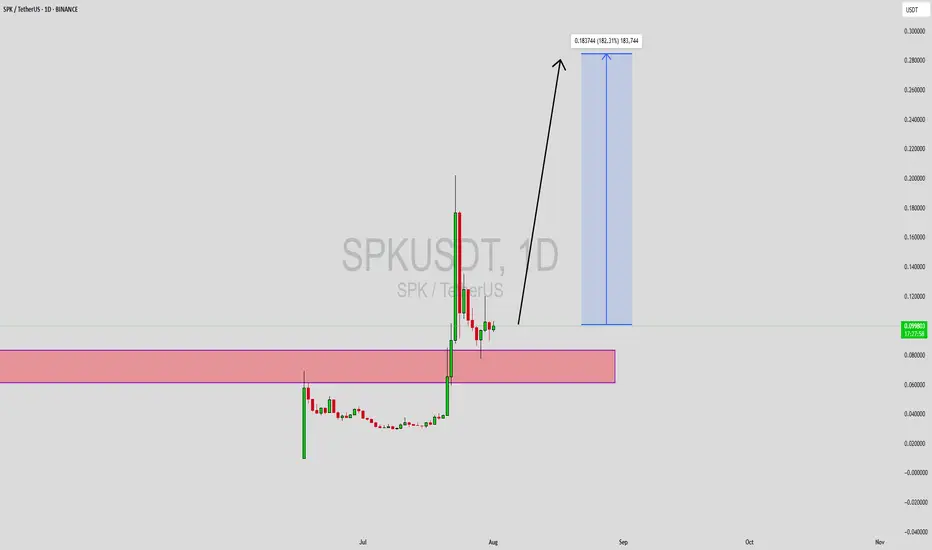
SPKUSDT Forming Bullish ContinuationSPKUSDT has recently emerged as a high-potential breakout candidate, catching the eye of many crypto traders and investors. The price action has shown remarkable strength after reclaiming and retesting a key demand zone, marked in red on the chart. Following this, SPK printed a strong impulsive move, suggesting renewed momentum and accumulation. With healthy volume flowing in and a supportive structure beneath, the coin appears ready to resume its bullish rally toward the projected 140% to 150% target area.
This technical setup signals strong bullish intent, especially as the market continues to favor altcoins with solid community interest and aggressive price behavior. The price is currently forming higher lows on the daily timeframe, and with a bullish continuation pattern unfolding, the potential for explosive upside becomes highly likely. Traders who understand market structure will note that this kind of compression above a support zone often leads to a sharp breakout.
SPK also benefits from growing investor attention, with increasing social mentions and trading volume supporting the upward momentum. While the broader market trends remain a factor, SPK's chart speaks for itself — the setup aligns with high-reward trading principles, and short-term price targets point toward significant gains. The immediate resistance lies far above the current levels, offering enough room for bulls to push price action higher.
Whether you are a trend-following trader or a breakout enthusiast, SPKUSDT presents a strong technical and sentiment-driven case for a bullish continuation.
✅ Show your support by hitting the like button and
✅ Leaving a comment below! (What is You opinion about this Coin)
Your feedback and engagement keep me inspired to share more insightful market analysis with you!
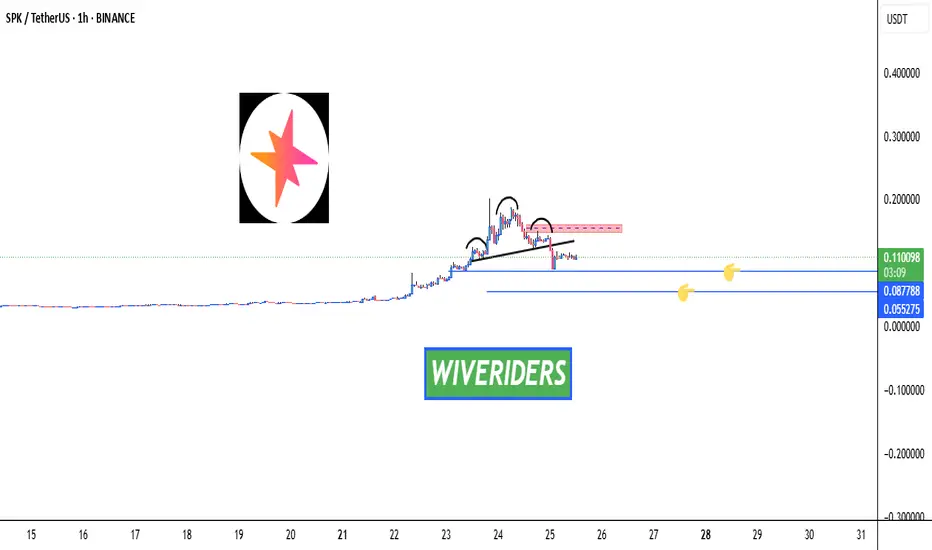
SPK : Does history repeat itself?Hello friends🙌
✅You see that once a pattern was formed and after the resistance was broken, we had a good growth.
✅Now the same pattern has formed again and the price is in the accumulation phase.
✅We have to see if history repeats itself and if the buyers support the price again or not.
✅We have obtained important support areas for you, so that if it falls, you can buy in steps and if the pattern breaks, you can buy in steps right here, of course with capital and risk management.
🔥Follow us for more signals🔥
*Trade safely with us*
SPKUSDT Forming Bullish ReversalSPKUSDT is currently showing signs of a strong bullish reversal pattern, positioning itself as one of the most technically attractive altcoins on the radar. After an extended downtrend, the price has found solid support at a key demand zone, which has historically acted as a base for significant rallies. The latest price action has formed a clear reversal structure, signaling a potential shift in momentum from sellers to buyers. This early signal of trend reversal is supported by increasing volume, indicating strong accumulation at lower levels.
This setup is gaining traction among traders and crypto investors who are beginning to take interest in SPK due to its attractive risk-to-reward ratio and potential for explosive gains. The expected move targets a 140% to 150% upside, which aligns with previous recovery waves observed in similar patterns. Technical indicators such as the RSI and MACD may also begin to align in favor of bulls, further supporting the thesis for a major trend reversal. This gives traders the confidence to anticipate a breakout rally in the coming weeks.
The fundamentals behind SPKUSDT are also gaining visibility, as the project's roadmap and utility continue to attract community attention. In the current market cycle, low-cap and mid-cap assets that show early reversal signs often outperform during recovery phases. With growing investor interest and a chart that supports a major move, SPKUSDT is a pair that deserves close monitoring. The breakout confirmation above recent resistance levels could act as a strong signal for the next upward leg.
This is a prime opportunity for swing and mid-term traders to take advantage of a potentially explosive move. With volume building and sentiment improving, SPKUSDT could be setting up for a rally that outpaces many other altcoins in the same category.
✅ Show your support by hitting the like button and
✅ Leaving a comment below! (What is You opinion about this Coin)
Your feedback and engagement keep me inspired to share more insightful market analysis with you!
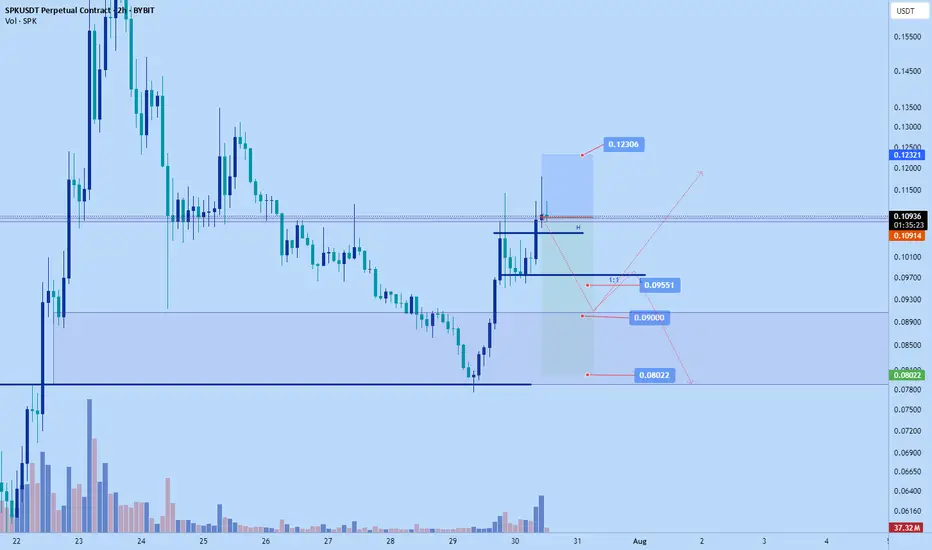
Bearish Retest Setup After BreakdownPrice broke down from the recent bounce and lost the 0.098–0.101 zone, which lined up with the 23.6–38.2 fibs. That area is now likely to act as resistance. Momentum is still bearish. MACD histogram is red and expanding, and no signs of reversal yet. On the daily timeframe, MACD has just started to cross bearish, which adds weight to the downside bias.
If price retests that 0.098–0.101 area and shows weakness (like rejection wicks or small-bodied candles), it’s a clean short opportunity. First target would be the recent low around 0.092, and if that breaks, the next key level is 0.077.
Any push above 0.102 would invalidate the setup for me.

SPK casual scalp short $0.09551 or lowerCasual spk short. Not according to trade plan. Reduced size and wide sl. Anticipating a correction down soon.
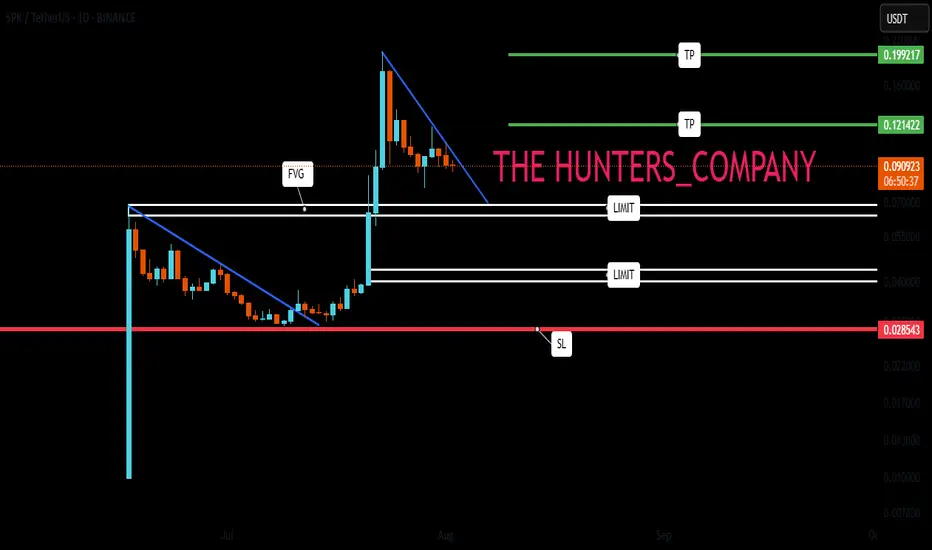
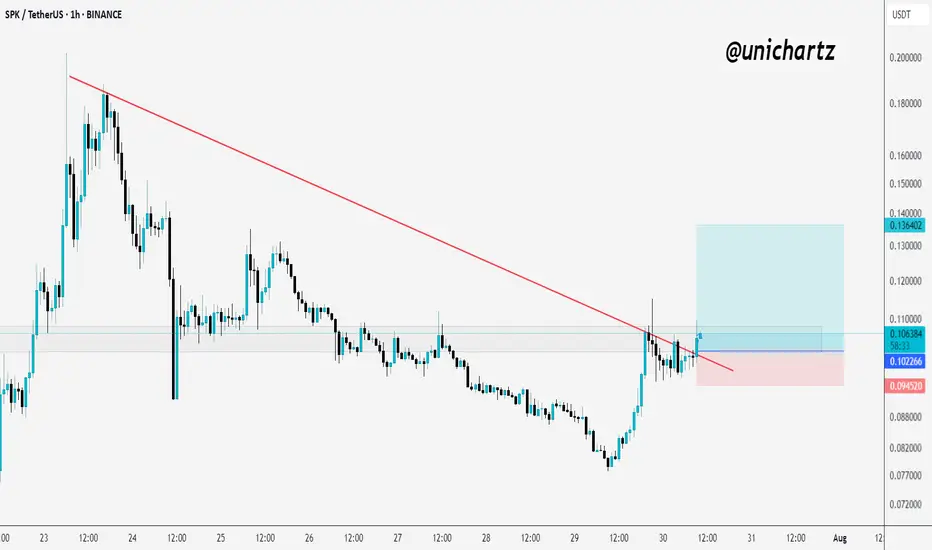
SPK Breaks Trendline – Long Setup with R:R 5.7INDEX:SPK Breaking the Downtrend – Long Setup in Play
SPK has finally broken out of its falling trendline after days of compression. Price is now testing the breakout zone with a small consolidation — a classic sign of strength building.
If momentum continues, we could see a solid upside push.
✅Trade Setup (Long):
Entry: 0.1009
Stop Loss: 0.0945
Target (TP1): 0.1364
DYOR, NFA
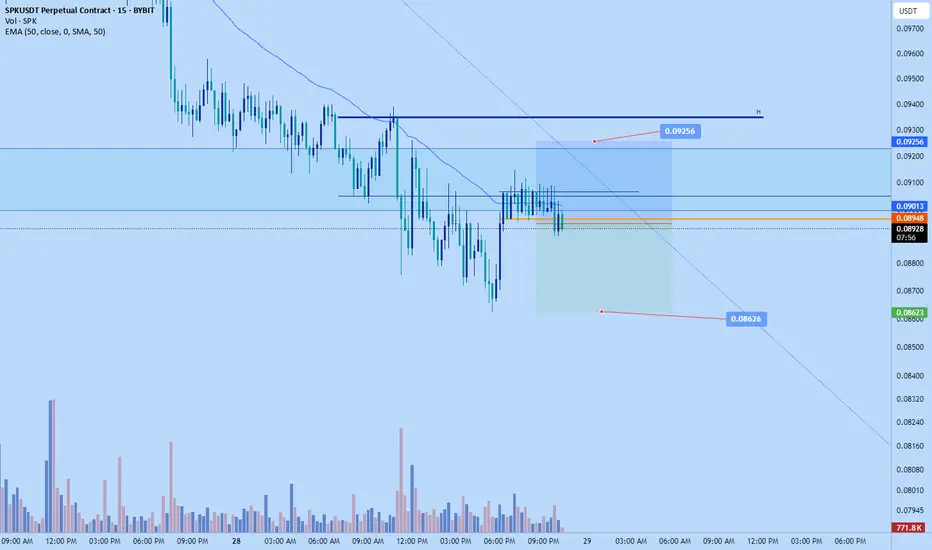
Spk 1:1 scalp short to $0.08626sl: $0.09256
TP: $0.08626
Just aiming for a quick LL play.
Time sensitive
SPK: Shrinking Bullish Momentum Confirms DowntrendSPK continues to show signs of weakening as the Elder-Ray Index reflects a steady decline in bullish momentum. While the indicator has consistently printed green bars—generally interpreted as a sign of buyer strength—their diminishing size over recent sessions tells a different story.
This contraction in bullish pressure suggests that buyers are gradually losing control, with each session offering less support for a price rebound. The indicator’s trend mirrors SPK’s broader market behavior, adding further weight to the token’s bearish outlook. Traders should remain cautious, as the fading strength from bulls reinforces the prevailing downtrend.

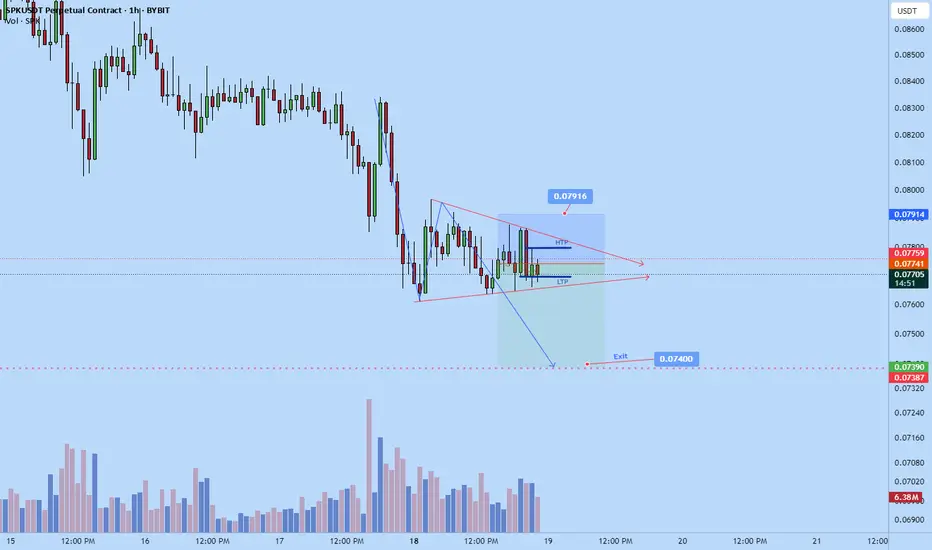
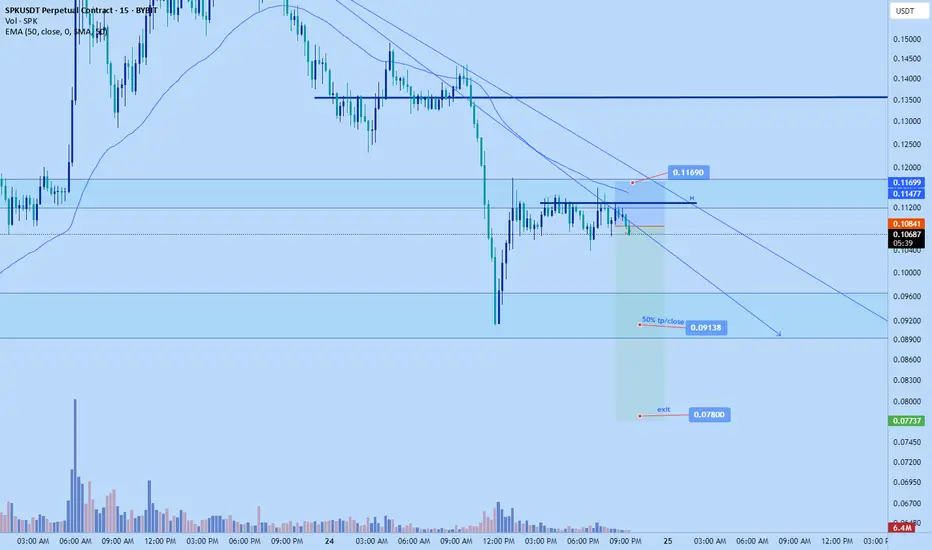
Spk short to $0.078Just recently opened up a short position on SPK. Targeting $0.078
|Scaling out at least 50% at 0.09138-*might full close depending on market reaction
Time sensitive
SPK Market Update – Key Levels Ahead 🚨 SPK Market Update – Key Levels Ahead 🔄📉📈
SPK previously formed a bearish Head and Shoulders pattern, which was confirmed by a breakdown. So, what’s next?
🔹 Option 1:
Price could move down to the two blue support levels — these zones may offer potential long entries, as buyers were active here before. Watch for confirmation! 👀
🔺 Option 2:
We also have a red resistance zone, located around the right shoulder of the H&S.
If INDEX:SPK breaks above this zone, it may signal the return of buyers and a potential bullish reversal.
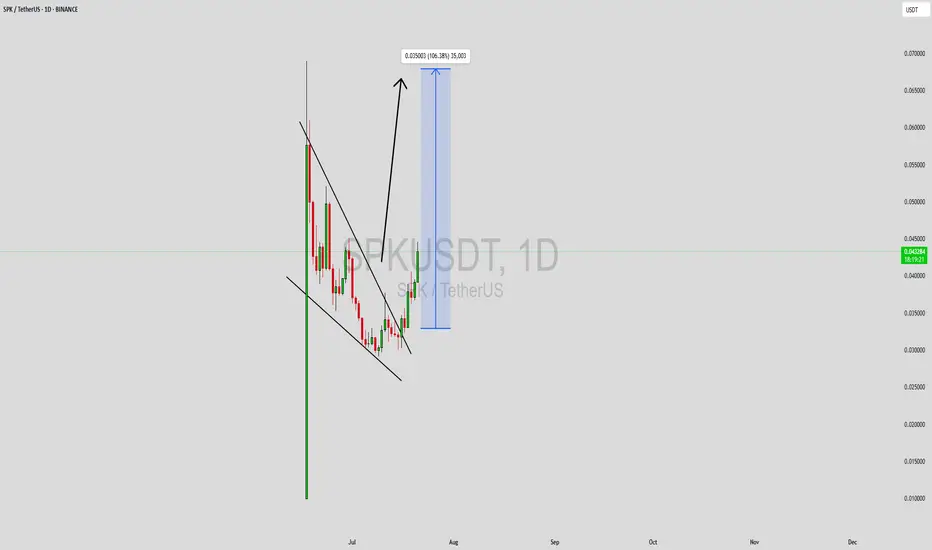
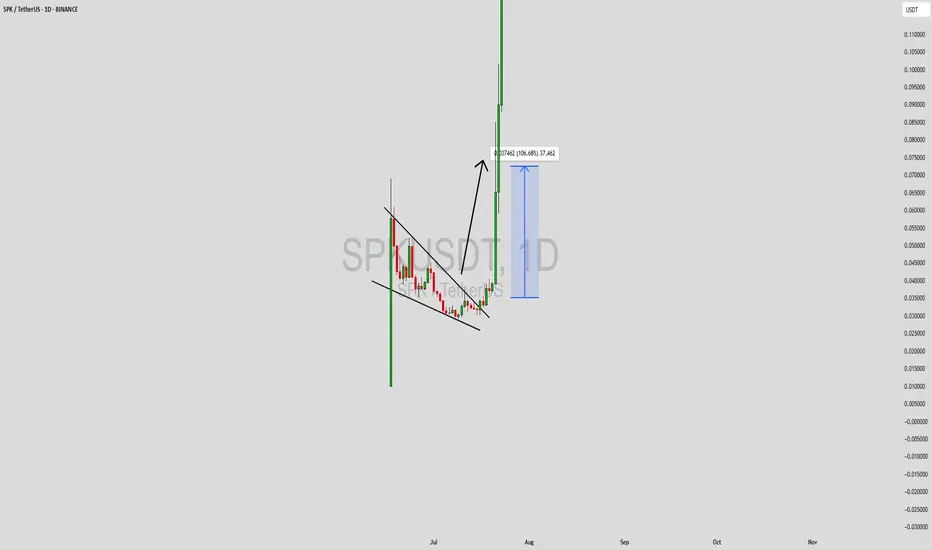
SPKUSDT Forming Falling WedgeSPKUSDT is currently forming a falling wedge pattern on the chart, a classic bullish reversal formation that often precedes a strong upward move. The narrowing of the wedge, combined with consistent price compression and steady volume, indicates that the asset is nearing a breakout point. Traders and technical analysts recognize this structure as a sign that selling pressure is losing strength, paving the way for a potential surge. The projected target aligns with a potential gain of 90% to 100%+, making SPKUSDT a high-reward opportunity for short- to mid-term crypto investors.
The falling wedge pattern typically signifies the end of a downtrend and the beginning of a new bullish cycle. As price action converges within the wedge, momentum often shifts once a breakout occurs to the upside with a strong volume spike. SPKUSDT has been building a solid base, and the market seems to be preparing for a shift in direction. Key resistance levels will need to be monitored, but the technical setup favors a bullish breakout in the near future.
What makes SPKUSDT even more compelling is the growing interest among retail and meme-focused investors. This token is beginning to gain traction across social platforms and trading circles, signaling increased demand and enthusiasm. With a supportive technical pattern and improving sentiment, this project may soon attract even more speculative momentum.
Given the current chart structure and favorable market signals, SPKUSDT is positioned as a breakout candidate worth watching. A confirmed wedge breakout could act as the catalyst for a major upside move, providing traders with strong potential returns.
✅ Show your support by hitting the like button and
✅ Leaving a comment below! (What is You opinion about this Coin)
Your feedback and engagement keep me inspired to share more insightful market analysis with you!
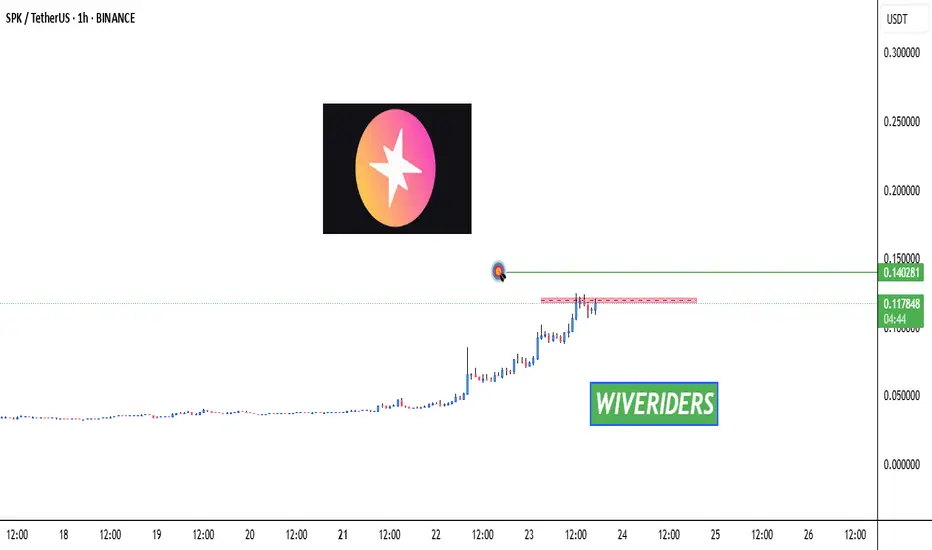
SPK Testing Red Resistance Zone 🚨 INDEX:SPK Testing Red Resistance Zone 🔴📈
INDEX:SPK is now testing the red resistance zone.
📊 Watch for breakout confirmation — if successful:
🎯 First Target → Green line level
This could signal the beginning of a new move up if buyers push through the resistance.
Let’s track it closely for a potential entry! 💼📈
SPK/USDTOver the past 16 days, SPK/USDT has formed a strong support base in the 0.029 – 0.032 zone. Buyers have gradually stepped in, with both price action and volume showing steady momentum, signaling accumulation. The pair is now pushing toward a breakout of the current range, suggesting bullish continuation is likely.
The green box marks an optimal entry zone within the support area, offering a favorable risk/reward setup for the next leg upward.

SPKUSDT Forming Falling WedgeSPKUSDT is currently forming a well-defined falling wedge pattern on the chart, a setup often associated with strong bullish reversals. This pattern suggests that the ongoing downward momentum is losing strength, and buyers may soon take control. The tightening price range within the wedge, combined with good volume activity, adds conviction to the breakout potential. Historically, such formations signal the end of a corrective phase and the beginning of an impulsive bullish wave, positioning SPK for a sharp upside move.
The technicals are aligning for a breakout with an expected gain of 90% to 100% or more. The confluence of strong support zones, oversold indicators, and increased trading volume points to growing investor confidence. Once SPK breaks above the wedge resistance with confirmation, it can trigger a significant rally, fueled by momentum traders and long-term investors entering the market. These conditions often attract attention across the crypto community, making SPK a high-potential short-term trade.
Market sentiment around SPK is also strengthening, with more traders discussing the project and its underlying fundamentals. As volume increases and the technical breakout setup matures, SPK could become one of the more explosive movers in the altcoin space. The falling wedge pattern’s reliability, combined with rising investor interest, makes this chart highly attractive for swing traders and breakout hunters alike.
✅ Show your support by hitting the like button and
✅ Leaving a comment below! (What is You opinion about this Coin)
Your feedback and engagement keep me inspired to share more insightful market analysis with you!