Gold trading plan!Gold is currently showing a descending triangle / bearish channel pattern on the 15-minute chart. After testing the upper trendline resistance around 4113–4115, price has started to reject, indicating potential downward pressure.
The trendlines show clear lower highs and lower lows, confirming a short-term bearish structure. Volume is also decreasing on upward moves, suggesting weakening buying momentum.
Trade Setup (Scalping / Intraday)
Signal: SELL XAU/USD below 4105
Entry Zone: 4105 – 4110
Target 1: 4050
Target 2: 3980
Stop Loss: 4135
Risk/Reward Ratio: ~1:2
Technical Indicators
Trendline Resistance: 4115
Support Zone: 4050 / 3980
Momentum: Bearish bias
Structure: Lower highs forming under descending resistance
Analyst View
Gold may continue its short-term correction phase if it fails to hold above the 4110 resistance zone. A breakout below 4100 could trigger a fresh wave of selling pressure targeting the 4050 area initially.
If bulls reclaim 4135, this analysis becomes invalid and could shift bias to neutral.
Trade ideas

GOLD | Rebounds Above $4,000 Ahead of Fed DecisionGOLD – MARKET OVERVIEW | Rebounds Above $4,000 Ahead of Fed Decision 🪙
Gold futures climbed back above $4,000, rebounding in early trade ahead of the Federal Reserve’s rate decision later today.
The metal gained around 1%, supported by expectations that the Fed will cut rates by 25 basis points, a move that typically boosts demand for non-yielding assets like gold.
Markets have already priced in the rate cut, leaving investors focused on Chair Powell’s comments for clues on whether another cut could follow in December.
Technical Outlook
Gold remains in a bullish momentum as long as the price trades above 4,011, targeting 4,053 initially.
A 1H or 15Min close above 4,053 would confirm further upside toward 4,104.
However, if the price reverses and stabilizes below 3,982, it would shift the bias to bearish, opening the way toward 3,930 → 3,893.
Key Technical Levels
Pivot Zone: 4,011 – 4,016
Resistance: 4,053 · 4,104 · 4,148
Support: 3,982 · 3,930 · 3,893
Outlook:
Gold stays bullish while above 4,011, with potential to extend gains toward 4,104 if the Fed delivers a dovish tone.
But if Powell’s remarks turn unexpectedly hawkish and price stabilizes below 3,982, a deeper pullback toward 3,930–3,893 could follow.

Correction over - new Annual High's in sightTechnical analysis: The Price-action hit the Daily chart’s Support belt and got rejected as expected near #3,888.80 - #3,892.80 and is currently pulling back on full-bodied Daily chart's candle. In my personal belief, decline was only be temporary as it was delivered in previous Bull runs however caution is required as the Weekly catalysts are still about to be reported (Fed or not, I continue Buying preserving my Bullish stance). Technically the newly formed Ascending Channel on Hourly 1 chart still has a Lower High’s to give around #4,027.80 mark before I re-evaluate the trend and continue soaring regarding the Short-term. As I mentioned throughout my remarks, Gold is Neutral now, turning Bullish as long as Gold closes the week above the #3,888.80 configuration which is far away currently. Selling sequence is limited or near exhaustion, however Gold not only succeeded in breaking the Resistance (#3,952.80 mark) with ease and almost tested second Resistance belt, but was also comfortably Trading above it. Needless to mention on the other side, Ascending Channel is intact due to the sharp Intra-day recovery on DX and uncertainty on all market classes. This outweighs the decline on Bond Yields market.
My position: I am Buying Gold aggressively throughout yesterday's session all along especially when #3,952.80 benchmark got invalidated to the upside. Gap to the downside on Asian market opening delivered excellent chances to Buy more as I closed all orders with #4,000.80 Take Profit. Keep in mind that I might Sell #4,024.80 now (aggressive Scalp to the downside) only to Buy more. #4,052.80 benchmark and #4,100.80 extension are my Targets.

continue to accumulate - sideways price zone 4000⭐️GOLDEN INFORMATION:
Gold (XAU/USD) drops toward $3,965 in early Asian trading on Monday, extending its decline as improved US–China relations lift global risk appetite. Traders now await the US ISM Manufacturing PMI data for October, due later in the day.
Last week, Presidents Donald Trump and Xi Jinping agreed to ease trade tensions, with the US reducing tariffs from 57% to 47% in exchange for China suspending rare earth export curbs and boosting US soybean imports. The positive trade outlook weakens safe-haven demand, pressuring Gold prices.
⭐️Personal comments NOVA:
Not much economic news - gold prices continue sideways at the beginning of the week. Large frame correction
⭐️SET UP GOLD PRICE:
🔥SELL GOLD zone: 4059 - 4061 SL 4066
TP1: $4050
TP2: $4040
TP3: $4020
🔥BUY GOLD zone: 3919 - 3917 SL 3912
TP1: $3928
TP2: $3940
TP3: $3955
⭐️Technical analysis:
Based on technical indicators EMA 34, EMA89 and support resistance areas to set up a reasonable sell order.
⭐️NOTE:
Note: Nova wishes traders to manage their capital well
- take the number of lots that match your capital
- Takeprofit equal to 4-6% of capital account
- Stoplose equal to 2-3% of capital account

GOLD | Consolidating Near Pivot, Awaiting Breakout GOLD | Consolidating Near Pivot, Awaiting Breakout
Gold is currently consolidating around the pivot zone at 3,982, as traders await fresh direction following recent volatility.
Momentum remains neutral-to-bearish, but a breakout from this range will define the next move, with volatility expected to rise ahead of upcoming U.S. data and Fed commentary.
Key Levels:
Pivot Line: 3,982
Resistance: 4,011 · 4,031 · 4,053
Support: 3,960 · 3,922 · 3,893
Trading Plan:
Sell Setup: Shorts valid below 3,982, targeting 3,960, and below it will get / 3,922 / 3,893.
Buy Setup: Longs valid only above 3,982, targeting 4,011 / 4,053.
Premium Takeaway
Gold is consolidating between 3,960–3,982, waiting for a decisive breakout.
A 15-minute close below 3,960 would confirm bearish continuation toward 3,922–3,893, while a close above 3,982 shifts bias to bullish, targeting 4,011–4,053

Interest Rate Decision Imminent!Key Events:
Federal Reserve Meeting: The Fed will announce its interest rate decision, with the market widely expecting a 25 basis point cut. A dovish signal from the Fed (such as hinting at further rate cuts) could boost gold prices; a cautious stance could put downward pressure on prices.
US-China Trade Situation: High-level officials from both countries have reached an agreement on a framework for a trade deal, and Trump will meet with Chinese officials today. Easing trade tensions have reduced safe-haven demand for gold, leading to a recent decline in prices.
Market Sentiment Shift: Risk appetite has increased, with major global stock indices (such as the S&P 500 and Nasdaq) hitting record highs, causing funds to flow from safe-haven assets like gold to risk assets.
Economic Data and Background:
US Economic Indicators: ADP weekly employment data showed modest growth in private sector employment (14,000 new jobs per week), but the consumer confidence index (94.6) slightly exceeded expectations. These data eased concerns about a recession, further suppressing gold prices.
Fund Flows: Gold ETF holdings decreased (e.g., SPDR holdings remained flat, iShares silver holdings declined significantly), indicating that speculative funds continued to reduce their long positions in gold, suggesting strong short-term bearish sentiment.
Long-Term Supporting Factors: Global central bank gold purchasing trends, geopolitical risks, and the Fed's interest rate cut cycle continue to support gold in the medium to long term. The London Bullion Market Association (LBMA) predicts that gold prices may rise to $4,980 in the next 12 months.
I. Price Movement Review:
Gold prices fell for three consecutive days, reaching a low of $3,886.51 on October 28, breaking below the key psychological level of $4,000, with a cumulative drop of over 10%. Technical selling and long position liquidation were the main reasons.
II. Key Technical Levels:
Support Levels:
Short-term: 3920-3900 (tested in Asian trading).
Strong Support: 3885-3880 (yesterday's low coincides with the 60-day moving average; a break below this level could lead to a test of $3,819). Resistance Levels:
Short-term: 3970-4000 (a break above could lead to 4030 USD).
Strong Resistance: 4086 (Second resistance level on the 4-hour chart).
III. Optimal Trading Strategy
Trend Judgment:
Short-term: Gold prices are suppressed by fundamentals (trade optimism + risk appetite), but the Fed decision may trigger a rebound. If gold prices stabilize above 4000, the trend will turn bullish; if they remain below 4000, a short-term top will form.
Medium-to-Long-Term: Pullbacks are considered healthy technical corrections, and central bank gold purchases and interest rate cuts support the long-term bullish logic.
Specific Trading Recommendations:
Long Strategy:
Entry Point: Light long position at 3950-3957 USD, or add to the position on dips at 3920-3900 USD.
Stop Loss: 3945 USD (if broken) or 3880 USD (below key support).
Target: 4000 USD (hold until 4030 USD if it breaks through).
Short Selling Strategy:
Entry Point: Sell short on a rebound to the $3970-$4000 range.
Stop Loss: Above $4005.
Target: $3920-$3900.
If the Fed is more dovish than expected, consider going long with a target of $4030; if hawkish, target $3880.
Risk Warning: Fed Chair Powell's speech and the outcome of the US-China meeting may trigger significant volatility. Avoid being heavily invested and affected by the volatility!

Gold/Copper Signaling Recession & Market Super bubble!We're continuing to see extreme signals from Gold, and that should raise concerns.
Earlier, I highlighted the Gold/Oil ratio — now, I want to draw your attention to the Gold/Copper ratio:
🔗
Historically, such extreme readings in the Gold/Copper ratio have consistently preceded recessions. The only exception? A period of economic stagnation and sideways markets — not exactly a bullish outcome. See the chart from 2014 to 2016
🔗 www.tradingview.com
Quick recap:
Gold = Fear + Inflation hedge
Copper = Economic strength + Inflation signal
Oil = Similar to Copper; reflects growth and inflation expectations
These divergences aren't random — they’re warning signs of a recession & market Super Bubble that's about to POP!
These are not random fluctuations of prices. You can choose to view them as such. I get it. But from a macroeconomic perspective, this is bad JUJU!
Capitalism without failure is like religion without hell! Remember that!
Click boost, like, and subscribe! Let's get to 5,000 followers! ))

Gold Intraday Trading Plan 11/3/2025As explained in my weekly post, I am bullish on gold right now. For today's setup, I will look for buying opportunities from 3965-3972. If the line in the chart holds, gold will form a bullish wedge, which is a sign of upward continuation. My target for today is 4128.

GOLD | Bearish Momentum Holds Below Pivot Zone GOLD | Bearish Momentum Holds Below Pivot Zone
Gold remains under bearish pressure as it trades below the pivot zone at 4,034–4,053, signaling continued weakness amid cautious sentiment ahead of upcoming U.S. data.
🕯 Momentum remains negative, but a breakout above the pivot zone could quickly shift the tone back to bullish.
Key Levels
Pivot Zone: 4,034 – 4,053
Resistance: 4,082 · 4,105 · 4,189
Support: 4,004 · 3,982 · 3,921
Trading Plan:
Sell Setup: Shorts valid below 4,038, targeting 4,004 / 3,982 / 3,921.
Buy Setup: Longs valid only above 4,053, targeting 4,105 / 4,152.
Premium Takeaway
Gold remains in bearish control below 4,053, with potential to drop toward 3,982–3,921.
A confirmed 1H close above 4,053 would shift bias to bullish, opening the path toward 4,105–4,189 in the short term.

Gold price recovers - resistance zone 4000⭐️GOLDEN INFORMATION:
Gold (XAU/USD) bounces from an Asian session low near $3,916, edging away from a three-week trough hit on Monday. The metal’s pullback from record highs appears to pause, though gains remain limited as traders await the Fed’s policy decision, with a rate cut widely expected on Wednesday.
⭐️Personal comments NOVA:
Gold prices are recovering, as the market is looking forward to today's FED interest rate cut, regaining the 4000 mark.
⭐️SET UP GOLD PRICE:
🔥SELL GOLD zone: 4050 - 4052 SL 4057
TP1: $4040
TP2: $4030
TP3: $4020
🔥BUY GOLD zone: 3886 - 3884 SL 3879
TP1: $3900
TP2: $3910
TP3: $3925
⭐️Technical analysis:
Based on technical indicators EMA 34, EMA89 and support resistance areas to set up a reasonable BUY order.
⭐️NOTE:
Note: Nova wishes traders to manage their capital well
- take the number of lots that match your capital
- Takeprofit equal to 4-6% of capital account
- Stoplose equal to 2-3% of capital account

XAUUSD BEARISH REVERSAL SETUP FROM SUPPLY ZONE🔍 Key Observations:
1. Market Structure Shift:
A Change of Character (CHoCH) has occurred near the upper boundary of the ascending channel.
This indicates a potential shift from bullish to bearish momentum.
2. Liquidity & Supply Zone:
The red zone near $4,044 – $4,018 acts as a supply zone or bearish order block.
Price has reacted from this level, rejecting higher prices.
3. Entry & Targets:
Entry: Around $4,011 – $4,018 (current zone)
Stop Loss: Above the recent high near $4,044
First Target (TP1): $3,977 – local liquidity zone
Second Target (TP2): $3,930 – $3,915 major demand area / imbalance fill zone
4. Channel Breakdown Potential:
If the price closes below the lower trendline of the ascending channel, a strong bearish continuation toward the lower targets is expected.
5. Smart Money Concept (SMC) View:
The chart aligns with liquidity grab above highs, followed by CHoCH, suggesting smart money selling pressure.
A retracement to premium zones has already happened, and distribution is likely underway.
📉 Bearish Outlook Summary:
Bias: Bearish
Entry Zone: 4,011 – 4,018
Stop Loss: 4,044
Target 1: 3,977
Target 2: 3,930 – 3,915
Invalidation: Break and close above 4,045 would negate bearish setup.

Gold is Ready For Bull From SupportHello Traders
In This Chart GOLD HOURLY Forex Forecast By FOREX PLANET
today Gold analysis 👆
🟢This Chart includes_ (GOLD market update)
🟢What is The Next Opportunity on GOLD Market
🟢how to Enter to the Valid Entry With Assurance Profit
This CHART is For Trader's that Want to Improve Their Technical Analysis Skills and Their Trading By Understanding How To Analyze The Market Using Multiple Timeframes and Understanding The Bigger Picture on the Charts

Gold will likely rocket to over $10,000...Gold will likely rocket to over $10,000...
Once it can breakout versus the US stock markets.

GOLD Will Go Down!HI,Traders !
#GOLD is making a
Bullish rebound after a
Bearish breakout but will soon hit a new
Horizontal resistance
Of 4038.09 from where
We will be expecting a
Further move down !
Comment and subscribe to help us grow !

Gold Bull Market Outlook And Targets: 5000 USD/7500 USDGold Bull Markets Long Term Overview and 2025 Market Update
________________________________________
🌊 Five-Wave Roadmap — Targets & Timing
• Wave 1 (2016–2020): From ~$1,050–1,200 to the COVID-era spike; established secular up-trend.
• Wave 2 (2020–2022): Consolidation/corrective pullback (~–20%).
• Wave 3 (2023–2025/26): Power leg to ATHs (current). Room to extend toward $4,200–$4,500 on flow surges before pausing.
• Wave 4 (2026, base case): Re-accumulation/consolidation ~12 months; likely range-bound –10% to –15% from the Wave-3 peak as institutional buying digests gains.
• Wave 5 (2027–2030/32): Final thrust to the cycle’s terminal zone:
– First objective: $5,000–$5,500 (consistent with 2026 Street “bull wave” scenarios).
– Terminal extension: $7,500–$8,000 by 2030–2032 (our desk’s stretch path if real yields stay muted, official-sector demand persists, and private capital rotation broadens).
Why Wave-4 can last ~12 months: prior secular bulls often paused for a full year near major breakouts while flows “change hands.” Expect lower realized vol, fading retail FOMO, and steady official accumulation to define the tape.
📈 Top 10 Stats of the Current Bull 2025
1. Price & ATHs: Spot ~$3.75–$3.79k; fresh ATH $3,790.82 on Sep 23, 2025.
2. 2025 YTD: Roughly +40–43% YTD
3. Central Banks: 1,045 t added in 2024 (later revised to ~1,086 t as lagged data came in). H1/Q1’25 tracking remained elevated.
4. ETF Flows: Back-to-back strong quarters; Q2’25 total demand 1,249 t, value US$132bn (+45% y/y) with ETFs instrumental.
5. Gold vs Equities: Gold ≈+40% vs S&P 500 ≈+13% total return YTD.
6. Jewelry Demand: Tonnage softened as prices surged; value at records (2024 down y/y; weakness persisted into H1’25).
7. Gold–Silver Ratio: ~85–88 (silver torque improving as it pushes into the mid-$40s).
8. Macro Link: Safe-haven bid + expected policy easing keep real-yield headwinds contained.
9. Technical: Confirmed 13-yr cup-and-handle breakout (Mar ’24) underpinning trend.
10. Street Forecasts: GS baseline $4,000 by mid-’26; bulled-up houses (HSBC/BofA) flag $4.9–$5.0k potential into 2026 if private/ETF rotation persists.
• This cycle is different: record central-bank buying + renewed ETF inflows + lower real rates = powerful tailwind.
• Price: Gold notched fresh ATHs this month (up to $3,790.82). 2025 is shaping up as the strongest year since the late 1970s.
• Relative: Gold is crushing equities YTD (≈+40% vs S&P 500 ≈+13% total return).
• Setup: A 13-year “cup-and-handle” breakout in 2024 kick-started the move.
• Outlook: Street base cases cluster near $4,000 by mid-’26; several houses now publish $4,900–$5,000 stretch targets into 2026 as flows accelerate.
________________________________________
🏆 Historic Gold Bull Markets — Timeline & Stats
1. 1968–1980 “Super Bull”
• Start/End: ~$35 → $850 (Jan 1980)
• Gain: ~2,330%
• Drivers: End of Bretton Woods, oil shocks, double-digit inflation, geopolitical stress.
• Drawdown: ~–45% (1974–1976) before the final blow-off run.
2. 1999–2011/12
• Start/Peak: ~$252 (1999) → ~$1,920 (2011–12)
• Gain: ~650%
• Drivers: Commodities supercycle, EM demand, USD weakness, GFC safe-haven bid.
3. 2016/2018–Present (The “CB-Led” Cycle)
• Start Zone: $1,050–$1,200 → New ATH $3,790 (Sep 2025)
• Gain: ~215–260% (depending on 2016 vs 2018 anchor)
• Drivers: Record central-bank accumulation, sticky inflation/low real rates, geopolitics; 2024 13-yr base breakout.
________________________________________
📊 At-A-Glance Comparison (Updated 2025)
Metric | 1968–80 Super Bull | 1999–2012 | 2016/18–2025 Current
🚀 Total Gain | ~2,330% | ~650% | ~215–260% (so far)
⏲️ Duration | 12 yrs | 13 yrs | 7–9 yrs (ongoing)
💔 Max Drawdown | ~–45% (’74–’76) | ~–30% (’08) | ~–20% (2022)
🏦 Main Buyer | Retail/Europe | Funds/EM | Central Banks
🏛️ Pattern | Secular parabolic | Cyclical ramps | 13-yr base → breakout (’24)
Notes: current-cycle characteristics validated by WGC demand trends & the 2024 technical breakout.
________________________________________
________________________________________
________________________________________
🔄 What Makes This Bull Different 2025 Edition
• 🏦 Central-Bank Dominance — Third consecutive 1k+ tonne year in 2024; 2025 is still tracking strong on a run-rate basis. This “sticky” demand is from price-insensitive reserve managers.
• ⚡ Faster Recoveries — Drawdowns are shallower/shorter vs the 1970s analog, consistent with a structural rather than speculative buyer base.
• 📈 Coexisting With Risk Assets — ATHs with equities positive YTD = macro hedge + diversification bid, not just “panic buying.”
• 📐 Structural Breakout — 13-yr base cleared in 2024; market now in multi-year price discovery.
________________________________________
🎯 Strategy Ideas 2025 & Beyond
• Buy/Hold on Dips: Stagger entries (DCA) into physical (allocated), ETFs (e.g., GLD/IAU), and quality miners/royalties.
• Prefer Physical/Allocated where counterparty risk matters; use ETFs for liquidity and tactical tilts.
Satellite/Leverage
• Silver & GSR Mean-Reversion: With GSR ~85–88, silver historically offers torque in up-legs. Pair with high-quality silver miners.
• Factor Tilt in Miners: Prioritize low AISC, strong balance sheets, reserve growth, rule-of-law jurisdictions; emphasize free-cash-flow yield and disciplined capex.
Risk-Management
• Define max drawdown per sleeve; pre-plan trims near parabolic extensions or if macro invalidates (e.g., real-yield spike).
• Use options overlays (collars on miners; long-dated calls on physical proxies) to shape payoff in Wave-3 late innings and Wave-4 digestion.
________________________________________
🧪 Reality Check: What Could Invalidate the Bull?
• Real yields + USD rip higher (sustained) → compress gold’s opportunity cost.
• Official-sector buying stalls (policy or FX-reserve shifts) → removes the anchor bid.
• Growth re-acceleration + faster-than-expected disinflation → weaker safe-haven + fewer rate cuts.
• Technical break: a persistent move below ~$3,600–3,700 would question Wave-3 extension and pull forward Wave-4.
________________________________________
🧭 Quick Reference Tables
🧾 Summary: Historic vs Current
Feature | 1968–80 | 1999–2012 | 2016/18–2025
Total Gain | ~2,330% | ~650% | ~215–260%
Duration | 12 yrs | 13 yrs | 7–9 yrs (ongoing)
Correction | ~–45% | ~–30% | ~–20% (’22)
Main Buyer | Retail/Europe | Funds/EM | Central Banks
Pattern | Parabolic | Cyclical | Cup & Handle → Secular
🧩 “If-This-Then-That” Playbook
• If real yields fall & CB buying persists → Ride trend / add on consolidations.
• If USD + real yields jump → Trim beta, keep core hedge.
• If GSR stays >80 with silver momentum → Overweight silver sleeve for torque.
________________________________________
🔚 Key Takeaways Updated
• Twin pillars: relentless official-sector demand + 2024 structural breakout.
• Base case: Street ~$3.7–4.0k by mid-’26 with upside to $4.5–5.0k on accelerated private/ETF rotation.
• Roadmap: Extend Wave-3 → Wave-4 re-accumulation (~12 months) → Wave-5 to $5,000–$5,500, then $7,500–$8,000 by 2030–2032 under favorable macro/flow dynamics.
• Operating stance: keep core, add on dips/sideways phases, manage beta and drawdowns proactively.

GOLD MARKET ANALYSIS AND COMMENTARY - [Nov 03 - Nov 07]This week, global OANDA:XAUUSD prices recorded their second consecutive weekly decline. Spot gold started the week at $4,104/oz, dropped to $3,886/oz at one point, and then recovered to around $4,000/oz.
In the coming week, gold prices may move sideways with no clear trend, requiring more time for accumulation.
If the price trades above the 4,045 resistance level, it may recover to 4,150, and a break above this level could push it toward 4,250.
However, if the price falls below 3,900, there is a risk of a sell-off, potentially dragging it down to around 3,750.
Notable technical levels are listed below.
Support: 3,750 – 3,900 USD
Resistance: 4,045 – 4,150 – 4,250 USD
SELL XAUUSD PRICE 4151 - 4149⚡️
↠↠ Stop Loss 4155
BUY XAUUSD PRICE 3899 - 3901⚡️
↠↠ Stop Loss 3895

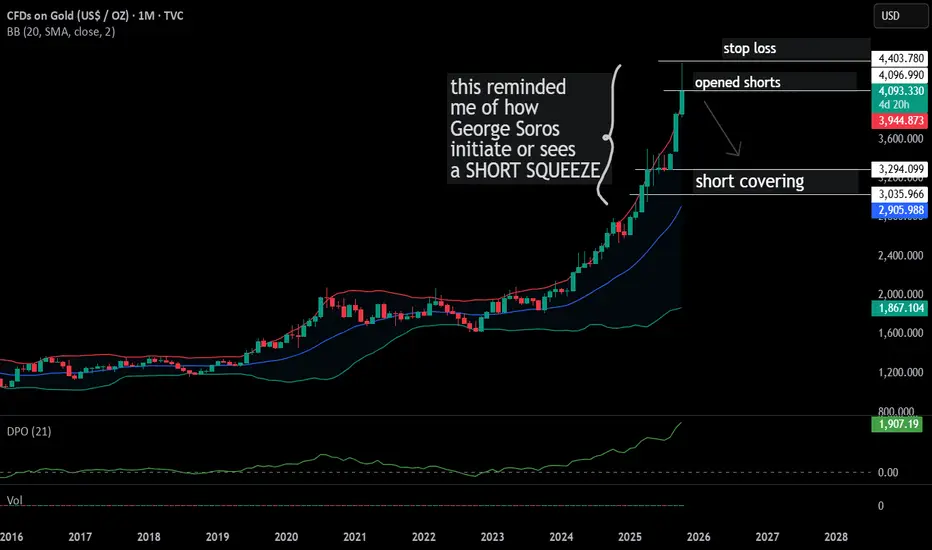
GOLD $4091 | a Short Position basic rule is when one sees a parabolic move
it's time to sell on the way up instead of aping in
difficult to contain fomo however
just have to pull t he trigger after a week of confirmation or red candle
the bounce should be opportunity to size up
and STOPS ha s to be higher
as you can get wicked ouot
XAUUSD Daily Outlook – Bearish Trend Still IntactGold (XAUUSD) has been moving in a clear bearish trend for the last two weeks, showing consistent lower highs and lower lows. Despite short-term pullbacks, the market continues to respect the downward structure as sellers remain in control.
The 4000/4020 level is acting as a strong resistance zone, and price rejection from this area confirms continuation toward 3895. Momentum and volume both support further downside movement.
KEY POINTS:
CURRENT PRICE: 3980
TARGET: LEVEL : 3935
TARGET LEVEL : 3895
RESISTANCE : 4000/ 4020

GOLD WEEKLY CHART MID/LONG TERM ROUTE MAPHey everyone,
Please check out our updated Weekly Chart Route Map, featuring updated revised key levels after completion of our last long term weekly chart idea for precise level-to-level tracking.
We’ve refreshed our long-term structure on the weekly chart. Price action recently rejected the 4294 level and is now range-bound between 4284 (resistance) and 4059 (support). This consolidation aligns with a detachment from the EMA5, highlighted on the chart with a circle. Even if a full detachment doesn’t materialize, a partial (halfway) correction remains the more probable scenario.
To determine the next directional move, we’ll need a decisive test and break of either boundary level. On the broader horizon, 3006 stands as the long-range pivotal swing zone, which may come into play if a major correction unfolds.
🔹 Note: The key distinction between a retracement range and a swing range is that swing ranges typically produce larger bounces and wider price reactions compared to standard retracement ranges.
We’ll continue to update this outlook throughout the week as the structure develops. Thank you all for your likes, comments and follows, we really appreciate it!
Mr Gold
GoldViewFX

GOLD | Daily Analysis #1 - 29 October 2025Hello and welcome back to DP
Today we’re excited to launch our Gold daily analysis series. We hope this new addition provides useful and practical insights for your trading decisions. Please support us with your follows and reactions — it really helps us grow!
Market Review:
After a strong bullish run over the past 2–3 weeks, gold finally started to correct from October 20, 2025, continuing its decline up until yesterday.
On the daily timeframe, we’ve identified:
• Support: 3,897
• Resistance: 4,155
Today’s trading session is particularly important as the Federal Reserve’s interest rate decision is due.
According to CME FedWatch, there’s about a 95% probability that the Fed will cut rates by 25 basis points.
Until the announcement, we may see choppy and sideways movement, but once the decision is released, expect a surge in volume and sharp “kangaroo” moves in both directions as traders react to the news.
1H–4H Technical Analysis:
As seen on the chart, 3,897 and 4,155 remain our key daily support and resistance zones.
• If price breaks above 4,012 and confirms the breakout, gold may extend higher toward 4,083 as the first upside target.
• On the other hand, if price drops below 3,974, it may continue falling toward the 3,897 support zone.
With the Fed’s rate decision approaching, expect increased volatility.
Whichever direction price confirms after the announcement could set the tone for gold’s next major move.
Trade cautiously, keep your stop-loss tight, and avoid chasing price during the initial volatility spike.
Disclaimer:
This content is for informational purposes only and does not constitute financial or investment advice. © DIBAPRISM
Amir D.Kohn

gold on sell reverse#XAUUSD price have breakout the 4000 price on retracement. Now we await for 2 times breakout below 4013 before selling.
Below 4013 sell on 2 times breakout, target 3986-3959, stop loss 4027.
Buying can be valid if the Fed rates gives something good.

XAUUSD: How Will Gold Prices Move Next?Fundamental approach:
- Trade Talks and Gold Sentiment:
Gold experienced a sharp correction after reaching record highs, primarily due to improving risk sentiment as optimism grew around US-China trade negotiations. Reports indicate that both nations have reached a preliminary framework agreement on export controls and tariffs, which is expected to ease geopolitical tensions and reduce demand for safe-haven assets, such as gold.
- Other Pressures: Fed Policy and the US Dollar:
The gold market is also reacting to expectations of a Fed rate cut. While a rate cut typically supports gold, the move is largely priced into the market. Recent steadiness in the US dollar, as well as the possibility of a less dovish stance from the Fed, has added further pressure. With traders focusing on upcoming policy signals and macroeconomic data, a "cut and pause" approach from the Fed could prompt continued profit-taking in gold.
- Outlook:
As long as US-China relations remain stable and central banks, especially the Fed, avoid surprising markets with additional dovish measures, XAUUSD may remain under pressure.
Technical approach:
- XAUUSD significantly declined to the support area of 3890-3950. The price is between both EMAs, indicating a shift to sideways movement.
- If XAUUSD breaches the support area, the price may decline to the next support level at 3720, which is confluenced with the 61.8% Fibonacci Extension.
- Conversely, remaining above the support area may prompt a retest of the next resistance at 4054.
Analysis by: Dat Tong, Senior Financial Markets Strategist at Exness

GOLD | Gains Capped by Trade Uncertainty and Fed ExpectationsGOLD – MARKET OUTLOOK | Gains Capped by Trade Uncertainty and Fed Expectations
Gold futures rose slightly but gains remain limited as investors assess the U.S.–China trade deal and potential Fed rate cuts.
Market sentiment stays cautious, with traders awaiting key U.S. data for direction.
Below 4,025: Bearish bias toward 3,982 → 3,960 → 3,921.
Above 4,025: Bullish recovery toward 4,053 → 4,104.
Pivot: 4,025
Support: 3,982 · 3,960 · 3,921
Resistance: 4,053 · 4,080 · 4,104
Gold remains bearish below 4,025, but a confirmed break above 4,053 could shift sentiment to bullish in the near term.
PREVIOUS IDEA:
