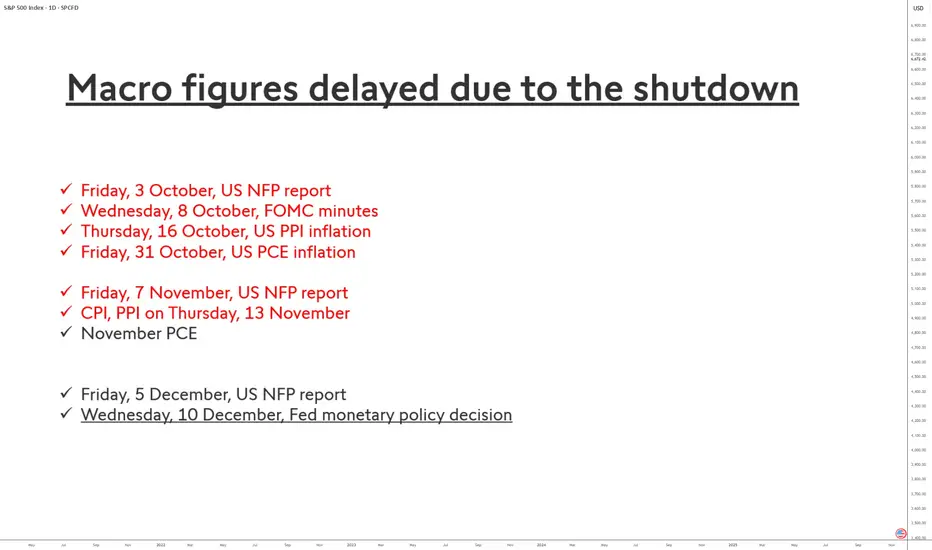
Imminent End of the U.S. Statistical Blackout!The prolonged shutdown of the U.S. federal government has had an exceptional impact on the release of some of the country’s most important economic statistics. Indicators such as the employment report (NFP), PCE inflation, or the CPI are the backbone of the Federal Reserve’s monetary policy and heavily influence financial market volatility. Their delay therefore creates a true statistical “black hole.”
Why are these indicators delayed?
Two federal agencies have been affected:
• the Bureau of Labor Statistics (BLS), responsible for NFP and CPI;
• the Bureau of Economic Analysis (BEA), which publishes PCE inflation as well as household income and spending data.
During the shutdown, these agencies had to suspend the collection, processing, and validation of data. Unlike a simple administrative pause, this disrupts complex statistical pipelines built on surveys of businesses and households. Some data cannot be “caught up” immediately because they depend on strict deadlines, which explains why certain series may be incomplete, revised late, or even canceled.
The case of Non-Farm Payrolls (NFP)
The October NFP report — normally released in early November — was entirely blocked. Signals from the BLS suggest that this report may be partially or totally compromised, especially the household survey, which is more difficult to reconstruct.
By contrast, the September report, which was also delayed, now has a confirmed publication date: Thursday, November 20, 2025.
For the October report, there is still no official date. The most likely estimates point to a possible release in late November or early December, provided the data quality is deemed acceptable.
The case of PCE inflation
The October PCE inflation figure — scheduled for October 31 — was also halted. The BEA announced it would revise its entire calendar but has not yet provided firm replacement dates.
Economists currently expect a publication around November 26, 2025, potentially in a partially “imputed” form (with statistical estimates filling missing data).
Market consequences
The absence of these key data forces investors and the Fed to navigate blindly. Volatility could remain elevated until the full or partial release of these indicators, which should gradually return to a normal schedule starting in December.
DISCLAIMER:
This content is intended for individuals who are familiar with financial markets and instruments and is for information purposes only. The presented idea (including market commentary, market data and observations) is not a work product of any research department of Swissquote or its affiliates. This material is intended to highlight market action and does not constitute investment, legal or tax advice. If you are a retail investor or lack experience in trading complex financial products, it is advisable to seek professional advice from licensed advisor before making any financial decisions.
This content is not intended to manipulate the market or encourage any specific financial behavior.
Swissquote makes no representation or warranty as to the quality, completeness, accuracy, comprehensiveness or non-infringement of such content. The views expressed are those of the consultant and are provided for educational purposes only. Any information provided relating to a product or market should not be construed as recommending an investment strategy or transaction. Past performance is not a guarantee of future results.
Swissquote and its employees and representatives shall in no event be held liable for any damages or losses arising directly or indirectly from decisions made on the basis of this content.
The use of any third-party brands or trademarks is for information only and does not imply endorsement by Swissquote, or that the trademark owner has authorised Swissquote to promote its products or services.
Swissquote is the marketing brand for the activities of Swissquote Bank Ltd (Switzerland) regulated by FINMA, Swissquote Capital Markets Limited regulated by CySEC (Cyprus), Swissquote Bank Europe SA (Luxembourg) regulated by the CSSF, Swissquote Ltd (UK) regulated by the FCA, Swissquote Financial Services (Malta) Ltd regulated by the Malta Financial Services Authority, Swissquote MEA Ltd. (UAE) regulated by the Dubai Financial Services Authority, Swissquote Pte Ltd (Singapore) regulated by the Monetary Authority of Singapore, Swissquote Asia Limited (Hong Kong) licensed by the Hong Kong Securities and Futures Commission (SFC) and Swissquote South Africa (Pty) Ltd supervised by the FSCA.
Products and services of Swissquote are only intended for those permitted to receive them under local law.
All investments carry a degree of risk. The risk of loss in trading or holding financial instruments can be substantial. The value of financial instruments, including but not limited to stocks, bonds, cryptocurrencies, and other assets, can fluctuate both upwards and downwards. There is a significant risk of financial loss when buying, selling, holding, staking, or investing in these instruments. SQBE makes no recommendations regarding any specific investment, transaction, or the use of any particular investment strategy.
CFDs are complex instruments and come with a high risk of losing money rapidly due to leverage. The vast majority of retail client accounts suffer capital losses when trading in CFDs. You should consider whether you understand how CFDs work and whether you can afford to take the high risk of losing your money.
Digital Assets are unregulated in most countries and consumer protection rules may not apply. As highly volatile speculative investments, Digital Assets are not suitable for investors without a high-risk tolerance. Make sure you understand each Digital Asset before you trade.
Cryptocurrencies are not considered legal tender in some jurisdictions and are subject to regulatory uncertainties.
The use of Internet-based systems can involve high risks, including, but not limited to, fraud, cyber-attacks, network and communication failures, as well as identity theft and phishing attacks related to crypto-assets.
Trade ideas
Artificial Intelligence & Tech Stocks Rally1. The Rise of AI as an Economic Catalyst
AI has shifted from being a futuristic concept to a real-world productivity enhancer. It now influences every major industry: financial services, healthcare, manufacturing, retail, cybersecurity, logistics, and more. Technologies such as deep learning, natural language processing, and autonomous systems have prompted companies worldwide to accelerate their digital transformation.
The introduction of large language models (LLMs), AI chips, robotics, and automation has created a new economic cycle driven by data, computing power, and algorithmic intelligence. As a result, companies directly involved in AI development—along with those supplying the hardware and cloud platforms—have become market favorites.
Investors increasingly view AI as the next “industrial revolution” capable of reshaping global productivity, profitability, and innovation. This belief has driven massive capital inflows into tech stocks, especially those perceived as leaders in AI research and commercialization.
2. Key Drivers Behind the AI-Fueled Tech Rally
A. Explosive Growth of Generative AI
The launch of advanced generative AI systems dramatically accelerated interest in AI stocks. Major companies quickly integrated generative AI into search engines, productivity tools, customer support, and software development workflows. This rapid adoption strengthened the revenue outlook for tech giants and reinforced investor confidence.
B. Demand for High-Performance Computing & AI Chips
Semiconductor companies, particularly those producing AI GPUs and specialized accelerators, have emerged as the backbone of the AI revolution. The massive need for computational power has pushed chip manufacturers to record valuations. Cloud service providers and hyperscale data centers are investing billions to upgrade their infrastructure to handle AI workloads.
C. Cloud Expansion & Software AI Integration
Tech firms integrating AI into their existing cloud and software offerings have seen rising subscription revenue and improved customer retention. The “AI upgrade cycle”—where businesses adopt AI features as part of cloud services—has enhanced long-term earnings visibility for cloud companies.
D. Automation & Productivity Gains
AI-driven automation is helping businesses improve productivity while reducing costs. Companies that demonstrate measurable efficiency gains from AI adoption are rewarded by investors, who view this as margin-expansion potential. As firms show better earnings due to AI-enabled efficiencies, market optimism increases.
E. Global Government Support
Governments worldwide are prioritizing AI policy, infrastructure, and innovation funding. This includes national AI strategies, incentives for semiconductor manufacturing, and investment in digital public infrastructure. These initiatives create favorable environments for AI-driven business growth, further strengthening investor sentiment.
3. Major Sectors Benefiting from the AI Rally
1. Semiconductor & Chip Manufacturing
AI requires enormous computing power, leading to unprecedented demand for GPUs, neural processing units (NPUs), and specialized chips. Semiconductor companies have seen massive revenue growth due to AI training and inference workloads.
2. Cloud Computing Platforms
AWS, Microsoft Azure, Google Cloud, and others are increasingly viewed as the “AI backbone” because they host AI models and provide infrastructure. Cloud giants benefit from scalable subscription revenue and enterprise AI spending.
3. Software as a Service (SaaS)
SaaS companies integrating AI into CRM, automation, analytics, and productivity tools are experiencing an upgrade cycle. New AI features allow them to charge premium subscription fees, boosting profitability.
4. Cybersecurity
AI-powered cybersecurity systems detect threats faster and manage huge volumes of data. With rising cybercrime, demand for AI-based security tools continues to expand.
5. Robotics & Automation
AI is powering industrial robotics, warehouse automation, and autonomous machinery. The increased demand for efficiency in logistics and manufacturing fuels revenue growth for automation firms.
6. Consumer Technology
AI is enhancing smartphones, smart home systems, wearables, and personal digital assistants. Tech companies adding AI capabilities have seen surging demand for next-generation devices.
4. Why Investors Are Bullish on AI's Long-Term Outlook
A. Multi-Trillion Dollar Market Potential
AI’s total addressable market (TAM) is expected to surpass trillions of dollars over the next decade. Analysts predict long-term growth across nearly every industry, making AI one of the largest commercial opportunities in history.
B. Continuous Innovation & Rapid Deployment
AI models and systems improve continuously. Every new innovation—smarter models, faster chips, more efficient algorithms—creates new commercial opportunities. This rapid pace of change fuels sustained investor enthusiasm.
C. Enterprise Adoption at Massive Scale
Companies across sectors are integrating AI into operations, decision-making, and customer experience. Enterprise adoption is one of the biggest drivers of long-term revenue growth for AI suppliers and service providers.
D. Network Effects & Data Advantages
Companies with massive data pools, extensive user bases, and strong computational capacity benefit from network effects. This creates “winner-take-most” dynamics favoring tech giants—which attract substantial investor capital.
5. Risks & Challenges to the AI Tech Rally
While the AI-driven rally is strong, it is not without risks:
1. Overvaluation Concerns
Some tech stocks have reached extremely high valuations. If earnings growth fails to match expectations, corrections may occur.
2. Supply Chain Constraints
AI hardware requires complex semiconductor supply chains. Shortages in advanced chips could impact production and revenue.
3. Regulatory & Ethical Uncertainty
Governments are increasing oversight over AI data use, privacy, and safety. Regulatory risks can affect growth prospects.
4. High Capital Expenditure
AI infrastructure—data centers, chips, cloud systems—is extremely expensive. Some companies may face profitability pressures due to high capex.
5. Competitive Intensity
AI markets are highly competitive. New entrants, rapid innovations, or pricing pressures could disrupt market leaders.
6. Future Outlook of AI & Tech Stocks
The long-term outlook for AI and tech remains highly positive. Over the next decade, AI is expected to shape global economic growth, productivity, and technological innovation. Key trends include:
Expansion of generative AI across enterprise workflows
Surge in demand for AI chips, data centers, and cloud computing
Growing adoption in healthcare, finance, logistics, education, and retail
AI-powered robotics reshaping manufacturing
Increased global investment in digital and computational infrastructure
Despite market volatility or occasional corrections, AI’s economic impact is expected to grow significantly, making AI and tech stocks central to modern global portfolios.

SPX Possibly Breaking SupportPreviously support held on this Higher Low, but it is now creating a bear trend by showing us a Lower High, and now breaking support to possibly create a Lower Low. Wait for a retest on the support which will act as resistance, or on the trendline for a low risk short entry. Feel free to drop your thoughts/opinions!

Megaphone Broadening Top Likely on SPXOver the last few months, the market has been increasingly difficult to trade as it searches for direction. Stop losses were triggered for longs on Oct 10, and shorts were equally liquidated on the run up beginning Oct 27th. What has formed is a broadening top, confirmed by two points of touch on each side of the pattern.
Broadening patterns can go in both directions, but supporting information suggests this is the end of the bull market:
On the weekly chart, there is a MACD cross.
There is a clearly defined 5 wave structure from the October 2022 bottom. It is a textbook example of Elliot Wave Theory.
Multiple analysts have shown that stock valuations are near historical extremes. It is highly likely that the market is in an AI bubble.
How am I trading this? I have sold all long positions. I am swinging puts that I will close out at the bottom of the megaphone. Once a breakout occurs, a pullback is highly likely to follow, even going so far as to return inside the pattern (60% of the time). If a pullback does occur, I'll load up on long dated puts to profit off a potential bear market.

SPX: Correction?SPX:
.
Correction?
Distribution forming pattern on Daily Timeframe- Head and Shoulder.
Wait for confirmation, upon breaking key important key level.
Wait and see!
.
US STOCKS- WALL STREET DREAM- LET'S THE MARKET SPEAK!

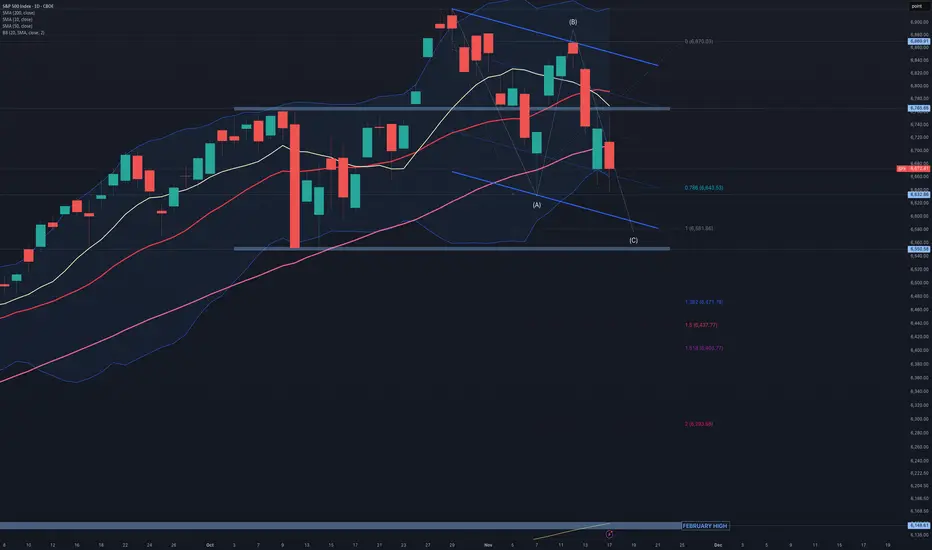
$SPX:Bearish technical indicators are accumulating:SPX: Bearish technical indicators are accumulating:
1) A sell signal on the MACD.
2) The RSI14 is at 42.
3) There has been a break below the 10, 20, and 50-period simple moving averages.
4) There is an inability to break above the horizontal resistance at 6765.
It is evident that the bullish momentum that followed the extremely bearish candlestick on October 10th has stalled, resulting in sideways trading with a slight downward trend. However, there is no immediate cause for concern since an underlying pressure is currently halting the decline.
At this point, we could expect a bullish flag pattern to emerge, which will be confirmed by the market's reaction to NVDA's results next Wednesday. The lower limit of the anticipated flag aligns with a 1x1 extension for wave (C). If the situation worsens and the flag is broken, it may transform into a zig-zag pattern, with extension targets for wave (C) indicated on the chart. Consider viewing this as an opportunity to enter a long position.
S&P anticipation for the 2025 ending It requires no many words to tell the trues.
I Think it might be double zigzag reaching at least 5800, in zone where 4th wave ending

SPX500 Breakdown Warning: Major Supports— Bigger Crash Ahead?The S&P 500 index ( SP:SPX ) has become increasingly significant recently, and it has a notable impact on cryptocurrency markets, especially Bitcoin ( BINANCE:BTCUSDT ). Therefore, analyzing the S&P 500 not only benefits its own market but also enhances our understanding of related markets.
Fundamental Analysis:
Volume confirms distribution, while the ongoing U.S. government shutdown delays critical data (CPI, PPI), fueling uncertainty and risk-off sentiment. Fed’s hawkish pause on rate cuts and tech sector rotation (TSLA -6%( NASDAQ:TSLA ), NVDA -3.5%( NASDAQ:NVDA )) reinforce bearish momentum. Also, YTD performance now -3.2% in November — on pace for the worst monthly drop since 2008 (-7.5%
Technical Analysis:
From a technical perspective, the S&P 500 index is breaking the Support zone($6,773_$6,710) and moving near the Support lines and 50_SMA(Daily) . Given recent data, there’s a possibility that these supports may break.
Additionally, according to Elliott Wave Theory , we can expect more corrective waves ahead.
I expect the SPX500 index to decline to $6,633 after the support cluster is broken in the first step.
First Target: $6,633
Second Target: $6,583
Stop Los(SL): $6,815
Please respect each other's ideas and express them politely if you agree or disagree.
S&P 500 Index Analyze (SPX500USD), 4-hour time frame.
Be sure to follow the updated ideas.
Do not forget to put a Stop loss for your positions (For every position you want to open).
Please follow your strategy and updates; this is just my Idea, and I will gladly see your ideas in this post.
Please do not forget the ✅' like '✅ button 🙏😊 & Share it with your friends; thanks, and Trade safe.

String rejection from support. pull back S&p500 LongStrong rejection from support. A good pullback expected in FRED:SP500

US500 - BEARISHEvening all!
Keeping it simple and short, the dollar is undervalued, and everything (indexes, crypto, precious metals) all melting up at the same time - im anticipating an end to 2025 that see's the dollar rise, and the melt up, melt down!
For US 500 - Target/draw on liquidity is the Weekly STL overall.

$SPX 1H – Bear Flag (Nov 17) $SP:SPX #SPX SP:SPX
After the dump off the late-October supply zone, SPX has formed a rising parallel channel that looks like a classic bear flag on the 1H. The pole is the leg from ~6,82x into the mid-6,64x flush; the flag is now a cleaner channel anchored off the post-spike higher lows and multiple swing highs.
Check 1h charts from Nov 13 and Nov 14
Price is currently riding the lower rail of the flag near 6,70x. A decisive 1H close below the channel and 6,70x would confirm a breakdown, opening room toward the 6,65x–6,64x demand zone and a potential measured-move extension. If instead we bounce and reclaim the upper rail (~6,77x–6,78x) and hold above it, the bear-flag idea weakens and this turns into a deeper mean-reversion squeeze rather than immediate continuation. #SPX

SPX 500: Stocks look heavy US stocks are testing their session lows with major indices looking heavy amid the unwinding of carry trades...
Concerns about Japan’s growing debt are intensifying. The government seems to be trying to have it both ways—implementing a massive fiscal stimulus package worth 17 trillion yen while opposing monetary policy normalization by the Bank of Japan. This conflicting stance has led to a sharp decline in the yen and bond prices, pushing Japanese yields higher. Markets now worry that the government is mishandling the economy, demanding higher returns to compensate for what they perceive as rising risk in holding Japanese debt.
So why does this matter for US stocks? The turbulence in Japanese markets may be triggering a carry trade unwind, similar to what happened in the summer of 2024. In a carry trade, investors borrow funds from countries with very low interest rates—like Japan—and invest them in higher-yielding assets such as stocks, gold, or cryptocurrencies denominated in stronger currencies like the U.S. dollar. As Japanese yields climb, the cost of maintaining these trades rises. With yields now becoming uncomfortably high, traders are being forced to reduce leveraged positions across markets, including US stocks.
By Fawad Razaqzada, market analyst with FOREX.com

SPX QuantSignals: Bullish Bias SPX QuantSignals Katy 1M Prediction 2025-11-17
Symbol: SPX
Price: 6706.78
Model: Katy AI 1M Prediction
Trend: Bullish
Confidence: 64.6%
🔮 Vision Summary
SPX maintains a bullish short-term structure, with the model projecting a move toward 6753.08 (+0.69%).
Momentum remains positive as long as price holds above 6700, with 30-minute targets signaling continued upward drift toward 6730.49.
Volatility remains moderate (27.3%), supporting steady trend continuation rather than sharp mean-reversion.
📈 Key Levels
Entry Zone: 6706.78
Upside Target: 6743.82 – 6753.08
Support / Invalidation: 6606.18
🧭 Vision Bias
Bullish — Model indicates upward continuation with controlled volatility and stable trend strength.
Break below 6700 weakens the signal; break below 6606 invalidates the forecast.

SPX weekly overview🔺 Chart Summary – Symmetrical Triangle + Key Levels
chart clearly shows a large symmetrical triangle forming on the SPX 1-hour timeframe:
1. Triangle Structure
Upper trendline (descending): Connecting the lower highs from the recent peak.
Lower trendline (ascending): Connecting higher lows from the last big dip.
Price is currently squeezing toward the apex, meaning volatility may contract before a bigger breakout move.
Resistance Levels
6750–6760 zone: Immediate resistance; price is struggling here.
6830–6860 zone: Major resistance cluster from previous swing highs.
Above that: Trendline resistance will be the next barrier.
Support Levels
6700–6710 zone: Very important short-term support.
6640–6650 zone: Stronger support; matches previous reaction lows.
6580–6600: Deeper support and bottom of the triangle approach.
4. Market Implication
Bullish: Break above the descending trendline + close above 6760 opens path toward 6830–6860.
Bearish: Break below the ascending trendline + close under 6640 opens path toward 6580 and further.
5. Overall View
The index is coiling inside a tightening triangle, meaning a major move is likely soon. Right now, SPX is in neutral-to-slightly-bearish territory until it reclaims the 6750–6760 zone.

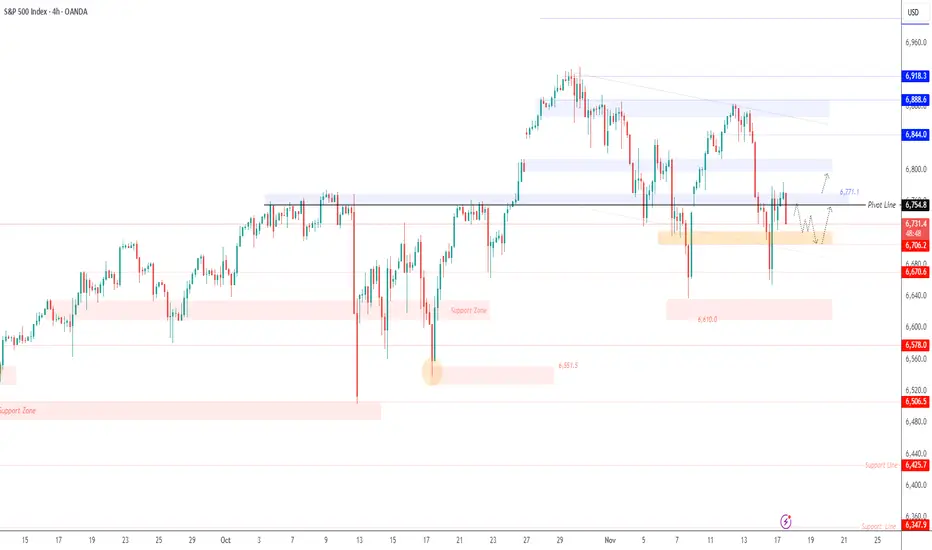
SPX500 | Key Levels Ahead of Nvidia EarningsSPX500 | Overview
U.S. stock futures edge higher as investors await Nvidia’s earnings report and delayed government data, which could provide clues about the economy and the Federal Reserve’s next policy steps.
Technically:
The SPX500 remains in a neutral-to-bearish zone, with direction depending on the upcoming 4H candle close.
A close below 6755 would confirm a bearish continuation toward 6706 and 6670.
However, a 4H close above 6769 would shift momentum to a bullish trend, targeting 6813 and 6838.
Pivot Line: 6754
Support: 6706 · 6670 · 6637
Resistance: 6770 · 6813 · 6838
Patience Is Needed: Traders, Stay SharpPatience Is Needed: Traders, Stay Sharp
This week kicks off with a flurry of market-moving events: Nvidia’s earnings, Alphabet’s Berkshire bump, and the long-awaited return of government data releases post-shutdown. Futures are green, optimism is stirring—but beneath the surface, the charts are whispering caution.
🔍 S&P 500 Technicals: A Mixed Bag
• The 55-day moving average remains intact. As long as it holds, the uptrend is technically alive.
• But weekly RSI divergence is flashing a warning—momentum isn’t confirming the highs.
• On the monthly chart, we’re at the top of a long-term channel dating back to 2009. Upside from here looks capped.
• And yes, we now have a triple divergence on the monthly RSI. That’s not noise—it’s a signal.
📊 Macro Meets Momentum
• The September jobs report lands Thursday, but expectations are muted. Private surveys already suggest a slowdown.
• Rate cut hopes have faded fast: traders now see a 56% chance of a Fed hold in December, down from 94% odds of a cut just a month ago.
🧠 What This Means for Traders We’re in a wait-and-see phase. No sell signal
We’re in a wait-and-see phase. No sell signal yet, but the setup demands discipline. The temptation to chase breakouts is strong—especially in AI and mega-cap tech—but the technicals say: patience is not just a virtue, it’s a strategy.
Let the data land. Watch the close. Respect the signals. not trading advice


SPX into Monday 17th NovemeberPrice rcoiling into resistance after a sell off that got a tad oversold.Lets see if the bulls have some power.?

SPX: Makes equities affordable againThe previous week was quite an interesting one on equity markets. A lot of swing movements, but the general trend was toward the downside, or a general correction. The weekly peak of the S&P 500 was at the level of 6.870, but the next two days were traded with a huge market correction. Futures on Friday were traded with a significant discount, when the market opened at 6.648. The dip buyers immediately stepped on the market, and managed to push the index toward the higher grounds, where the index closed the week at 6.734. Many analysts are questioning whether this Friday's move was pointing to the reverse of investors sentiment, or was it just a short term correction to the upside?
The week started with an interesting news that the SoftBank Group has sold its entire stake in Nvidia Corporation for around $5,8B, with aim to transfer these funds in AI investments, including OpenAI. Amazon shares jumped after it struck a $38 billion deal with OpenAI to provide AWS capacity, signalling strong demand for AI infrastructure. Apple reported strong earnings, with its services business growing significantly, helping it stay resilient even amid broader market worries.
Based on the previous week's market movements, it could be noted that broad-based profit-taking hit big tech as investors expressed renewed valuation concerns on AI-focused companies, with Nvidia, Microsoft, AMD, and others seeing notable declines. Meanwhile, analysts are closely watching capital-expenditure plans from major companies as these will test whether the current AI-driven rally is sustainable.

S&P500 H1 | Bearish Reaction off Key ResistanceMomentum: Bearish
Price is currently below the ichimoku cloud.
Sell entry: 6,839.11
- Strong pullback resistance
- 78.6% Fib retracement
- 161.8% Fib extension
Stop Loss: 6,881.31
- Swing high resistance
Take Profit: 6,770.32
- Pullback support
High Risk Investment Warning
Stratos Markets Limited (tradu.com/uk ), Stratos Europe Ltd (tradu.com/eu ):
CFDs are complex instruments and come with a high risk of losing money rapidly due to leverage. 70% of retail investor accounts lose money when trading CFDs with this provider. You should consider whether you understand how CFDs work and whether you can afford to take the high risk of losing your money.
Stratos Global LLC (tradu.com/en ): Losses can exceed deposits.
Please be advised that the information presented on TradingView is provided to Tradu (‘Company’, ‘we’) by a third-party provider (‘TFA Global Pte Ltd’). Please be reminded that you are solely responsible for the trading decisions on your account. Any information and/or content is intended entirely for research, educational and informational purposes only and does not constitute investment or consultation advice or investment strategy. The information is not tailored to the investment needs of any specific person and therefore does not involve a consideration of any of the investment objectives, financial situation or needs of any viewer that may receive it. Past performance is not a reliable indicator of future results. Actual results may differ materially from those anticipated in forward-looking or past performance statements. We assume no liability as to the accuracy or completeness of any of the information and/or content provided herein and the Company cannot be held responsible for any omission, mistake nor for any loss or damage including without limitation to any loss of profit which may arise from reliance on any information supplied by TFA Global Pte Ltd.

US500 slipped on AI-bubble fears and the Hawkish Fed
Stocks weakened last week as the Fed’s revived hawkish tone and mounting concerns over stretched AI valuations outweighed strong earnings from major AI names.
Despite upbeat 3Q results, fears of an AI bubble continued to build. AMD CEO Su highlighted insatiable demand for AI chips, projecting the data-center market to reach 1tln USD by 2030 and forecasting an average annual growth rate of 35% for AMD over the next five years.
Morgan Stanley warned of an impending power shortage within a year as AI expansion accelerates. while Microsoft CEO Nadella pointed out that the biggest bottleneck is not compute capacity but power, noting that parts of the company’s GPU inventory lack sufficient power connectivity.
US500 briefly retested the support at 6650 before rebounding. EMA21 has death-crossed EMA78, indicating a potential shift toward a bearish structure.
If US500 fails to close above the support at 6700, the index could retreat toward 6650. Conversely, if US500 breaches above both EMAs and the resistance at 6800, the index may advance toward the following resistance at 6920.

The U.S.–China Trade War1. Background: Why the Trade War Started
a. Massive Trade Imbalance
For decades, the United States imported far more goods from China than it exported. By 2017, the U.S. trade deficit with China exceeded $375 billion, which American policymakers viewed as evidence of unfair trading practices.
b. Intellectual Property (IP) Theft and Technology Transfer
U.S. companies complained that China forced foreign firms to share technology in exchange for market access. Additionally, the U.S. accused China of:
Stealing intellectual property through cyber intrusions
Subsidizing state-owned enterprises with cheap credit
Dumping low-cost goods in global markets
These practices, according to the U.S., distorted global competition.
c. China’s Rise as a Technological Power
China’s “Made in China 2025” strategy aimed to dominate high-tech industries such as robotics, AI, aerospace, and semiconductors. The U.S. viewed this as a threat to its long-term technological leadership.
d. National Security Concerns
American officials argued that Chinese tech companies like Huawei could pose espionage threats. The trade war soon blended with a tech war and a strategic rivalry.
2. The Escalation Phase: Tariffs and Counter-Tariffs
a. Initial U.S. Tariffs (2018)
The U.S. imposed tariffs on $50 billion worth of Chinese goods, targeting machinery, electronics, and industrial components. China responded with tariffs on American agricultural products like soybeans, pork, and dairy.
b. Expansion to Consumer Goods
As tensions escalated, the U.S. placed tariffs on an additional $200 billion worth of Chinese goods, including consumer items such as:
Furniture
Electronics
Clothing
Household items
China retaliated with tariffs on $60 billion of U.S. goods.
c. Final Wave and “Phase One Deal”
By late 2019, almost two-thirds of U.S.–China trade was under tariffs. In January 2020, both countries signed the Phase One Agreement, where China agreed to purchase more American goods and strengthen intellectual property protection. However, the deal did not address deeper structural issues.
3. Beyond Tariffs: The Technology and Investment War
a. Restrictions on Chinese Tech Firms
The U.S. restricted Huawei, ZTE, and other Chinese companies from accessing:
U.S. semiconductor technology
5G infrastructure equipment
Key software like Google services for Android
Huawei was placed on the “Entity List,” preventing American firms from supplying critical components.
b. Semiconductor War
Semiconductor technology became the center of conflict. The U.S. banned China from acquiring advanced chips and restricted chip manufacturing equipment from being exported to Chinese firms. This was aimed at slowing China’s progress in AI, quantum computing, and advanced communications.
c. Investment Restrictions
Both countries tightened rules on foreign investment:
The U.S. restricted Chinese investments in critical technologies.
China increased control over foreign companies through cybersecurity and data-security laws.
This created a decoupling of financial and technological systems.
4. Impact on China
a. Economic Slowdown
China’s export-led growth model faced challenges. Although China remained a major global exporter, companies diversified supply chains away from China toward countries like:
Vietnam
India
Bangladesh
Mexico
b. Pressure on Manufacturing and Technology
Restrictions on semiconductors severely affected high-tech sectors. China accelerated self-reliance strategies by investing heavily in domestic chip production and R&D.
c. Weakening Consumer Confidence and Capital Outflows
Uncertainty caused foreign investors to move capital out of China, affecting markets, real estate, and currency stability.
5. Impact on the United States
a. Higher Costs for Consumers
Tariffs on Chinese goods raised prices for U.S. households. Since many consumer electronics, clothing items, and household goods came from China, Americans faced higher inflationary pressure.
b. Pain for U.S. Farmers
China’s tariffs on American soybeans and agricultural products hit U.S. farmers hard. The U.S. government provided billions of dollars in subsidies to offset losses.
c. Supply Chain Disruptions
U.S. companies relying on Chinese manufacturing—such as Apple, automakers, and retail brands—faced rising production costs and logistical complexities.
d. Push for Manufacturing Reshoring
The U.S. government increased incentives to bring manufacturing back home or shift it to allied countries like Mexico, India, and Vietnam.
6. Global Impact: Redefining Global Supply Chains
a. Rise of “China+1” Strategy
Companies worldwide began reducing dependence on China by diversifying production. India, Vietnam, and Southeast Asia gained momentum as alternatives.
b. Fragmentation of Global Trade
The world economy became more regionalized:
U.S.-led trade blocs (USMCA, Indo-Pacific Economic Framework)
China-led initiatives (RCEP, Belt and Road Initiative)
c. Impact on Emerging Markets
Some countries benefited from shifting supply chains, while others faced instability due to global uncertainty.
d. Inflation and Global Slowdown
Tariffs increased global costs, contributing to inflation across multiple sectors such as electronics, textiles, and consumer goods.
7. Strategic Competition: Trade War → Tech War → Cold War 2.0
The conflict has transformed into a broader geopolitical rivalry. It now includes:
AI competition
Military modernization
Spy balloon and cyber espionage disputes
Competing global standards
Tech alliances and sanctions
Both nations are preparing for long-term strategic competition.
8. Current Status and Future Outlook
a. Tariffs Largely Remain
Despite leadership changes in the U.S., most tariffs are still in place.
b. De-risking, Not Full Decoupling
The world is moving toward reducing reliance on China without a complete separation.
c. Semiconductor restrictions will intensify
The chip war is expected to become the central battlefield for technological dominance.
d. Global trade order is shifting
The WTO’s influence is weakening as bilateral trade battles rise.
e. Possibility of Future Negotiations
Although tensions are high, economic interdependence means negotiations remain possible.
Conclusion
The U.S.–China trade war is far more than a dispute over tariffs. It is a historic economic and geopolitical struggle that reflects a deeper rivalry between the world’s two largest powers. What began as a disagreement over trade imbalances and intellectual property has expanded into technology, security, and global influence. Its ripple effects have transformed global supply chains, increased geopolitical divisions, and ushered in a new era of strategic competition. As both countries continue to assert their economic and technological ambitions, the trade war is likely to remain a defining feature of international relations for years to come.

S&P 500 Technical & Fundamental Outlook — Week of Nov 17–21 2025S&P 500 – 1H Technical Breakdown
Price is sitting inside a well-defined symmetrical wedge, created by a series of lower highs pressing down from above and higher lows building from below. The market has been tightening for several sessions, and it’s now approaching the point where volatility usually picks up.
Immediate resistance:
6,793 (intraday pivot)
6,845–6,860 (previous supply zone)
6,922 (major level above the wedge)
Key support:
6,705–6,675 (rising trendline support)
6,600
6,550 (broad structural support below)
The recent rejection off the upper trendline shows sellers are still defending that zone, but buyers continue to step in at higher lows. The structure is neutral overall, but it’s clearly coiling for a directional move.
Upside needs:
A clean break above the descending trendline and a push over 6,793 would open the door toward 6,845, with room toward 6,922 if momentum follows through.
Downside needs:
A breakdown under the rising support and a close below 6,675 exposes 6,600, with 6,550 as the next major area below.
Until one of those levels gives way, it’s just tightening inside the wedge.
S&P 500 – Fundamental Summary
The market spent most of the week stuck between mixed macro signals, Fed uncertainty, and a sharp rotation out of the AI/tech trade. Stocks initially bounced early in the week, but momentum faded after several Fed officials pushed back against expectations for a December rate cut. The government shutdown ending helped sentiment, but the delay in economic data releases kept visibility low and added to the hesitation.
Tech was the clear weak spot. A post from Michael Burry questioning hyperscaler spending, depreciation assumptions, and AI valuations triggered more profit-taking in the sector. His criticism—paired with his Palantir short—sparked debate and pulled money out of AI names for a second straight week. As tech cooled, leadership shifted toward defensive and value sectors like healthcare, staples, materials, and energy.
Looking ahead, Nvidia’s earnings on Wednesday are the biggest single catalyst. The market is treating it as a referendum on the entire AI theme: a strong report could reignite the trade, while weak guidance could deepen the recent rotation.
Outlook for Next Week
Major indices (SPX, COMP, NDX, SOX) are all testing their 50-day moving averages, and so far those levels are holding. That puts the market in position for a potential rebound early next week, especially given positive seasonality into late November and year-end performance chasing from fund managers.
One red flag: the VIX is elevated near 20 and not responding to Friday’s rebound. That kind of volatility behavior sometimes precedes another leg down.
House view:
Moderately bullish into the first half of next week as long as the indices hold above their 50-day moving averages. Nvidia’s results remain the wild card. A strong NVDA print likely sparks an AI rebound; a weak one likely drags the entire market lower.
Key Catalysts to Watch
1. Economic Data (finally resuming after shutdown delays)
Empire State Manufacturing
Industrial Production, Capacity Utilization
Housing Starts, Building Permits
Philly Fed Index
Jobless Claims
Michigan Consumer Sentiment
Delayed CPI and PPI reports should hit in early/mid-December.
2. Earnings
Major reports:
Nvidia (NVDA) – biggest market driver of the week
Home Depot (HD), Target (TGT), Walmart (WMT) – consumer spending
Palo Alto (PANW), Baidu (BIDU), PDD, NIO, TJX, XPeng, Intuit, Ross Stores
Retail earnings will give deeper insight into demand and holiday spending.
3. The Fed & Rates
Fed speakers turned notably more hawkish:
Mary Daly called a December cut “premature”
Raphael Bostic stressed inflation risk over labor softness
Susan Collins expects rates to stay steady “for some time”
As a result:
December rate-cut odds fell from 66% → 41%
Treasury yields ticked higher
The bond market is reassessing how much easing is realistic in 2025–2026
GDPNow remains strong at 4.0%, but the shutdown likely dents Q4 numbers.
Market Themes to Watch
Tech Rotation
High valuations + Burry commentary + earnings uncertainty = cooling off in tech and AI names.
AI Inflection Point
Nvidia will likely determine whether the recent pullback becomes:
A buying opportunity
or
The start of a deeper correction in the AI trade
Breadth Concerns
Fewer stocks are trading above their 50-day average—classic sign of a tiring rally.
Seasonality
Late November into December is historically strong, and funds that are underperforming may chase performance if NVDA reignites momentum.
Bottom Line
The market is at a pivotal spot:
Technical support is holding (50-day MAs).
Fundamentals are mixed but leaning positive if Nvidia delivers.
VIX is a risk factor that can’t be ignored.
If NVDA beats → risk-on, AI rebound, SPX likely pushes higher.
If NVDA disappoints → tech drags lower, SPX likely breaks support levels.
