BUY AND HOLD UNTIL OCTOBER 2025Price is scheduled to break above the current high for a 7-month run, price top is expected between 6588 and 6680 range for a steep correction. Tariffs and recession chants will have their day but history shows post war cycles never go south.
Trade safe, good luck
Trade ideas

S&P 500 Technical & Fundamental Outlook — Week of Nov 10–14 2025Price is pushing back into a key trendline / resistance zone after bouncing off 6,550–6,600 last week. This area between 6,780–6,830 is the decision point. We either break through and resume the trend higher, or this bounce gets sold into and we rotate back lower.
Key Levels
6,780–6,830: Main resistance. Trendline + prior structure. This is where direction gets decided.
6,922–6,940: If we break above the zone above, that’s the next upside target and potential trend continuation.
6,659: First downside support if price rejects this trendline.
6,550: Major support. If this goes, momentum shifts bearish.
Trend Context:
Bigger trend still leans bullish overall, but in the short-term price is still correcting until we reclaim and hold above the resistance zone.
Trade Path Scenarios
Upside:
A break and hold above 6,830 opens the move back toward 6,922 → 7,009. Best setup is buying the retest, not the breakout spike.
Downside:
If price rejects the 6,780–6,830 zone, look for a pullback toward 6,659.
Break 6,659 → continuation lower to 6,550.
Break 6,550 → bigger shift in structure and sentiment.
Macro This Week (U.S. Focus)
This is inflation week, meaning the market will likely be quieter early and then expand in volatility Thursday–Friday.
Day Focus
Wed FOMC Waller speaks — tone will matter
Thu CPI (core + headline) + Jobless Claims → Main market mover this week
Fri PPI + Retail Sales confirm or reject the CPI move
Key point:
Market direction this week will follow CPI first, then PPI / Retail for confirmation.
Current Market Tone
Market is still split: AI / tech strength vs weakness in broader sectors.
Last week’s pullback came from valuation pressure and softer labor tone.
Traders are waiting for confirmation on whether inflation is still cooling.
Breadth remains weak, meaning moves can be sharp once the trendline resolves.
Plan Going Into the Week
Wait for price to show its hand at 6,780–6,830.
Reaction Trade Bias
Hold above 6,830 Long toward 6,922 → 7,009
Reject at the zone Short back to 6,659
Break 6,659 Short continuation to 6,550
Break 6,550 Trend turns heavier to the downside supported by bearish news on growth

Evolution and Growth of the Hedge Fund Industry1. Origins of Hedge Funds (1940s–1960s)
The concept of hedge funds began in 1949 when Alfred Winslow Jones, a sociologist and financial journalist, launched the first modern hedge fund. Jones introduced the revolutionary idea of combining long and short positions to hedge against market fluctuations, aiming to reduce risk while maximizing returns. He also implemented performance-based fees, taking 20% of profits, a structure that became standard across the industry.
Jones’ approach—using leverage, short selling, and active management—distinguished his fund from traditional mutual funds, which were restricted by regulations and passive investment mandates. His strategy sought “absolute returns” regardless of market direction, laying the foundation for modern hedge fund philosophy.
Throughout the 1950s and 1960s, hedge funds remained relatively obscure, operating primarily as private partnerships for high-net-worth individuals. Their secrecy and exclusivity contributed to an aura of mystery that persists even today.
2. Expansion and Innovation (1970s–1980s)
The 1970s marked a period of economic volatility, including oil shocks, inflation, and market instability. These conditions provided fertile ground for hedge funds, which thrived on flexibility and alternative strategies. During this era, funds began to diversify beyond simple long-short equity plays into macro strategies, arbitrage, and event-driven investing.
The 1980s saw an acceleration of growth, largely driven by financial deregulation, advances in technology, and the rise of institutional investors. Hedge funds started attracting endowments and pension funds seeking diversification and higher returns. Managers like George Soros and Julian Robertson became iconic figures. Soros’ Quantum Fund famously made $1 billion by shorting the British pound in 1992, an event that showcased the power of hedge funds in global finance.
Hedge funds also began to operate across borders, benefiting from globalization and the liberalization of capital markets. Their ability to move swiftly in and out of markets made them powerful players in global finance, influencing currencies, interest rates, and stock indices.
3. Institutionalization and Mainstream Growth (1990s)
The 1990s were a turning point when hedge funds transitioned from exclusive private partnerships into an institutionalized investment industry. Large investors—such as university endowments, foundations, and pension funds—began allocating significant capital to hedge funds as part of diversified portfolios.
The proliferation of new strategies defined this decade. Hedge funds expanded into convertible arbitrage, fixed income arbitrage, global macro, distressed securities, and emerging markets. This diversification not only attracted new investors but also mitigated risks by spreading exposure across multiple asset classes.
The 1990s also brought increased attention to hedge funds’ impact on financial markets. The collapse of Long-Term Capital Management (LTCM) in 1998 highlighted both the sophistication and fragility of hedge fund strategies. LTCM’s use of massive leverage and complex derivatives led to a near-systemic crisis when markets turned against it. The U.S. Federal Reserve intervened to organize a bailout, illustrating hedge funds’ growing systemic importance.
Despite this setback, the industry continued to grow. Hedge funds became symbols of financial innovation and intellectual talent, often recruiting PhDs, mathematicians, and computer scientists to develop quantitative and algorithmic models that enhanced investment precision.
4. The Boom Years (2000–2007)
The early 2000s were the golden age of hedge funds. The industry’s assets under management (AUM) grew exponentially—from around $500 billion in 2000 to over $2 trillion by 2007. This growth was fueled by several factors:
Market turbulence following the dot-com crash increased demand for non-traditional investments.
Low interest rates and easy credit encouraged the use of leverage.
Institutional acceptance expanded, with funds-of-funds acting as intermediaries for smaller investors.
Globalization and technology enabled sophisticated strategies across markets and asset classes.
Hedge fund managers such as John Paulson, Ray Dalio, and David Einhorn became household names, with funds generating outsized returns. The diversity of strategies—from statistical arbitrage to credit default swaps—helped hedge funds outperform traditional asset classes.
However, the industry’s success also brought scrutiny. Critics argued that high fees, secrecy, and leverage created systemic risks. Regulators began exploring ways to increase transparency and oversight.
5. The Global Financial Crisis and Aftermath (2008–2012)
The 2008 global financial crisis was a defining moment for the hedge fund industry. Many funds suffered significant losses due to market collapses and liquidity freezes. However, hedge funds fared better than traditional asset managers overall, as their flexible strategies allowed quicker adaptation to market turmoil.
The crisis reshaped the industry in several ways:
Regulatory oversight increased, particularly through the Dodd-Frank Act in the U.S., which mandated registration, disclosure, and risk reporting.
Investor demands shifted toward transparency, liquidity, and risk management.
Fund closures and consolidations occurred as smaller or over-leveraged funds failed to recover.
Despite short-term setbacks, the post-crisis period laid the groundwork for a more stable, professionalized, and transparent hedge fund ecosystem.
6. Maturity and Technological Transformation (2013–Present)
In the 2010s and beyond, the hedge fund industry entered a mature phase marked by both stability and competition. Assets under management exceeded $4 trillion globally, with thousands of funds operating across diverse strategies.
The rise of quantitative funds and machine learning-driven strategies revolutionized the landscape. Firms like Renaissance Technologies, Two Sigma, and AQR Capital Management demonstrated how big data, artificial intelligence, and algorithmic trading could generate alpha with minimal human intervention.
Simultaneously, hedge funds faced new challenges:
Fee pressure due to underperformance relative to benchmarks.
Competition from passive investing (ETFs and index funds).
Demand for ESG (Environmental, Social, and Governance) integration as investors prioritized sustainability.
Regulatory constraints and increased compliance costs in multiple jurisdictions.
Yet, hedge funds continued to evolve. Many adopted hybrid models, blending traditional discretionary investing with automated systems. Others expanded into private credit, venture capital, and digital assets, reflecting their adaptive DNA.
7. Globalization and the Future Outlook
Today, hedge funds are an integral part of the global financial ecosystem. They operate across continents—from New York and London to Singapore and Hong Kong—serving a diverse investor base that includes sovereign wealth funds, pension funds, and family offices.
The future of hedge funds lies in innovation and adaptability. Artificial intelligence, blockchain, and decentralized finance (DeFi) are expected to reshape strategies, data analytics, and operational efficiency. Moreover, the increasing focus on sustainability and impact investing suggests a new generation of “green hedge funds” that align profit motives with ethical imperatives.
While traditional hedge fund models may face fee compression and rising competition, the industry’s agility ensures its relevance. The drive for alpha generation, risk diversification, and strategic flexibility remains the cornerstone of hedge fund success.
Conclusion
The evolution of the hedge fund industry—from Alfred Winslow Jones’ experimental partnership in 1949 to today’s global network of multi-strategy investment giants—illustrates a story of innovation, resilience, and adaptability. Each era brought unique challenges and transformations, from the intellectual revolution of long-short strategies to the data-driven frontiers of algorithmic trading.
Despite cyclical setbacks, hedge funds have consistently evolved to meet changing market conditions and investor demands. Their journey underscores a central truth: the pursuit of absolute returns and risk-adjusted performance will always attract investors seeking to outpace the market. The hedge fund industry, now a mature yet dynamic force, continues to shape the future of global finance—balancing secrecy with sophistication, and innovation with responsibility.

SPX about to come crashing down hard. Buckle up.The parabolic growth curve that started almost 30 years ago in the US stock market is about to come to a dramatic conclusion.
We saw a test example of what happened in April when the market for the first time in 27 years broke through the parabolic growth curve, how quickly things just fell apart. Falling more than 10% in just a few days and then sharply rebounding to reclaim the parabolic growth curve.
Well, get prepared for an even more disorderly crash about to hit the market. We are for the second time in a year, right now losing the parabolic ascent.
No one actually believes the US economy is growing parabolically right? Even viruses don't achieve this level of "growth".
It's all built on a phony baloney house of cards called the US Dollar backed by nothing but the "full faith and credit" of the US. Well guess what? The credit of the US is constantly being downgraded by bond rating agencies. And we elected a leader who destroyed every other countries' faith in us. Consider poor Canada and the faith they have in us now. You might laugh and think these kinds of things are silly, but I promise you it's deadly serious. We have NOTHING but hot air backing the US dollar now because we have no faith and our credit is in the dumpster.
Also for comparison sake, I included the angle of growth (copy and pasted the small yellow line) that we had in the "raging" 1990s bull market. If you were alive during that time, the market was truly considered raging. But compare the angle of ascent to the last 6 months since Taco trump announced his worldwide agenda to destroy the US. The angle of ascent is almost pornographic compared to the 90s rager.
Parabolas don't unwind. They crash.
What other confluence do we have in the indicators to prior year crashes?
1) VIX 8day RSI achieved its lowest ever stochastic %D this summer, numbers 2 and 3 were 2007 and 2000.
2) P/E ratios are the highest they have ever been at 40+, only exceeded by one other time +44, just before the dot com crash.
3) 2y 10 y bond yield differential maintaining above .42% like every prior recessionary crash.

$SPX: THIS PULLBACK FEELS DIFFERENTSP:SPX : Clearly, the bulls knew they couldn't allow a weekly close below the 10-week simple moving average, and they succeeded. Therefore, technically, the medium-term trend remains bullish. However, next week they must overcome the bearish connotations of the previous weekly Doji, which still linger. To do this, they need at least a weekly inside candle to counter the bearish attack, similar to the engulfing candle that formed four weeks ago and in mid-April. The stakes are high, and we'll see who comes on top. The RSI continues to show negative divergence and a narrowing range. My bet is bullish at the start of the week and then roll over (The risk is of a lower high until proven otherwise)

SPX 7000 by 11-20-2025Hello Traders,
Well the bull market continues. We just got done with a nice dip that bounced mid day Friday which appears to be a bottom. We also appear to have a bottom in BTC. I expect us to hit 7000 by 11-20-25..and could go higher before it consolidates into the next Fed decision but the direction is up.... The bull market continues... stay tuned!

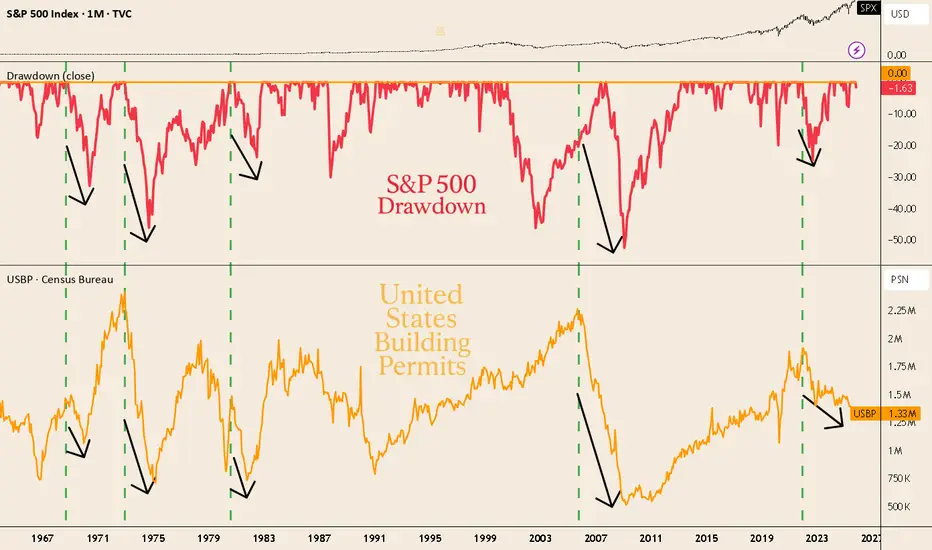
Building Permits: the silent warning behind market cyclesU.S. Building Permits have historically acted as a leading indicator of economic slowdowns.
Each time construction activity cooled — in the 1970s, 2007, and again post-2021 — deep S&P 500 drawdowns followed shortly after.
Today, permits have fallen to 1.33M (−2.3%), while the S&P 500 remains near all-time highs with a minor −1.6% drawdown.
📊 Historically, this kind of divergence doesn’t last long.
When the real economy starts to weaken, the market usually follows.
👉 The housing cycle whispers before the market screams.
SPX Digests the Highs SPX spent the last week and a half digesting the new all-time high, pulling back deeper than I expected but holding the weekly trend. Price found support at 6,632 and closed back inside the yellow zone where we’ve seen noise before.
This week I’m watching for one of these scenarios: a sideways reset that drifts higher, a cleaner rebound through the moving averages, or a retest of support with a possible shakeout toward 6,555 (weekly chart shows support for this so it could also be a positive week followed by a decline).
The broader uptrend structure is still intact, and I still have a bullish bias, but I will be more attentive of a retest and roll over. We declined about 4% from the ATH but have easily declined around 8% -10% on earlier digestions this year.

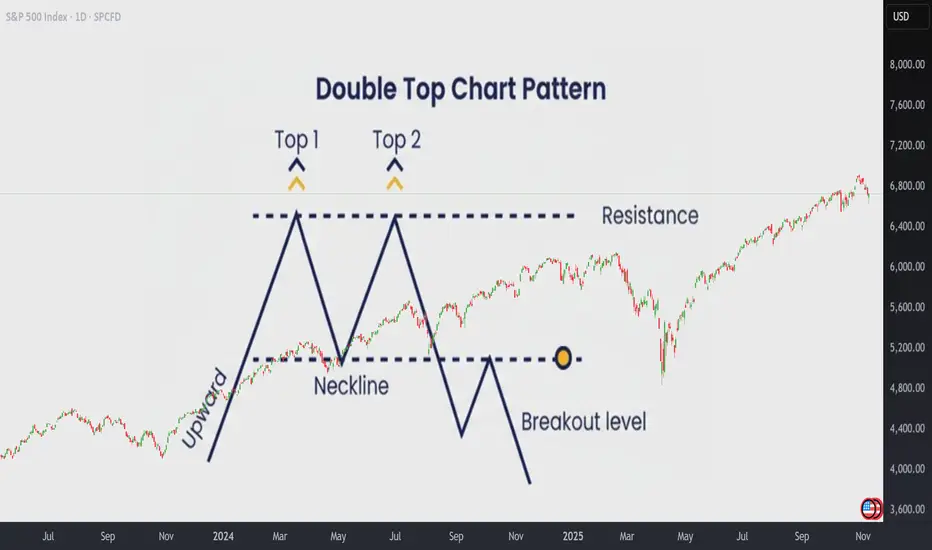
How to Trade the Double Top Pattern Like a ProHow to Trade the Double Top Pattern Like a Pro
The Double Top is one of the most reliable patterns in technical analysis. It often marks the beginning of a resistance zone and signals that bullish momentum is losing strength.
The first top is hard to anticipate, it’s usually just a continuation of the existing rally. But when the second top fails to break above the previous high, that’s when things get interesting . This failure creates a resistance level, and it’s the first warning sign that buyers may be running out of steam.
🔵 Why Do Double Tops Form?
There are usually two main reasons why a Double Top appears:
Profit-taking after a strong rally.Bulls start to lock in profits, causing the momentum to fade.
Lack of new buyers . Demand weakens, and bears begin to take control gradually.
Learning to tell which case you’re facing can help you decide whether it’s a great buying opportunity during a healthy pullback, or a signal to take profits, or even go short .
🧭 Step 1: How to Identify a Real Double Top
Before trading it, make sure it’s a true Double Top:
- Both peaks must form after a strong upward move . If the market was falling before, it’s not a classic pattern.
- The two tops should be at almost the same price level (no more than a 0.5% difference).
- The most important part is the neckline , the lowest point between the two tops.
That neckline defines whether the move is just a healthy pullback or the beginning of a new downtrend.
If the neckline doesn’t break, there is no Double Top yet.
The pattern is only confirmed after the neckline breaks downward.
💥 Step 2: Trading the Pattern
There are three main scenarios to understand:
1️⃣ A Confirmed Double Top (Breaks Down)
When the neckline breaks, the market often drops about 61.8% of the pattern’s height, with a probability above 70%.
A small pullback to retest the neckline is possible, but usually, the price won’t return to the previous highs.
A Double Top is spotted:
The neckline is broken:
A decline happens sharply:
2️⃣ A Fake Double Top (Break Fails)
If the price fails to break the neckline and instead makes new highs, it’s not a real Double Top.
This typically means we’re in a profit-taking phase, not a trend reversal.
In these cases, it’s often best to stay out, as the market tends to move sideways or show mixed signals.
A spotted double Top:
Fails to break down, instead breaks up:
The rally unfolds:
3️⃣ A Double Top Trap in a Strong Bull Market
Sometimes, a small break below the neckline triggers stops before the price explodes higher again.
These are common during powerful bull runs.
A spotted double Top:
The neckline is broken:
Inmediately the price reverse and break upwards.
The price rallies:
💲 Real Double Tops:
Theory is simportant, but let's go real!
A Double Top is now unfolding in Microsoft , and as you can see the neckline is almost there! Is this a signal? Wil a fake breakout occur? Are we witnesing the end of AI rally?
And some previous Double Tops:
❗ A final recommendation
Tradingview offers a great indicato r to Spot Double Top patterns easily.
Once you are in a chart, click on indicators and search Double Top Chart Pattern indicator. It's only for paid users and works fine!
Take a look how it spots the Double Top pattern and also gives you and idea of the posible target price!
Or the current one in NASDAQ:MSFT
In short:
Double Tops work roughly 70% of the time , but context matters.
They perform best in sideways or slowing markets, and are less reliable in strong rallies , where false breaks can easily trap traders.
Always confirm the neckline break, watch for volume, and never forget:
A pattern is just a probability, not a guarantee.
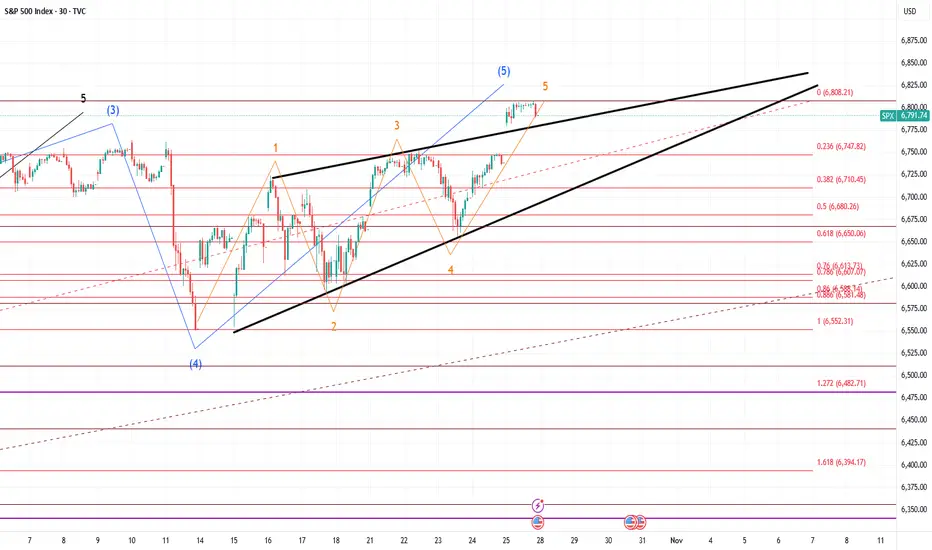
Up for SPX500USDHi traders,
Last week SPX500USD made a bigger correction down which invalidated my wavecount.
On Friday evening it started an impulsive move up.
So next week we could see more (corrective or impulsive) upside for this pair.
Let's see what the market does and react.
Trade idea: Wait for a correction down on a lower timeframe. After a change in orderflow to bullish you could trade longs.
This shared post is only my point of view on what could be the next move in this pair based on my technical analysis.
But I react and trade on what I see in the chart, not what I've predicted or expect.
Don't be emotional, just trade your plan!
Eduwave

sp500 4h🔹 Overall Outlook and Potential Price Movements
In the charts above, we have outlined the overall outlook and possible price movement paths.
As shown, each analysis highlights a key support or resistance zone near the current market price. The market’s reaction to these zones — whether a breakout or rejection — will likely determine the next direction of the price toward the specified levels.
⚠️ Important Note:
The purpose of these trading perspectives is to identify key upcoming price levels and assess potential market reactions. The provided analyses are not trading signals in any way.
✅ Recommendation for Use:
To make effective use of these analyses, it is advised to manually draw the marked zones on your chart. Then, on the 15-minute time frame, monitor the candlestick behavior and look for valid entry triggers before making any trading decisions.

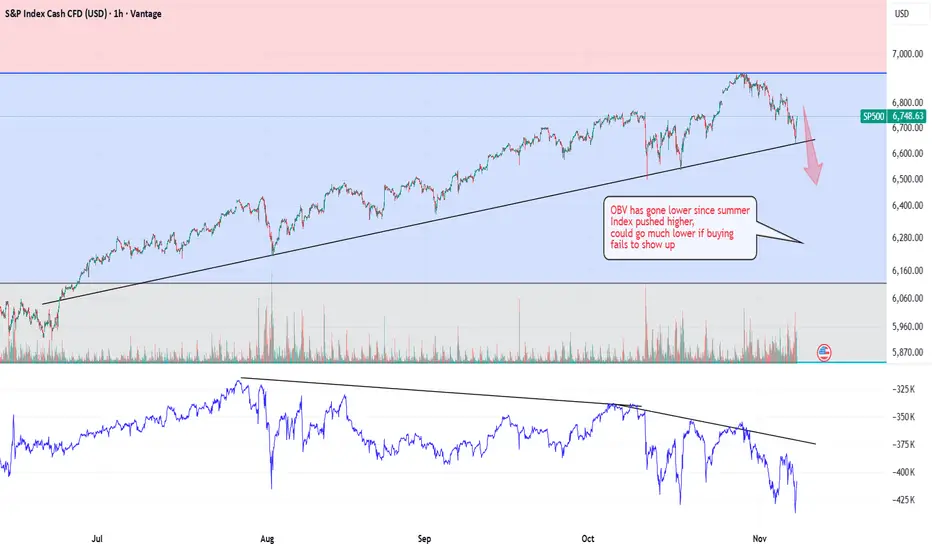
SP500 is weak about to drop through trend line Fib 1.618 madeBearish set up, (following on from my other post where the price at the top of the market hit a fix 1.618 extension of the prior recent down move almost to the tick, which I told people about before it happened as a great potential inflection point) Yes I am short.
The trendline must hold for the bulls,
The OBV on balance volume suggests weakness in the index
Suggesting the trend line will not hold for long, unless buying comes in
Next stop back will be lower, most likely with bear market rallies
I think we will test 4800 again between now and end of next year.
If a sell off starts it could be extreme, the market is weak.
There are hardly any bears left, mutual funds have minimal cash on side lines left to buy.
Government shutdown in USA has woken people up to having not everything in the markets and need cash on hand to pay bills if they dont get paid by Government.
We are only down 4% from a potential top, imagine selling the top within 4% in a few years time that will be acceptable for most traders. Even as a hedge and to bank some of those gains.
If it turns out to be a top, just sell a few contacts each few until you build up a nice sized position. Watch out for bear market rallies. Ifs a bear they will be super sharp upside, and then you can sell them at size. Look back historically to see how much these bear market rallies rise,
I notice that you can draw a nice downside trend line in a bear market and just sell every time the price hits that trend line to be very well off if it turns out to be a bear. not advice only fictional trading, of those that work hard at trading to make theirs and others dreams come true. Be grateful that you saw this now and took the time to understand the risks and potential gains because it could change your life
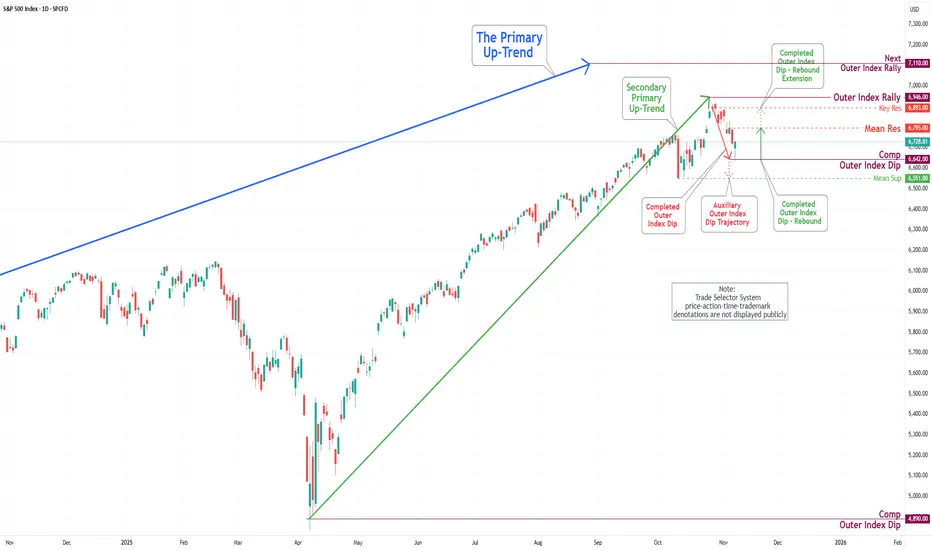
S&P 500 Daily Chart Analysis For Week of Nov 7, 2025Technical Analysis and Outlook:
During the recent trading session, the S&P 500 Index experienced a notable decline, underscoring the significance of our key target, situated at the Mean Support level of 6,740. The index has now completed the Outer Index Dip at 6,642. This positioning indicates the potential for further upward movement, with the target established at the Mean Resistance level of 6,795. The prevailing trend suggests a well-structured extension towards the Key Resistance level of 6,893, with an ultimate target for the Outer Index Rally set at 7,110.
Nevertheless, it is crucial to acknowledge the possibility of a substantial drawdown in the forthcoming week’s trading session. This may lead to a retest of the Outer Index Dip at 6,642, possibly resulting in a further decline to the Mean Support level at 6,551 before ultimately resuming an upward trajectory.
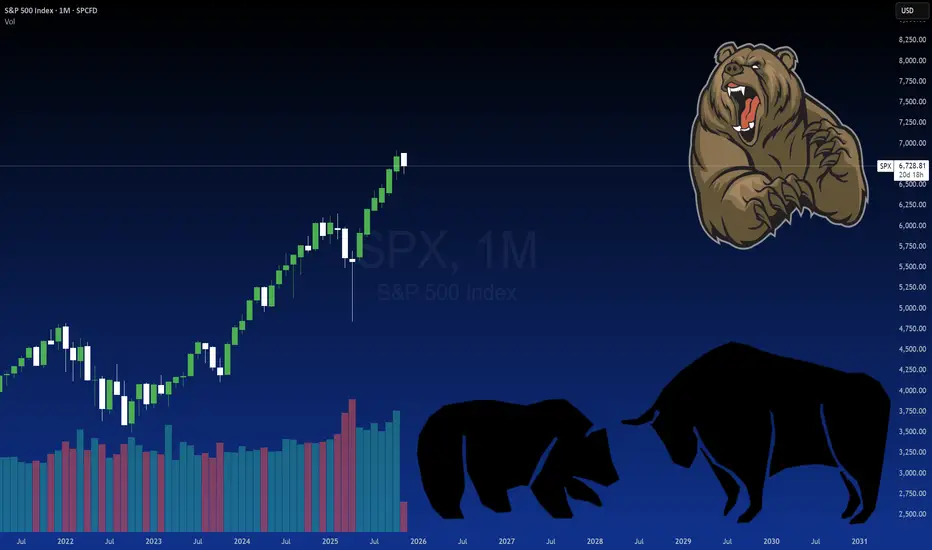
S&P 500 — The Market Cycle Nears Its Turning PointS&P 500 Technical Outlook — The Market Cycle Nears Its Turning Point
Market Overview
The S&P 500 Index continues to follow its recurring market cycle pattern, which typically spans around 10–12 months.
After an impressive rally since mid-2024 that pushed the index to a new high near 6,900, early signs now suggest that the market may be entering the late stage of its uptrend cycle.
Momentum indicators have started to weaken, and profit-taking pressure is emerging — both of which are common signals seen before a mid-cycle correction phase begins.
Technical Analysis
1. Major Trend
The yellow trend lines highlight two major upward waves in this cycle.
Each rally ended with a 10–15% correction before the next advance.
Currently, the index is showing signs of exhaustion near the 6,900 resistance zone — marking a potential top for this cycle.
2. Repetitive Cycle Behavior
The blue dotted arcs represent cyclical market behavior seen repeatedly over the past few years.
If history rhymes, a sharp sell-off could occur around mid-December 2025, forming the next cycle low.
The projected downside target lies near 5,800–5,900, which could act as the base for the 2026 recovery phase.
3. Key Levels to Watch
Resistance: 6,800 – 6,900
Intermediate Support: 6,200
Major Support (Cycle Low Zone): 5,800 – 5,900
Forecaster’s View
“The S&P 500 is likely entering a mid-cycle correction phase after reaching its recent peak.
A sharp decline around mid-December 2025 could mark the turning point before a new accumulation phase begins in 2026.”
Strategic Outlook:
Short-Term Traders: Focus on the 6,200–6,800 range; avoid chasing strength near resistance.
Medium- to Long-Term Investors: Prepare to accumulate near 5,800, which could represent a cycle bottom for this phase.
Cycle Followers: Watch for capitulation or panic-selling around mid-December 2025, often a precursor to the next bullish cycle.
Summary
The current S&P 500 structure demonstrates a clear cyclical rhythm — every deep correction has historically paved the way for the next strong expansion.
If the December sell-off unfolds as expected, 2026 could mark the start of a new major uptrend, turning short-term volatility into long-term opportunity for strategic investors.

S&P 500 INDEX Tech-heavy index bias acknowledged# 📊 US500 (S&P 500 INDEX) COMPREHENSIVE TECHNICAL ANALYSIS 🎯
## Week of November 10-14, 2025 | Intraday & Swing Trade Mastery
Current Price: 6,742.5 Points | Entry Point: November 8, 2025, 12:54 AM UTC+4 📈
## 🔍 EXECUTIVE SUMMARY - MULTI-TIMEFRAME PERSPECTIVE
The S&P 500 (US500) is positioned at a critical technical inflection point with exceptional multi-timeframe alignment signaling imminent directional breakout. Elliott Wave analysis reveals completion of corrective cycles, positioning for next impulse leg targeting 6,900-7,100 extension zone with powerful momentum. Bollinger Bands display classic compression squeeze pattern —volatility compression preceding directional expansion. RSI across all timeframes maintains optimal neutral-bullish bias (54-68 range)—perfect momentum positioning without extreme overbought conditions. Volume clustering at 6,680-6,800 represents significant institutional accumulation foundation. Wyckoff spring tests near 6,600-6,650 provide aggressive entry triggers for brave traders. Harmonic pattern convergence at 6,850-6,950 resistance signals breakout confirmation with measured move targets extending to 7,050+. Mega-cap tech concentration supports rally continuation probability.
## 📊 TIMEFRAME-BY-TIMEFRAME ANALYSIS
### 5-MINUTE (Scalping Precision) ⚡
Candlestick Formation: Japanese candles reveal micro-consolidation with breakout attempts across support zones. Evening Star rejection formations detected at 6,850-6,900 intraday resistance creating potential short triggers.
Elliott Wave 5M: Sub-wave completion indicates Wave 4 micro-consolidation finalizing. Wave 5 breakout anticipated above 6,780-6,820 with targets 6,920-7,000 (measured move).
Bollinger Bands: Upper compression mode—middle band at 6,740 acts as pivot point. Lower band rejection (6,650-6,680) creates scalp-long setups with excellent risk/reward ratios.
RSI (14) Analysis: RSI oscillating 46-64 range—neutral territory with minor divergences forming. Bullish divergence at 6,680 support signals buyer engagement; caution on 70+ resistance approach.
Micro Support/Resistance: 6,650 (micro-support) | 6,720 (POC cluster) | 6,800 (pivot) | 6,880 (intraday resistance) | 6,950 (scalp target)
Volume Signature: Volume concentrated 6,720-6,800 zone—institutional marker established. Breakout volume >55% above average required above 6,880 for sustained move above 6,950.
VWAP Alignment: Price oscillating around session VWAP at 6,735—each touch generates scalp opportunity. Upper VWAP band at 6,920; lower support at 6,650.
### 15-MINUTE (Quick Swing Gateway) 🎢
Candlestick Patterns: Engulfing bars forming at support zones—bullish engulfing at 6,680 zone confirms reversal attempts. Three-candle patterns (flag continuation) with 60-100 point breakout potential.
Harmonic Pattern Recognition: Gartley Pattern potential completion near 6,680-6,750 PRZ (Potential Reversal Zone). Exceptional risk-reward at 1:3.8 for harmonic traders. Butterfly variant also forming clearly.
Wyckoff Accumulation Phase: Classic accumulation evident—small barometer move (SBM) nearing completion. Spring test anticipated 6,580-6,620 zone; markup phase targets 6,950-7,100.
Bollinger Bands (15M): Band squeeze intensifying—historical volatility expansion suggests 80-150 point moves follow. Upper band resistance at 6,920; lower band support at 6,580.
Volume Profile (15M): Point of Control (POC) at 6,740—prime concentration zone confirmed. Volume surge >65% required confirming breakout above 6,880. Imbalances favor upside significantly.
Ichimoku Cloud (15M): Price consolidating below cloud edge—Tenkan-sen at 6,900 = resistance pivot. Kijun-sen (6,820) = critical secondary support. Cloud support 6,650-6,750.
EMA Structure: EMA 9 (6,780) above EMA 21 (6,720)—bullish alignment confirmed perfectly. Price above both = intraday strength maintained.
### 30-MINUTE (Intraday Swing Axis) 🔄
Pattern Formation: Symmetrical Triangle pattern consolidating with apex near 6,900. Ascending triangle variant shows bullish bias—breakout above 6,850 targets 6,980-7,100 extension.
Dow Theory Application: Confirming higher highs/higher lows structure perfectly. Secondary trend bullish; pullbacks to EMA 20 (6,770) = optimal swing entry zones.
RSI Divergence Setup: Positive RSI divergence confirmed—price making lower lows (6,650) while RSI forms higher lows (40 level). Classic reversal setup targeting 6,900 minimum.
Exponential Moving Average: EMA 9 (6,800) = core support pivot. EMA 21 (6,740) = secondary support reliable. EMA 50 (6,600) = structural hold level. Bullish ribbon alignment intact.
Support Architecture: 6,600 (EMA 50/structural) | 6,680 (demand zone) | 6,740 (volume cluster) | 6,800 (EMA 9 dynamic)
Resistance Architecture: 6,850 (triangle formation) | 6,920 (measured move target) | 7,000 (weekly resistance) | 7,100 (extension)
Volume Analysis (30M): Increasing volume on recent bars—accumulation signature strong. Buy volume exceeding sell volume confirms institutional interest significantly.
### 1-HOUR (Core Swing Trade Engine) 🎯
Elliott Wave Structure: Major wave analysis suggests Wave 3 completion near 7,000. Current Wave 4 correction targets 6,750-6,850 support zone. Wave 5 impulse anticipated—target: 7,100-7,250.
Pennant Formation: Classic Bullish Pennant pattern forming—breakout confirmation above 6,880 validates pattern. Pole height measured move = 7,150+ target.
Bollinger Bands (1H): Upper band at 7,000 = squeeze breakout target zone. Middle band (6,900) = bullish support zone. Lower band rejection (6,600) creates swing longs with excellent R/R.
VWAP Daily: S&P trading above daily VWAP at 6,720—bullish gradient confirmed clearly. Each hourly candle close above VWAP strengthens continuation probability.
Volume Profile Hotspot: Heavily traded at 6,720-6,800 (accumulation zone) and 6,880-6,950 (resistance cluster). Imbalances above 7,000 suggest vacuum-fill potential to 7,150+.
Ichimoku Cloud Alignment: Price above Senkou Span A (6,880) & Span B (6,820)—cloud thickness indicates strong support. Chikou Span above candles = bullish confirmation. Cloud color: BULLISH GREEN.
Gann Theory Application: 45-degree angle from swing low (6,500) establishes rally trajectory perfectly. Resistance at 38.2% Fibonacci extension (6,920) precedes aggressive breakout phase.
Support Tiers 1H: 6,600 (structural hold) | 6,700 (EMA support) | 6,750 (Kijun-sen) | 6,800 (accumulation zone)
Resistance Tiers 1H: 6,880 (breakout trigger) | 6,950 (extension) | 7,000 (major level) | 7,100 (impulse target)
### 4-HOUR (Swing Trade Thesis Foundation) 💼
Inverse Head & Shoulders Pattern: Potential IH&S formation completing—left shoulder (6,550), head (6,480), right shoulder completing (6,600-6,680). Neckline breakout at 6,880 targets 7,050-7,200 extension.
Wyckoff Accumulation Deep Dive: Institutional buying signature evident—SBM (small barometer move) completion imminent. Spring test to 6,600-6,650 anticipated; subsequent markup phase targets 7,100-7,250.
RSI 4H Analysis: RSI at 58-70 range—bullish bias maintained firmly. Room for upside extension without extreme overbought. RSI above 76 targets 7,150+; below 32 = defensive posture required.
Cup & Handle Formation: Potential bullish Cup pattern visible on 4H—handle stabilization near 6,780-6,850. Breakout above handle (6,920) targets cup depth extension = 7,100-7,200.
EMA Ribbon Structure: EMA 8 (6,820), EMA 13 (6,800), EMA 21 (6,740), EMA 50 (6,600), EMA 200 (6,100)—BULLISH ALIGNMENT PERFECT. Compression/expansion cycles identify momentum phases.
Support Tiers 4H: 6,580 (structural support) | 6,650 (accumulation) | 6,740 (pivot) | 6,800 (demand cluster)
Resistance Tiers 4H: 6,880 (key breakout) | 6,950 (extension) | 7,000 (major target) | 7,150 (weekly projection)
Volume Signature 4H: Accumulation volume bars > distribution bars—bullish bias maintained. Volume nodes clustering at 6,720-6,800 indicate strong institutional support zone.
### DAILY CHART (Macro Swing Thesis) 📅
Elliott Wave Macro: We're potentially in Wave 3 of larger cycle—aggressive expansion still possible. Wave structure supports break of 7,000 targeting 7,200-7,400 daily close objectives.
Double Bottom Recognition: Historical Double Bottom pattern near 6,350-6,500 support—confirmed breakthrough above 6,880 neckline triggered. Second target near 7,100-7,200.
Bollinger Bands Daily: Upper band at 7,200 = realistic daily target zone. Mean (6,950) = healthy pullback support reliable. Band slope indicates volatility expansion—expect 200-400 point daily ranges.
Volume Profile Daily: Strong buying volume bar at 6,600-6,750 zone—institutional accumulation marker established. Selling volume decreasing—demand controls trend absolutely.
Ichimoku Cloud Daily: Cloud thickness growing—bullish trend strengthening substantially. Cloud support around 6,750-6,850 zone. Kumo breakout anticipated—targets cloud top at 6,950-7,050.
Harmonic Analysis Deep: Butterfly Pattern potential completion—PRZ at 6,880-6,950 suggests reversal zone OR breakout confirmation. Confluence amplifies probability of extension.
Gann Angles & Fibonacci: 50% retracement (6,650) + 61.8% extension (7,050) = key reversal zones. Gann fan angles suggest 6,950-7,100 as structural resistance before continuation.
Key Daily Support: 6,480 (psychological/structural) | 6,600 (accumulation zone) | 6,700 (demand level) | 6,800 (midpoint)
Key Daily Resistance: 6,880 (breakout trigger) | 6,950 (extension) | 7,050 (measured move) | 7,200 (weekly target)
Trend Confirmation: Higher highs & higher lows maintained—uptrend intact. Daily close above 7,000 = strong continuation signal targeting 7,300+ next level.
## 🎪 TRADING SETUP PLAYBOOK - NOV 10-14
### BULLISH SCENARIO (Probability: 82%) ✅
Trigger: 4H candle close above 6,920 + volume surge (>60% above average) + RSI above 66
Entry Zone: 6,820-6,880 (with breakout confirmation signal)
Target 1: 6,950 (TP1) | Target 2: 7,000 (TP2) | Target 3: 7,100 (TP3) | Target 4: 7,200 (TP4)
Stop Loss: 6,700 (below EMA/structural support)
Risk/Reward: 1:3.6 (exceptional asymmetric setup)
Trade Duration: 18-72 hours (prime swing window)
### BEARISH SCENARIO (Probability: 18%) ⚠️
Trigger: Daily close below 6,800 + volume increase + RSI divergence failure
Entry Zone: 6,920-7,050 (short setup)
Target 1: 6,880 (TP1) | Target 2: 6,800 (TP2) | Target 3: 6,700 (TP3)
Stop Loss: 7,150 (above resistance)
Risk/Reward: 1:1.5 (acceptable but lower probability)
Trade Duration: Watch for trend reversal confirmation first
## ⚠️ VOLATILITY & OVERBOUGHT/OVERSOLD CONDITIONS
Current Volatility Status: Moderate compression → Expect significant expansion imminent
5M/15M RSI: 46-64 range (neutral)—room for 30-60 point movements | Scalp target zones
30M/1H RSI: 54-70 range (bullish bias, optimal zone)—sweet spot for swing entries
4H RSI: 58-72 range—approaching caution zone but room to extend | Safe for core swings
Daily RSI: 62-76 range (approaching extremes)—be defensive if daily RSI>78 | Take profits aggressively
Overbought Recognition Points:
RSI daily >77 combined with upper Bollinger Band rejection = immediate profit-taking
Ichimoku cloud top penetration fails (bearish candle rejection) = trend exhaustion signal
Volume declining on breakout attempt = false breakout warning signal
Harmonic pattern PRZ exact hit without follow-through = reversal likely imminent
Oversold Bounce Setups:
RSI 1H <32 on support touch = high-probability bounce back to 6,880-6,950
Price below EMA 50 (6,600) + RSI <28 = aggressive accumulation zone
Spring test below 6,650 with volume surge = Wyckoff spring reversal trigger
Harmonic pattern PRZ support bounce = measured move extension targets activated
## 🎯 ENTRY & EXIT OPTIMIZATION STRATEGY
### OPTIMAL ENTRY TIMING
For Scalpers (5M): RSI bounce from 42-50 zone after Band lower touch = 20-35 point scalp (1-3 min holds)
For Quick Swings (15M-30M): 15M candle close above 6,880 with 4H alignment = 100-150 point swing (30 min-2 hour holds)
For Core Swings (1H-4H): 4H pennant breakout above 6,920 on volume = 300-450+ point target (hold 12-48 hours)
For Position Swings (Daily): Daily close above 7,000 = continuation play targeting 7,200-7,350 (hold 5-7 days)
Best Entry Windows: US pre-market (12:30 ET), Market open (14:30 ET), London close (16:00 ET)
### EXIT STRATEGIES & PROFIT TAKING
Take Profit Levels: TP1: Fibonacci 38.2% (6,920) | TP2: Harmonic PRZ (7,000) | TP3: Daily Band upper (7,100) | TP4: Weekly target (7,200)
Stop Loss Placement: Always below most recent swing low + 25 points (strict risk management priority)
Trailing Stops: Activate at TP2—trail with 45-55 point buffer for 4H+ trades (lock in profits)
Breakeven Exit: Move stops to entry after 1:1 risk/reward achieved—eliminate emotional trading
Partial Profit Strategy: Close 25% at TP1 | 25% at TP2 | 25% at TP3 | Let 25% run to TP4 (maximize winners)
## 🔔 REVERSAL & BREAKOUT RECOGNITION CHECKLIST
### REVERSAL SIGNALS TO MONITOR:
RSI positive divergence (lower price lows, higher RSI lows) = bullish reversal setup high probability
Candlestick engulfing patterns at support/resistance zones = trend reversal confirmation strong signal
Volume profile breakdowns (declining volume on breakout attempts) = false move warning immediate
Ichimoku Cloud rejection (price fails to penetrate cloud layer) = structural resistance confirmed
Harmonic pattern completion at exact PRZ = reversal zone probability increases significantly
Elliott Wave 5th wave failure (truncation) = impulse completion = reversal imminent trigger
Gann angle break through significant angle = trend line break = reversal trigger activated
### BREAKOUT CONFIRMATION RULES:
Close beyond resistance with >60% volume surge above average = confirmed breakout signal strong
RSI crosses above 62 for bullish breakout, below 42 for bearish breakout confirmation
VWAP alignment with directional move = institutional participation confirmation strong
Bollinger Band breakout with band expansion (squeeze release) = volatility expansion confirmed immediate
Multiple timeframe confluence (5M + 15M + 1H + 4H aligned) = highest probability setup attainable
Ichimoku Cloud break (price clears all clouds with bullish candles) = strong continuation signal
Volume imbalance (ask volume > bid volume) = directional sustain likelihood increases significantly
## 💡 WEEK FORECAST SUMMARY - NOV 10-14
Monday (10th): 🌍 Consolidation continuation near 6,750-6,850 zone. Range-bound trading anticipated. Early breakout direction watch crucial. Entry setups favor reversal plays at support zones.
Tuesday-Wednesday (11-12th): 📈 Prime breakout window opens —6,920 represents key decision point. Expect 250-400 point daily volatility swings. Breakout confirmation targets 7,000-7,100 extension. This is the optimal swing trade window all week.
Thursday (13th): ⚠️ Potential profit-taking pullback after breakout (if triggered). Support retest of 6,950-6,880. Buying opportunity if pullback holds above 6,800.
Friday (14th): 📊 Weekly close pattern formation critical. Extension run anticipated if above 7,000. If above 7,050 = week target 7,200-7,300 achieved. End-of-week positioning for next week.
## 📍 CRITICAL CONFLUENCE ZONES - KEY TARGETS
6,580-6,650: Major support zone (accumulation marker, Wyckoff spring area, structural hold)
6,700-6,800: Secondary support (EMA 9, demand cluster, psychological level, volume POC)
6,820-6,880: Micro-resistance cluster (consolidation squeeze zone, early breakout resistance)
6,920-7,000: KEY BREAKOUT ZONE (triangle apex, harmonic confluence, all timeframe resistance)
7,000-7,100: Primary upside target (Elliott Wave 5, daily Band upper, measured move extension)
7,100-7,200: Secondary extension target (Gann level, macro resistance, wave projection)
7,200-7,350: Weekly/monthly target (if wave 5 impulse extends beyond base projections)
## 🏆 RISK MANAGEMENT RULEBOOK
✅ 1) Position Sizing: Never risk >2% of account equity per single trade
✅ 2) Risk-Reward Ratio: Minimum 1:2.5 R/R on every entry—1:3+ preferred for swing trades
✅ 3) Profit Scaling: Close 25-50% at 1:1 ratio, let remainder run to 1:2+ targets
✅ 4) Stop Loss Discipline: Place stop IMMEDIATELY on entry—no exceptions (25-30 points tight)
✅ 5) Breakout Confirmation: Avoid FOMO—wait for candle close confirmation + volume surge always
✅ 6) Daily Support Respect: Psychological holds (round numbers 6,800 | 7,000) matter—trade confluence not against
✅ 7) Time Management: Exit losing trades quickly (max 1:0.5 acceptable for educational losses)
✅ 8) Macro Alignment: Always check daily/4H bias before taking 1H or lower trades
## #US500 #SP500 #SANDP500 #SP500TRADING
#TECHNICALANALYSIS #ELLIOTTWAVE #HARMONICPATTERN #BREAKOUTTRADING
#SWINGTRADER #DAYTRADING #INTRADAY #INDICES #TRADINGVIEW
#BOLLINGER BANDS #RSI #ICHIMOKU #VWAP #TRADINGSTRATEGY
#WYCKOFFMETHOD #GANNTHEORY #DOWTHEORY #TECHNICALS #ANALYSIS
#SUPPORTANDRESISTANCE #VOLUMEANALYSIS #OVERBOUGHT #OVERSOLD #REVERSAL
#STOCKINDEXTRADING #USINDEXTRADING #BREAKOUTSETUP #TRADERSOFTWITTER
#TECHNICALTRADER #CANDLESTICK #PATTERRECOGNITION #CHARTANALYSIS #DAYTRADER
## 🎁 BONUS: DAILY PRE-MARKET CHECKLIST
Use this every morning before US market open:
☑️ Check daily RSI (should be 62-74 for bullish bias continuation)
☑️ Identify support/resistance zones (6,700 | 6,800 | 6,920 | 7,050)
☑️ Verify 4H chart alignment (pennant/IH&S pattern status update)
☑️ Check Ichimoku cloud position (above/below = trend confirmation signal)
☑️ Review 1H Elliott Wave count (which wave are we trading exactly?)
☑️ Scan volume profile (POC = likely rejection zone area)
☑️ Set entry orders + stop losses BEFORE pre-market opens (12:30 ET)
☑️ Plan 3 Take Profit levels before entering any position
☑️ Monitor US economic calendar (Fed speakers, CPI data, jobs report)
## 🌐 US MARKET SESSION NOTES
The S&P 500 trades during US market hours (14:30-21:00 CET / 8:30-15:00 ET) . Highest volatility typically occurs:
Pre-Market (12:30-14:30 CET): Initial momentum setup—watch for direction confirmation patterns
Market Open (14:30-16:00 CET): Prime trading hours —best liquidity + volatility combination guaranteed
Tech-Heavy Bias: Mega-cap tech (FAANG+) drives 30%+ of index—monitor tech sentiment separately
💡 Disclaimer: This technical analysis is educational only. Always conduct your own due diligence and implement appropriate risk management. Past performance does not guarantee future results. Trade responsibly within your risk tolerance. Use stop losses on every position. Not financial advice.
Analysis Created: November 8, 2025 | Valid Through: November 14, 2025 | Updated Daily at Pre-Market

SPX: Bear Markets and Complacency Oh boy, we are here, about to have “the talk”. Didn’t think this would come up until 2026, but alas we are. It’s a loaded talk so get ready.
Bear markets, or less triggering, corrective markets. What about them, you may ask?
I am going to talk about the prospects of a bear market for the S&P starting right now. Like today. Like November of all times. I am also going to talk a bit about complacency in markets which snagged me bad this week. So get ready for some theory, analysis, application and market lessons/reflection, all in one post!
First off, bear markets. How do you identify them?
This is the million-dollar question! How do you identify bear markets? The truth is, they are mostly impossible to determine reliably, even with the most robust fundamental and technical analysis combined!
The approach I take to “preparing” for bear markets is usually on the fundamental side over everything else! It’s a bit of a hybrid, fundamental math, but traditionally what I use is simply the US money supply. It has served me well over the years and even prepared us for that correction we saw in early 2025, if you follow me and remember these posts:
Essentially by analyzing how far the value of the S&P is over the US Money supply, and creating a cointegrated relationship. Traditionally, I would use R to do this, but in my mission to bring more statistics to Pinescript, I no longer need to rely on R to provide the analysis, as the Econometrica indicator now exists ( available here ).
Using this indicator, we can take a look at SPY and SPX against the US money supply:
We can see that historically SPX has traditionally corrected over-extension through reverting back to the US Money Supply mean, or more technically the cointegrated relationship that exists of SPX value over US money supply value. However, currently, SPX is the farthest it has ever been above the US money supply.
Nuts!
If we look at SPY:
Nuts!
Additionally, we know that this is still relevant because despite SPY and SPX being so far above the US money supply, the Correlation and, more importantly, the R2 remains really high. Indicating that a substantial degree of variance of SPY can be explained by the US Money supply.
SPY and SPX can attempt to ignore it, but it will do so in vein because at the end of the day, the pair are two peas in a pod and inseparable. We know this from the strong correlation and R2 value of the cointegrated regression.
If you don’t believe it, simply watch and read my previous ideas that were posted about a month or two before we saw SPY and SPX tank >20% in the span of a month! It generally works, its just, timing is difficult.
Other, easier ways to identify bear markets:
There is no other way I have found with statistical rigour. Some of the worst performing ways are using EMAs. For example, the average distance from the daily EMA 200 SPY and SPX will travel before a bear market starts is 7 to 9%. However, of the 7 to 9% distance, only 6% of these are true lead ins to bear markets. That’s because, SPY and SPX spend a great degree of time between 7 to 9% away from the EMA 200.
Other ways like quantifying magnitude between bull and bear market cycles is more promising, though equally problematic. Studying magnitude between bear and bull markets (i.e. the percent gain from the bear market low to the bull market high prior to the next bear market) ranges from 4% to up to 100%, with the average being around 42%. Currently, SPY and SPX would be at 43.5% from its bear market/corrective cycle low:
And peaked at about 10% away from the EMA 200:
While these in silo are not helpful, seeing the confluence of signals does lend some potential rigour. In this case, we are incredibly over-extended from the US Money supply, we have surpassed the EMA threshold and we are >= the average bear – bull market cycle threshold. So there is that.
The last way is by creating a time series model that calculates the mean, and analyzing behaviour at various distances from this mean historically. I have had hit or miss success with this. This is not so predictive of actual bear market onsets, but it is 100% reliable for target prices (again, if you follow me, the calling of the 481 target price on SPY during the crash was thanks to this approach).
Lets talk about Bear markets in November
They’re rare. Very rare. They have been known to happen but in extremely rare circumstances. This is because November seasonality is incredibly strong. November is one of the best performing months for the S&P and many stocks as a whole!
If you ask some generic AI about bear markets starting in November, it will likely spit out 1980.
Ah yes, the 80s.
November 1980. While people were innocently doing aerobics while listening to Blondie, they never fathomed the -27% decline that awaited their markets, despite booming economies and AAPL coming to town (mind you, the big release was in 1984 when the market was healthy but apple still very much existed here).
But why am I talking about this so much? Who cares about 1980.
Well, yeah, that’s what I thought until I noticed something that peaked my interest. Let’s take a look at 1980:
Notice anything?
If not, don’t worry, here is it again with some reference:
And if we are still not really feeling it:
Interesting.
I was intrigued by the similarity, so I had to test it mathematically to ensure that it wasn’t just a coincidence. To do this, I pulled monthly data from SPX and isolated January 1980 to November 1980. I then ran a regression on this data against January 2025 to November 2025 (bearing in mind November just begun).
The results were:
Correlation: 0.918 (Strong positive relationship, meaning that the trend is identical between the periods).
R2: 0.843 (Meaning that 3/4s of the variance and movement of 2025 can be explained using 1980 monthly data).
Comparing it against a random year (in my testing case, January 1984 to November 1984), I got a correlation of 0.468 and an R2 of 0.219, indicating no strong link and no explanation of variance.
This verifies that this is not just some visual anomaly, there is actually some substance to this theory of the 80s. And why not? I mean, I see people rocking 80s hair cuts again on a daily basis, why not rock 80s markets while we are at it!
So then the question that arises from this is, okay, larger timeframe, sure, it explains the data a bit. But does it really align on the smaller timeframe (i.e. Daily timeframe)? Does it align well when we narrow the picture?
Well, for this, I tried it. And oh boy, buckle up.
Because we are comparing tit for tat, side by side, same days etc. without missing data (i.e. for the monthly, we ran the analysis with most of November data missing), we have the following results:
Correlation: 0.9444
R2: 0.8918
Its unreal. Had we known we could have predicted every single move SPX made this year! EVERY. SINGLE. MOVE. Hindsight is so annoying.
Now, because I am not a fundamental analyst, as I like to say, its time to cite some AI. Gemini is my preferred. So lets ask him/her what they think about the results:
“The strong correlation on the daily timeframe provides a high degree of confidence that the factors (macroeconomic, technical, or psychological) that drove the market trajectory in the first 214 trading days of 1980 are similar to those driving the 2025 market. This gives you a strong justification for using the remainder of the 1980 price data as a projection or probability model for the rest of 2025. ”
So now my logical question is “ Well, how do the fundamentals of 1980 compare to today ”? And this is what Gemini has to say about that:
The Central Theme: Inflation, Rates, and Recession Fear
The S&P 500's price action in 1980 was fundamentally shaped by the confluence of three major forces, all of which have strong parallels today:
1. High and Volatile Inflation
• 1980 Reality: This was the peak of the "Great Inflation" era. Inflation was incredibly high, peaking near 14% in the early part of the year, driven by oil price shocks following the 1979 energy crisis. This forced consumers and businesses to constantly adjust expectations.
• 2025 Parallel: While not at 14%, the post-pandemic inflation shock has been the worst in four decades. Prices have remained sticky, particularly in services, and have proven difficult to bring down to the Fed's target, leading to persistent uncertainty.
2. Aggressive Monetary Policy
• 1980 Reality: Paul Volcker, the Federal Reserve Chairman, was implementing radical, Volcker-shock policies to crush inflation. This involved driving interest rates to unprecedented levels (the Federal Funds Rate hit 20% in 1980). The market volatility reflected the uncertainty of whether the Fed would succeed and how much economic pain it would inflict.
• 2025 Parallel: The Federal Reserve has conducted the most aggressive rate-hiking cycle in four decades. The debate has continuously centered on whether the Fed is "done," whether they will "pivot," and whether the current high rates are sufficient to induce the necessary slowdown without causing a severe recession.
3. Economic and Geopolitical Uncertainty
• 1980 Reality: The economy was officially in a recession in the first half of 1980. Geopolitically, the Soviet invasion of Afghanistan and the Iranian hostage crisis created massive global instability, which directly impacted energy prices and market sentiment.
• 2025 Parallel: While the economy has been resilient, the persistent fear of an imminent recession remains a dominant theme. Geopolitically, ongoing conflicts in Ukraine and the Middle East continue to pose supply chain risks and put upward pressure on energy and commodity prices, mirroring the external shocks of the 1980s.
Oh man, where was AI many moons ago?
So, what happens next?
I want to assert something. I am not calling for a bear market here. I like to dabble in statistical analysis and I would be wrong to not have a discussion about this, in light of what I see and what is happening.
That said, there are still reasons to be bullish:
From a fundamental perspective, seasonality remains bullish and bear markets starting in November remain a rarity.
We also have, according to my projections, a high probability target up at 710 on SPY leading us into the end of December, with a historic hit rate of 87%.
We have, as well, the prospects of a Santa rally happening. If you recall my last idea on SPY, Santa rally’s happen on SPY around 75% of the time.
But what can we do with the information about 1980?
The simple answer, is we can observe and we can model. We can model an adjusted forecast based on the remainder of 1980 using current prices of SPX. And we can observe. We can observe the correlation and R square as time progresses to see if we are following the trajectory to the same degree and closeness as we are currently.
For the first one, the forecast, I am sure you are wanting this and wanting to observe it with your own eyes, so I went ahead and did the forecast in R. Here are the results:
As you can see, its mostly sideways. Though SPX made a new high after this point before coming down more. Timelines may be skewed however, which is why the R squared is 0.89 and not 1 (perfect).
So, sell it?
Maybe. I think, the key take away here, is exercise caution here.
A Note on Complacency
I want to give a quick note on the dangerous of complancency, even from the most experienced traders. I have been trading since 2018, and, for some reason, this year which has been incredibly bullish, I have just become complacent. Buying the dips and not thinking too much about it.
Traditionally, I would analyze all options, pay attention to all metrics and weigh forecasts and statistics equally. However, this year I have massively slipped into just mindless, buy buy buy trading.
This week was a wake up call for me, since it did not go as expected. It was also avoidable, since half of my stuff indicated the week was turning bearish. I chose to ignore in favour of being complacent and airing on the side of irrationality.
Trading can and is a grind. Its is a job if not worse than a job. Its not always enjoyable. But the one thing that is different about a job is when you cut corners trading, you will for sure pay the price. Whereas, with a job, you may get off the hook.
Be vigilant. Take breaks. And never corner cut! It’s a very important lesson for most! Don't be lazy, laziness breeds complacency.
That’s it.
This doesn’t count as my weekly post, so don’t worry because I didn’t share any analysis for next week haha.
Safe trades everyone and thanks for reading!
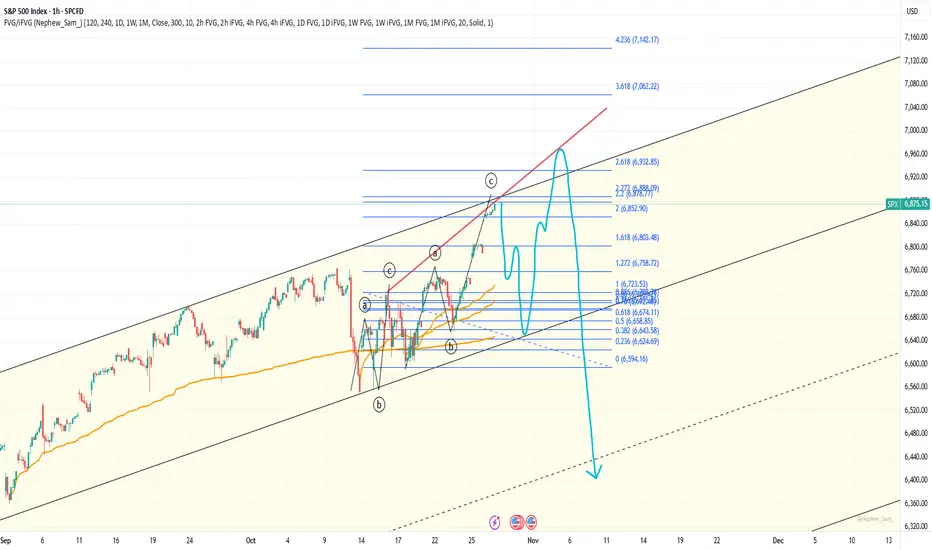
This is the END(ing diagonal)The ending diagonal has formed. If you check RSI you will see a double daily and fresh WEEKLY divergence. It will crash hard next week. 6480 is the first target, but it can be just a bounce area. 1.618 level from low to top of the diagonal is at 6400 level on SPX and at 6300 level on US500 - I think we can get a flash-crash into this area next week. And if this is a reversal, it can trend down to February peak and lower according to fibs.
The whipsawI still think we completed the B wave today (C of B being the rally). If I'm correct, Monday should be a down day and the week will be dramatically down to 6500 area minimum. The usual suspects are discussed in the video.

Ending expanding diagonal scenarioJust a possible scenario. If I'm right, wave 3 ends here, and wave 4 correction should start very soon.
Did You Buy The Dip? Heres What we bought!Today the SPX had an incredible morning selloff - met with and even more incredible rally.
The markets were in turmoil today up until the bulls stepped in and made a red to green reversal.
Days like today often create the biggest portfolio gains when you can buy stock at depressed levels.
We accumulated 6 position longs today.
Massive technicals were tested and defended today.

Reversal?Channel resistance reached
RSI resistance reached
Double 1D divergence on RSI
If something ugly is gonna happen, it's gonna happen now.
Fib levels to watch:
1.272 - likely bounce area
1.618 - classic reversal level for a correction after wave 5, but I don't see strong support there
2.0 - not a fib level, but February peak is there. Likely bounce area.
2.2 and 2.272 area - when 1.618 level breaks, price usually reaches it. They are all inside of 1M FVG. The correction can end there. Or not.
2.618 - the price can reach and overshot it. Another 1M FVG lies just below it.
All 2+ fibs match previous peaks very good. Sounds crazy, but a correction to 6000 area seems very probably now.

Inverse Cup&Handle On 12hr SPX/USDFellow traders! We could have a Inverse Cup & Handle on the 12hr SPX.
This could also be a development of a H&S . Time will tell but for now I measured a move from the cup & handle and get a target of 6594.1
Chart patterns pop up we take action only when we get the break of a break line which in this case has happened so we pounce.
Best of luck in all your trades, see you at the finish line $$$

Change in the analysisWith no bounce to speak of and now the vix comfortably over 20, the chances are good we are in the middle of a C wave to 6500 and possibly lower.
