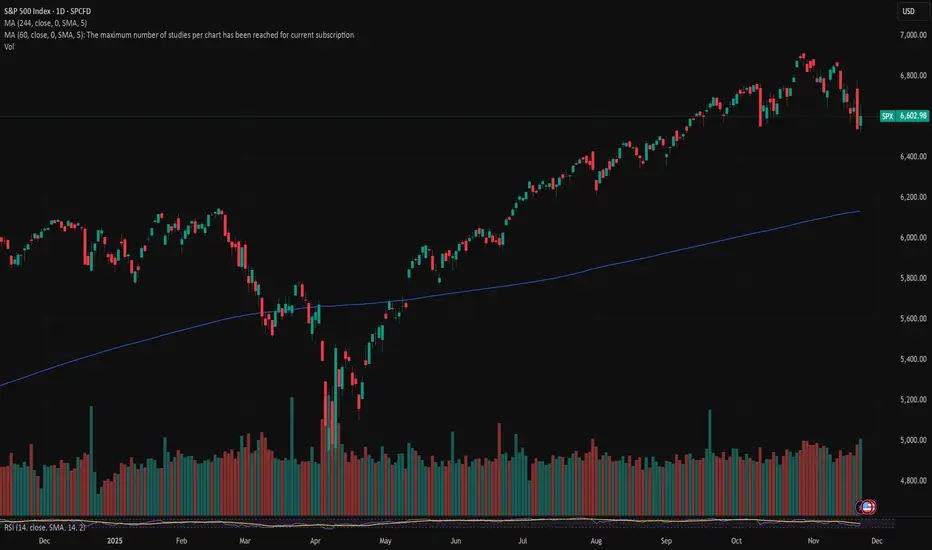
Brace for Impact (I hope I am wrong)This market is reminiscent of the action before the 2020 crash. Above is now and below is 2020 covid crash. The charts are self explanatory so not much for me to say.
This is not a financial advice but for entertainment only. Please do your research!
Trade ideas

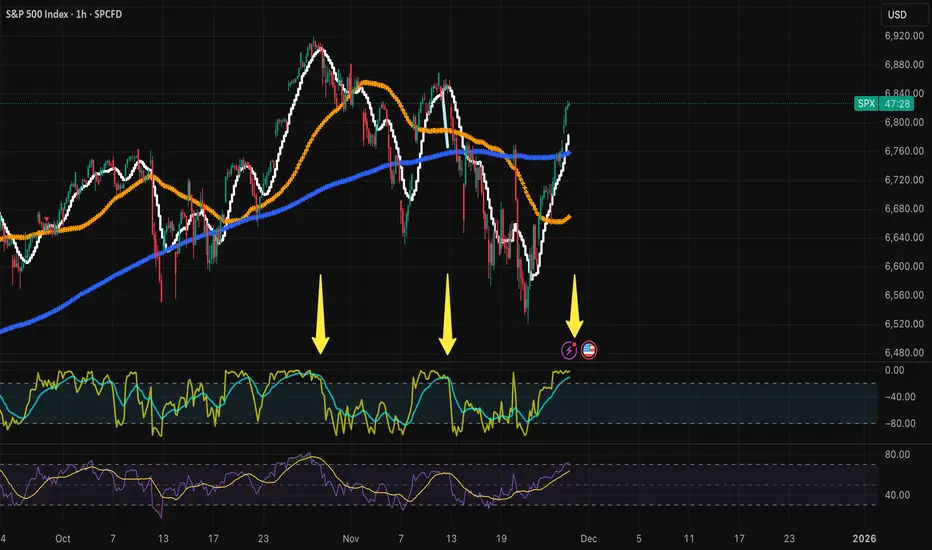
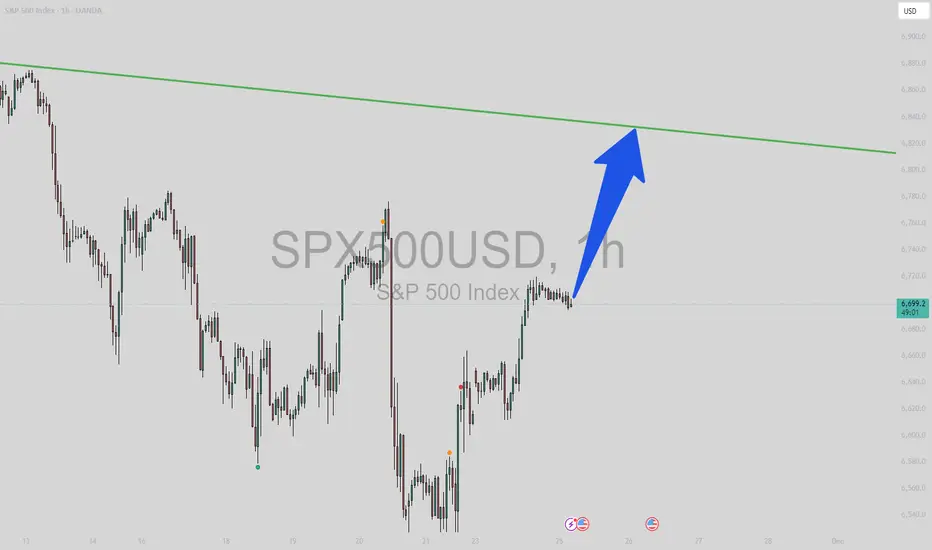
S&P500 Final rally to 6925, then sell-off to 1D MA200?The S&P500 index (SPX) had a massive Friday rebound on its 1D MA100 (green trend-line) and yesterday touched again its 1D MA50 (blue trend-line), this time as a Resistance.
If it manages to break and close a 1D candle above it, we expect the current rebound to continue and evolve into the end-of-year rally and test at least the ATH Resistance at 6925.
The 1D RSI sequence suggests that we may be currently inside a same pattern as the December 2024 - January 2025 fractal, which after a 1D MA100 rebound it hit the ATH Resistance again and then got heavily rejected back to the 1D MA200 (orange trend-line) and beyond.
As a result, after the rally, our medium-term Target is 6300 (expected contact with the 1D MA200).
---
** Please LIKE 👍, FOLLOW ✅, SHARE 🙌 and COMMENT ✍ if you enjoy this idea! Also share your ideas and charts in the comments section below! This is best way to keep it relevant, support us, keep the content here free and allow the idea to reach as many people as possible. **
---
💸💸💸💸💸💸
👇 👇 👇 👇 👇 👇

Bulls don't get too comfortable....fundamentals still not goodHave been tracking the swings recently and macros and it's worth noting that the fundamentals of the economy are still weak. The upcoming rate reduction is already priced in, and it won't change the employment / defaults / private credit environment and inflation. Expect a dip very very soon and red across the board. The economy is being propped up with hot air and it's just not sustainable. All the macros are screaming red and people are ignoring until it's too late.
#SQQQ could be an interesting hedge, but would pull out now from any long positions as the AI bubble is showing big cracks and people are deciding to look the other way until they get wiped out.
S&P 500 Roadmap: Correction Rally Ending—Another Drop Is ComingAs I expected in the previous idea , the S&P 500 index( SP:SPX ) moved toward the broken Support lines and completed its pullback, reaching its targets.
Given that the S&P 500 index nowadays shows a significant correlation with the cryptocurrency market and Bitcoin( BINANCE:BTCUSDT ), it’s wise to pay even more attention to this index, as it can help us gauge the crypto market trends.
The S&P 500 is approaching a Resistance zone($6,675_$6,637), and considering the momentum of last weekend’s decline, it appears that this recent upward movement is merely a correction. Therefore, we should expect another decline in the S&P 500.
Since the U.S. dollar index( TVC:DXY ) is also likely to maintain an upward trend, the rise in the dollar can lead to more capital flowing into safer assets, potentially impacting the S&P 500 negatively.
The S&P 500 is also influenced by the US 10-Year Government Bond Yield( TVC:US10 ). If the US 10-Year Government Bond Yield trends upwards , then riskier assets like cryptocurrencies might go down more, and this, in turn, could also impact the S&P 500.
Considering all the above, I expect that the S&P 500 will at least test its Support zone($6,580_$6,490) again and, if that Support zone($6,580_$6,490) is broken, we could anticipate further declines in the U.S. stock market and the S&P 500.
First Target: $6,526
Second Target: $6,413
Stop Los(SL): $6,731
💡 Please respect each other's opinions and express agreement or disagreement politely.
📌S&P 500 Index Analyze (SPX500USD), 4-hour time frame.
🛑 Always set a Stop Loss(SL) for every position you open.
✅ This is just my idea; I’d love to see your thoughts too!
🔥 If you find it helpful, please BOOST this post and share it with your friends.

SPX | Testing the Upper Flag Line After AVWAP Shifts The index has steadied as broader sentiment firms, with markets leaning on softer inflation trends and a more patient Federal Reserve tone. That backdrop has helped risk appetite rotate back into equities after the recent pullback.
Technical Lens:
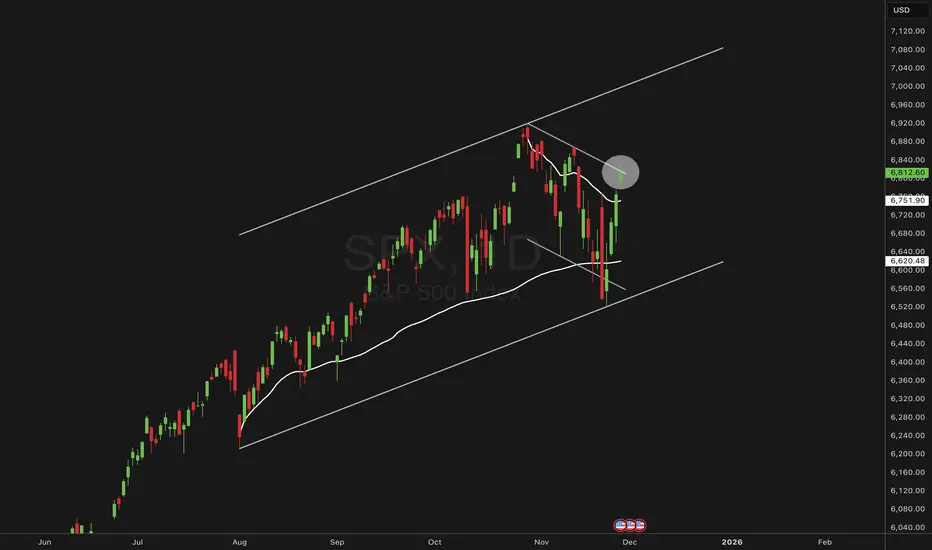
The chart shows SPX rebounding cleanly from the lower boundary of its broader bullish channel, which also aligns with the anchored VWAP drawn from the August 2025 swing low. That confluence provided a strong reaction zone. Price has since pushed through the anchored
VWAP set from the 29 October high, suggesting momentum is shifting back towards the upper side of the structure. The index now sits just beneath the upper boundary of the short-term bull flag, and this zone becomes an important area to monitor as it acts as the immediate ceiling.
Scenarios:
If the upper flag line gives way, the move could open room for continuation along the channel towards the next structural resistance zones.
If the flag line holds, the market may consolidate or retest the mid-channel levels, with the prior AVWAPs acting as nearby reference points.
Catalysts:
US GDP revisions, PCE inflation data and major tech earnings later this week may be the triggers that decide whether the index pushes through or pauses here.
Takeaway:
This upper flag boundary is the key inflection point for SPX, with the anchored VWAP shifts helping define the directional bias.
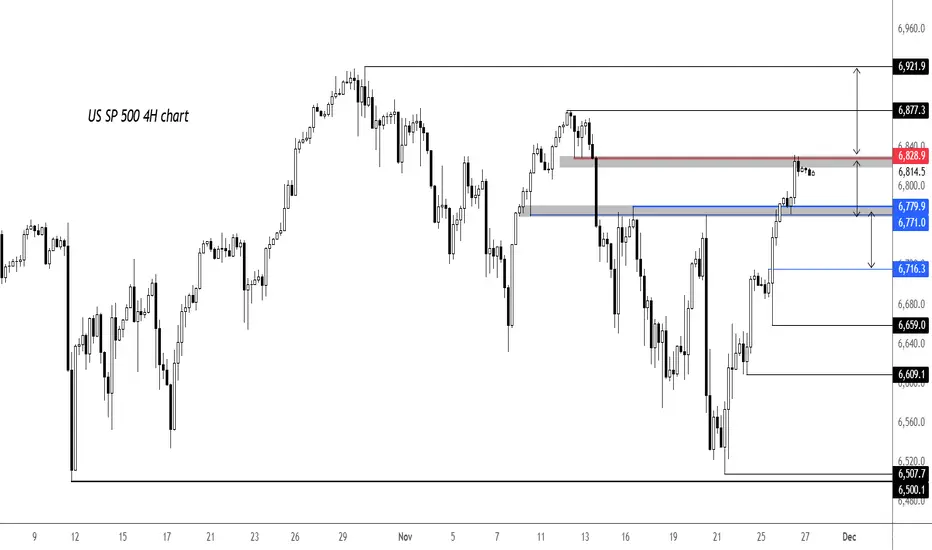
S&P 500 levels to watchFollowing the big recovery, lots of short-term levels have been reclaimed this week but with US markets closed today, index futures have been fairly quite and easing back down ever so slightly. Key support is now seen around 6771-6780 on our US SP 500 chart (derived from the underlying ES prices). Below that, 6716 is the next support. Bulls will get in trouble if 6659 - most recent low - breaks. On the upside, 6829 is first hurdle, marking the point of origin of the previous drop. Ideal location for the bears to step back in if they want to regain control of price action. Lose that, 6877 is next upside target then the all time high at 6922.
By Fawad Razaqzada, market analyst with FOREX.com
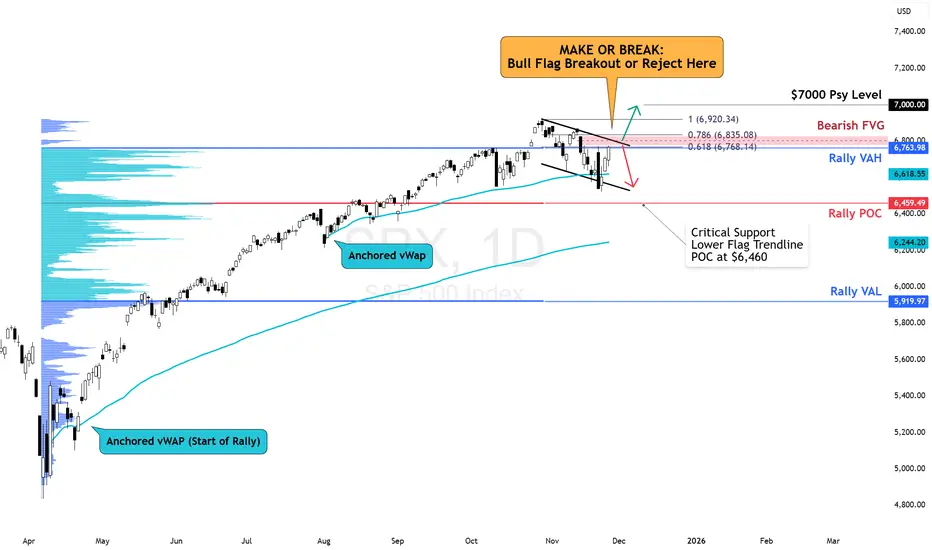
SPX Make or Break: Bull Flag or FVG RejectionSPX is in a make or break situation. Break this bull flag, and we could head header to touch the $7,000 psychological level. Reject here, and we could see lower at $6,500.
After reclaiming the anchored vWAP, SPX is pushing into a stacked zone of resistances:
Upper Bull Flag trendline
Bearish Fair Value Gap
0.618 Fib Retracement
Upside trigger:
– Break and hold above the FVG + 0.786 (≈ 6835–6920).
– Target = retest of highs / 7000.
Downside trigger:
– Failure at FVG
- Breakdown of bull flag
- Move towards Rally POC at 6459
US500 Bullish: Entry: 6,700 – 6,720US500 – Institutional Intraday Analysis (Athena Protocol v7.3)
Exchange: IC Markets
Current Price: ~6,791.00
Current Time: 01:57 UTC-5
Timeframe: 90m
1. Market Bias: Bullish (but overstretched and vulnerable to a liquidity tap)
Bias Explanation
This chart screams: “Yes, we are bullish, but please… someone sweep me properly before I continue.”
Let’s break it down.
Goldbach Levels
Strong PO3 clustering around 6561 and 6723–6804, but price is now far above these baselines.
– Algo signals on the 27 and 81 rows: BR → FV, RB → OB, -RB → -OB
These represent continuation patterns, not reversal ones.
– The 243 & 729 rows show FV → MB and LV → -LV, again supportive of continuation after retracement.
Conclusion: Goldbach models favor bullish continuation after a pullback.
They do not support longing at current highs.
Visible Range Volume Profile
– Major HVN at ~6,690–6,720
– Low-volume void above price → explains the straight-line rally.
– But current price at 6,791 is sitting in a thin-volume zone = susceptible to deep intraday pullbacks.
Session Volume Profile
– Sessions are printing higher Value Area Highs and Lows → trending structure.
– But today’s session POC is lagging behind price → inefficiency = retracement likely.
CVD
– CVD is flat-to-slightly declining despite price rising.
This is one of Athena’s biggest red flags:
Displacement not supported by real buy flow = engineered move.
COT (Non-Commercial USD positions)
Massively bearish sentiment:
– % Short = 73%
– Net positions = –14,933, worsening from –13,145
– Big players increased shorts, decreased longs.
This is why pullbacks on US500 have been savage lately.
Macro Snapshot
– FOMC cautious but not dovish; market pricing soft-landing narrative.
– Trump’s fiscal plans support equities short-term.
– But rising Middle East tensions + Treasury issuance linger as downside catalysts.
Overall Bias: Bullish trend, but the smarter long is taken after the sweep.
2. Key Interpretation
– Market is too high, too fast.
– CVD + COT warn that this pump is weak-handed.
– Volume profile signals a retest toward 6,720 or even 6,660 before further rally.
Bias: BUY ONLY — but only after liquidity raids.
Not at the highs. Never at the highs. Not even if you’re feeling lucky.
3. Smart Money Buy Levels
A. Aggressive Buy Limit
Entry: 6,745 – 6,755
SL: 6,708
TP1: 6,793
TP2: 6,820
TP3: 6,855
Rationale:
– First micro-inefficiency beneath current structure.
– Will likely fill on the first intraday pullback.
– Partial mitigation of the OB at the current high.
Win Probability: ~58%
Works if momentum continues without deep sweep.
B. Conservative Buy Limit (Primary Institutional Level)
Entry: 6,700 – 6,720
SL: 6,660
TP1: 6,780
TP2: 6,815
TP3: 6,860
Rationale:
– This is the visible range HVN and prior volume shelf.
– The ideal level where algos reload.
– Matches Goldbach’s 81 PO3 level + session POC cluster.
Win Probability: ~72%
Most reliable for today’s trading.
C. Very Safe Buy Limit (Institutional Raid Zone)
Entry: 6,645 – 6,660
SL: 6,588
TP1: 6,720
TP2: 6,780
TP3: 6,840
Rationale:
– Deep sweep of equal intraday lows.
– Cleans out all short-term long stops.
– Aligns with Goldbach 729 and 243 baseline structures.
– Best RR, but may not fill unless NY session gets heavy liquidity injection.
Win Probability: ~81%
The highest-probability setup but lowest fill probability.
4. Why These Plays Work
Technical Confluence
– US500 is extended into low-volume weeds.
– CVD shows buyers exhausted.
– Goldbach signals agree with continuation but ONLY after the retrace.
– Volume profiles indicate untested demand zones below.
Macro Confluence
– Equities remain favored but heavily crowded.
– Short-term short squeeze may have just finished.
– COT data screams: “Market too high. Needs a flush.”
So we wait… and buy the flush.
5. Best Trading Session
– London AM → NY Opening Range
These sessions consistently deliver the retracements US500 refuses to give in Asia.
6. Athena’s Final Words
US500 right now is like a caffeinated intern: sprinting full-speed without checking whether their shoelaces are tied.
Spoiler: they’re not.
Let the kid trip, scoop up the dip, and ride the rebound.
This is educational analysis, not financial advice.

S&P500 - US markets closed, liquidity thinUS Thanksgiving Holiday
US markets closed, liquidity thin globally.
Expect muted volumes, potential for exaggerated moves in FX and rates due to reduced participation.
Key Support and Resistance Levels
Resistance Level 1: 6830
Resistance Level 2: 6848
Resistance Level 3: 6866
Support Level 1: 6770
Support Level 2: 6756
Support Level 3: 6735
This communication is for informational purposes only and should not be viewed as any form of recommendation as to a particular course of action or as investment advice. It is not intended as an offer or solicitation for the purchase or sale of any financial instrument or as an official confirmation of any transaction. Opinions, estimates and assumptions expressed herein are made as of the date of this communication and are subject to change without notice. This communication has been prepared based upon information, including market prices, data and other information, believed to be reliable; however, Trade Nation does not warrant its completeness or accuracy. All market prices and market data contained in or attached to this communication are indicative and subject to change without notice.

SPX500: Thanksgiving Range — 6815–6842 Controls the MarketOANDA:SPX500USD continued to push higher exactly as projected yesterday.
Market activity is expected to be quieter today due to the Thanksgiving holiday, which typically reduces volatility across U.S. indices.
Technical Outlook
For today, the price is likely to consolidate between 6815 and 6842 until a breakout occurs.
Bearish Scenario:
A 1H close below 6813 will open the path toward 6771, with 6797 acting as the first reaction zone.
Bullish Scenario:
While trading above 6813, the price may retest 6842, and a break above this level could extend toward 6870.
Pivot Line: 6813
Support: 6797 · 6771
Resistance: 6842 · 6870

Will SPX Make New All Time Highs? We dive into the recent technical setup of the S&P500.
We are on the verge of triggering a new massive bullish patterns.
The backdrop of soft commodities. soft yields, softer dollar and the December 10 rate cute.
We have the tailwinds in place for higher price.
I would like to see some sideways chop to make this rally more sustainable, but bull market bounces are very fierce especially when they come from failed bearish patterns.

S&P 500 – DTF Technical & Fundamental AnalysisS&P 500 – DTF Technical & Fundamental Analysis
⚠️ S&P 500 Update – Short-Term Bullish, But Overall Structure Shows Weakness
The S&P 500 recently experienced a short-term bullish move after retesting the key support level at 6,500, which is now acting as a major support following the reversal. This rally was largely driven by major technology and AI-related firms, especially Alphabet. Strong earnings and leadership in generative AI have boosted investor confidence, propelling the index to new highs.
Despite this, technical factors suggest caution. On the daily timeframe, the overall market structure after the bullish trend is forming lower highs and lower lows, indicating that buyers are losing momentum. This rally could be temporary, largely representing liquidity grabs above previous highs rather than a true trend reversal. From a technical perspective, 6,500 is a critical support zone. If this level holds, the S&P 500 could continue the short-term bullish move. However, if this level breaks with high volume, a deeper correction may follow, potentially targeting the next major demand zone around 6,370.
The market remains highly reactive to both technical triggers and fundamental news, so caution is advised. Watch key levels closely and wait for confirmed structure before taking positions.
⚠️ Risk Disclaimer
This analysis is for educational purposes only and is not financial advice. Trading CFDs and Forex involves high risk. Always trade responsibly and manage your risk.

Don’t Let Panic Drive Your Decisions, The Market Reward PatienceDon’t Let Panic Drive Your Decisions — Because The Market Rewards Patience
The last few days in the S&P 500 were the perfect reminder of how quickly sentiment swings — and how dangerous emotional trading can be.
* Nov 20: Headlines screamed about an “AI Bubble Burst,” triggering panic selling.
* By Nov 21: Market declined +3.5%, wiping over $2 trillion in market value.
* By Nov 26: The same market recovered $2.6 trillion, pushing the S&P 500 back above 6800
* S&P 500 is now just 1.6% away from all-time highs (6921).
Anyone who sold in fear on Nov 20–21 is now sitting on regret, while disciplined investors who stayed calm are comfortably in profit.

$SPX next move higherSP:SPX 5510 is my short TP level and level to go long. It hit perfectly on Friday and now we are 200 points higher. Price action is still bullish (despite the bearish weekly candle last week). 5826 is next magnetic level. And a break above the trendline will see ATH before next of year.
The Bears last standThis level and slightly higher needs to hold otherwise we're going to test the highs and possibly go much further. If there is no reversal today, we will be closing over the 18ma for two days in a row and that is certainly bullish. The Vix needs to get over 20 for a reversal to start having legs. Gold is just sideways. Oil is coiling up for a larger move - possibly down. BTC looks like it can go lower.

$SPX - Turkey WeekI made this turkey with my strong hand:
Bulls seek to close >6700
Bears seek to contain <6700, IDEALLY <6600
OUTLOOK = choppy, bumpy, and fun - keep it small, keep it tight like a tiger
Feel free to comment or add input 💪
Inside modified pitchfork anchors on macro
cyan trend line = .618
fusia = median
LARGER TF POSTED BELOW

The S&P 500: The Last Stand Into Year-EndThe 2025 bull market has culminated as presented in my previous post.
The major structure topped on October 28th, with a secondary, weaker high on November 12th. What remains now is the distribution phase into the final weeks of the year—where the market decides whether it will stabilize and potentially from a double top or begin its descent into 2026.
1. Location in Structure
Price is currently trading beneath the declining angle drawn from the October and November tops.
This angle declines at $4 per day, and has acted as the defining rhythm of the post-top decline.
Top of the year: October 28
Lower high: November 12
Current position: Beneath the angle → inside potential distribution
2. The Two Paths
The market has two paths from here:
A. Bullish Path — December Rally Trigger
To challenge the November 12th high, the S&P must close above the angle.
A confirmed break of the angle → opens the path to
📈 6,860 in the first week of December
This would represent a counter-trend rally back into the underside of the broader 2025 cycle structure.
B. Bearish Path — Rejection = Lower Prices
If price rejects at the angle, it signals:
distribution is underway
momentum remains weak
the November highs are secure as the final secondary top
In this case, lower prices into December follow naturally.
3. The Message of the Structure (And more Charts to keep up on)
The larger cycle has already ended.
We are now watching the small-scale geometry that governs how the year will close:
beneath the angle → distribution
above the angle → December rally
SUMMARY
What remains now is the micro-geometry that will determine how the year closes:
Beneath the declining angle → distribution continues
Above the angle → a December rally opens toward 6,860
While the market could attempt to press toward new highs, the probability is very low — and would be surprising given the current economic backdrop and the clear contraction emerging from a dominant sector of the market.
The structure, motion, and fundamentals all argue that the 2025 peak is already in.

Watch the banksKRE (regional banks) is looking like it's setting up a potential C wave down. If so, there's something wrong in that sector and it will drag the market down with it, especially IWM.
AAPL probably a false breakout here and I expect a large move down.

S&P500 H1 | Bearish Reaction Off Key ResistanceMomentum: Bearish
Price is currently below the ichimoku cloud.
Sell entry: 6,711.35
- Strong pullback resistance
- 78.6% Fib retracement
- 100% Fib projection
Stop Loss: 6,785.20
- Overlap resistance
Take Profit: 6,641.93
- Overlap support
High Risk Investment Warning
Stratos Markets Limited (tradu.com/uk ), Stratos Europe Ltd (tradu.com/eu ):
CFDs are complex instruments and come with a high risk of losing money rapidly due to leverage. 70% of retail investor accounts lose money when trading CFDs with this provider. You should consider whether you understand how CFDs work and whether you can afford to take the high risk of losing your money.
Stratos Global LLC (tradu.com/en ): Losses can exceed deposits.
Please be advised that the information presented on TradingView is provided to Tradu (‘Company’, ‘we’) by a third-party provider (‘TFA Global Pte Ltd’). Please be reminded that you are solely responsible for the trading decisions on your account. Any information and/or content is intended entirely for research, educational and informational purposes only and does not constitute investment or consultation advice or investment strategy. The information is not tailored to the investment needs of any specific person and therefore does not involve a consideration of any of the investment objectives, financial situation or needs of any viewer that may receive it. Past performance is not a reliable indicator of future results. Actual results may differ materially from those anticipated in forward-looking or past performance statements. We assume no liability as to the accuracy or completeness of any of the information and/or content provided herein and the Company cannot be held responsible for any omission, mistake nor for any loss or damage including without limitation to any loss of profit which may arise from reliance on any information supplied by TFA Global Pte Ltd.

SPX500: Tight Consolidation Before Breakout — Key Levels AheadSPX500 | Technical Overview
New York Fed President John Williams signaled Friday that a near-term rate cut is still possible, noting that labor-market weakness is now a greater risk than inflation.
Traders have increased the odds of a 25 bps December rate cut to 69%, up from 44% a week ago.
Technical Outlook
SPX500 remains volatile, but the broader momentum still leans bearish.
Price is currently consolidating between 6635 and 6610, waiting for a clear breakout direction.
A 1H or 4H close below 6610 will strengthen the bearish trend toward 6578, with further downside possible.
A break and stability above 6635 would open the door for a move toward 6670, and later 6705.
Key Levels
Support: 6610 · 6579 · 6507
Resistance: 6635, 6670 · 6704

SPX: Are tech stocks overvalued?Are tech stocks too expensive at this moment? This continues to be one of the main questions among investors. The second is related to the next Fed move at the FOMC meeting in December. The markets entered November in a corrective mood. The S&P 500 dropped another week in a row, to the level of 6.524. Although the market was trading in a positive territory on Friday, still, the S&P 500 is marking around a 5,5% drop for the month.
The week started with markets' high concerns regarding Nvidia quarterly results. Jan Huang brought some relief commenting that the demand for chips remains extremely strong, especially for its Blackwell GPUs. The posted quarterly result showed Q3 revenue of $57B, up 62% y/y. The company expects strong earnings to continue till the end of this year, with estimated $65B in Q4, which is higher from current Wall Street estimates. Regardless of data, the shape price dropped by 11%.
Amazon is cutting more than 1,800 engineering roles as part of a broader reduction of 14,000 corporate jobs, the largest layoff in its 31-year history. Its share price went down by 8% for the week. On the opposite side, Alphabet (GOOGL) managed to hold the higher grounds, despite the general sell-off of tech stocks.
The sentiment on equity markets continues to be negative, with decreasing expectations that the Fed might cut interest rates in December. Current odds by the CME FedWatch Tool dropped to 41%, considering relatively mixed jobs data posted for September.
Global Trade and Its Impact: A Comprehensive AnalysisEconomic Impacts of Global Trade
At the core, global trade acts as a catalyst for economic growth. By allowing countries to specialize in the production of goods and services where they have a comparative advantage, trade promotes efficiency and productivity. For instance, countries with abundant natural resources can focus on extraction and export, while those with advanced manufacturing capabilities concentrate on producing high-value goods. This specialization leads to lower production costs, greater product variety, and higher overall economic output.
Trade also contributes to economic diversification. For developing countries, exporting a range of goods reduces reliance on a single sector and mitigates economic risks associated with commodity price fluctuations. For developed economies, imports provide access to raw materials, advanced technologies, and cheaper consumer goods, enhancing competitiveness. Moreover, global trade stimulates foreign direct investment (FDI), as companies establish operations abroad to access new markets, which, in turn, creates jobs and fosters economic development.
However, the economic impact of trade is not uniformly positive. While aggregate national income may rise, certain sectors and communities may face disruptions. Industries unable to compete with imported goods may decline, leading to unemployment and regional economic disparities. Additionally, excessive dependence on global markets can expose countries to external shocks, such as global recessions or supply chain disruptions, as witnessed during the COVID-19 pandemic.
Social and Labor Impacts
Global trade significantly influences labor markets and societal structures. By opening new markets and stimulating economic growth, trade creates employment opportunities across sectors. Export-oriented industries often provide higher wages and skill development opportunities. International companies operating in multiple countries also contribute to knowledge transfer, training local workforces, and raising labor standards.
On the other hand, trade can exacerbate social inequalities. Workers in industries exposed to international competition may face wage stagnation or job losses. The shift of manufacturing to countries with lower labor costs, often called “offshoring,” has led to declining industrial employment in certain developed economies, causing social and political tensions. In developing nations, while trade can lift millions out of poverty, it may also lead to exploitative labor practices if regulatory frameworks are weak.
Global trade also fosters cultural exchange. Exposure to foreign goods, services, and media enables the spread of ideas, lifestyles, and technologies, influencing societal values and consumption patterns. While this cultural interconnection promotes understanding and innovation, it may also challenge local traditions and cultural identities, leading to debates over cultural homogenization.
Technological and Innovation Impacts
One of the less immediately visible but highly transformative impacts of global trade is technological advancement. Trade encourages competition, compelling firms to innovate to maintain market share. Access to international markets allows companies to scale up production, invest in research and development, and adopt best practices from other countries. Technology transfer often accompanies trade, as multinational corporations introduce advanced processes, machinery, and management practices to host countries.
For example, the proliferation of information and communication technologies (ICT) in developing countries has been facilitated by global trade, enabling digital services, e-commerce, and global connectivity. Furthermore, trade in high-tech goods, such as semiconductors, medical equipment, and renewable energy technology, accelerates the diffusion of innovation globally, contributing to economic development and environmental sustainability.
Environmental Impacts
While global trade boosts economic growth, it also has environmental consequences. Increased production and transportation of goods contribute to carbon emissions, resource depletion, and ecological degradation. The demand for agricultural products, minerals, and manufactured goods often leads to deforestation, overfishing, and industrial pollution. Moreover, the carbon footprint associated with global supply chains has become a pressing concern, prompting discussions on “green trade” and sustainable practices.
On the positive side, trade can facilitate the dissemination of environmentally friendly technologies. Countries can import renewable energy equipment, pollution-control technologies, and sustainable agricultural practices, helping to mitigate environmental challenges. International agreements and trade policies increasingly incorporate environmental standards, promoting responsible trade practices that balance economic growth with ecological preservation.
Geopolitical and Strategic Impacts
Global trade is closely linked to geopolitics. Countries that dominate trade in critical goods, such as energy, rare minerals, and advanced technology, wield significant strategic influence. Trade relationships can foster diplomatic cooperation, strengthen alliances, and reduce the likelihood of conflict by creating mutual economic dependencies. Conversely, trade disputes, tariffs, and sanctions can become tools of geopolitical leverage, shaping international relations.
Trade also contributes to regional integration. Organizations like the European Union, ASEAN, and NAFTA (now USMCA) exemplify how trade can promote regional stability, harmonize regulations, and create large economic blocs capable of influencing global markets. However, overreliance on a few trading partners can increase vulnerability to political and economic pressures, highlighting the need for diversified trade strategies.
Globalization, Inequality, and Policy Challenges
Global trade is a driving force behind globalization, connecting economies, societies, and cultures. It has lifted millions out of poverty, expanded consumer choice, and spurred innovation. However, it has also intensified inequality, both within and between nations. Wealthier countries and multinational corporations often capture the lion’s share of trade benefits, while poorer nations may struggle to move up the value chain.
Policymakers face the challenge of maximizing trade benefits while mitigating negative impacts. Trade agreements, tariffs, and subsidies must be designed to protect vulnerable industries and labor forces. Social safety nets, skills training, and investment in infrastructure are essential to ensure that trade-driven growth is inclusive. Furthermore, international cooperation is critical to addressing environmental impacts, labor standards, and fair competition.
Conclusion
In summary, global trade is a double-edged sword with profound and multifaceted impacts. Economically, it promotes growth, efficiency, and diversification, but can disrupt local industries. Socially, it generates jobs and facilitates cultural exchange, yet can exacerbate inequality. Technologically, trade drives innovation and knowledge transfer, while environmentally, it poses both challenges and opportunities. Geopolitically, trade shapes alliances, strategic dependencies, and regional integration.
The ultimate impact of global trade depends on the policies, governance, and strategies implemented by nations. When managed effectively, trade can be a powerful engine for sustainable development, economic prosperity, and international cooperation. Conversely, neglecting its social, environmental, and political dimensions can exacerbate inequality, environmental degradation, and geopolitical tensions. As the world continues to navigate the complexities of globalization, understanding and leveraging the impact of global trade remains essential for shaping a more equitable and prosperous future.
SPX: Fed will decide on SPX next move The inflation data, as posted through the PCE Price Index on Friday, was in the focus of markets during the previous week. This data came just a week before the FOMC meeting, scheduled for December 10th, increasing odds that Fed might cut interest rates by another 25 basis points. The PCE of 2,8% y/y in September was just a bit lower from anticipated 2,9%. In addition, Friday brought University of Michigan Consumer Sentiment for December, exposing decreased inflator expectations for both near and long term. The CME FedWatch Tool is now posting around 87% odds for a 25bps rate cut in December. On the other hand, analysts are noting that the market has already priced this cut, so the main current question is what is next for the US economy?
The S&P 500 continued its winning streak during the previous week. The index has closed the week at the level of 6.870, after previously reaching the weekly high at 6.893. The biggest weekly surprise came from Netflix, who agreed to buy Warner Bros.’ key studio and streaming assets, including HBO/HBO Max and major film-/TV-studio operations, in a deal valued at around $83 billion (equity value about $72 billion). The deal must clear regulatory review, and sources say the Trump administration views the merger “with heavy scepticism,” signalling a potentially difficult approval process under U.S. antitrust scrutiny.
Tech companies continue to dominate markets, however, Nvidia continues to struggle to gain momentum. The week ahead is promising to be a volatile one, considering the FOMC meeting, scheduled for Wednesday, December 10th. As analysts are noting, the market has already priced the 25bps rate cut. In case of any surprises on this side, a significant market correction might be triggered. In case of a rate cut, the markets might continue to price US equities at higher grounds.
