SPX500 trade ideas

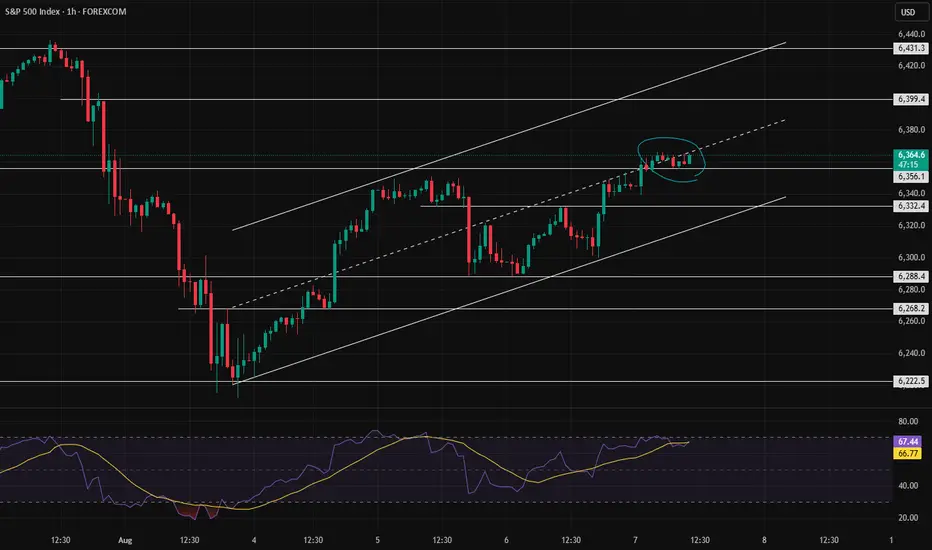
Activation of the rounded pattern? Or a trend reversal?In the previous analysis, we mentioned that the price was at a decision point — and it made its decision, managing to move up slightly before returning to the bottom of the channel.
Now, at the end of the channel, a pattern has formed. We need to see whether it gets activated or turns out to be a fake.
If the pattern fails (turns out fake), the bullish trend could continue more strongly.

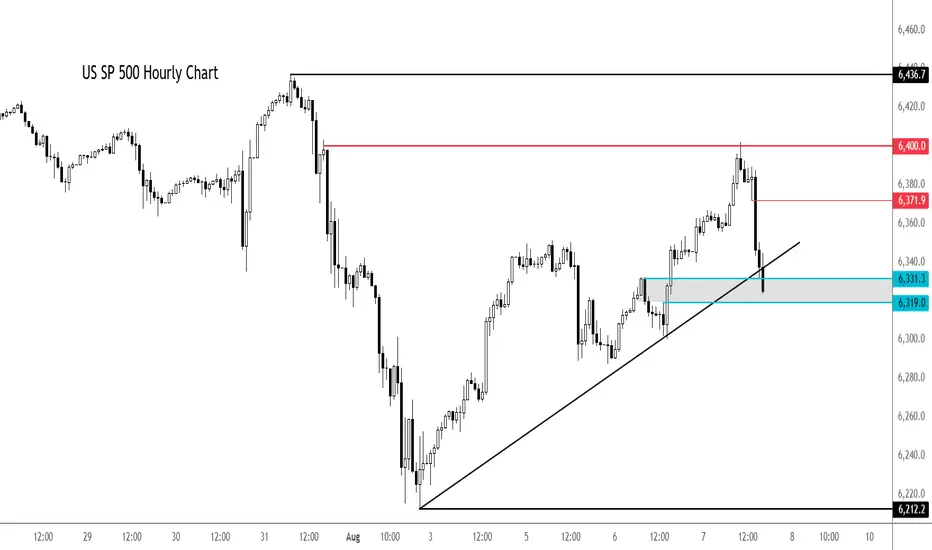
S&P 500 extends drop - can dip buyers come to rescue again?After a decent rally earlier in the day, the major indices and futures started to ease off around mid-morning London trade, before easing further lower in the last couple of hours.
At the time of writing, the S&P was testing its session lows. Here it was probing support and a short-term bullish trend line in the 6319-6331 range. This area needs to hold to keep the bulls happy and in charge. Break this and we could see a bigger correction in the days ahead.
Resistance now comes in at 6372 followed by 6,400.
By Fawad Razaqzada, markets analyst with FOREX>com
US500: Rebound Setup After Sharp Pullback – Key Support HoldingUS500 has experienced a strong corrective move after an extended bullish run but is now showing signs of stabilizing near a key support area. This zone aligns with both technical retracement levels and the market's reaction to fundamental shifts—particularly the dovish repricing of the Fed following weak US jobs data.
Technical Analysis (4H Chart)
Pattern: After a strong uptrend, price faced a steep correction, forming a potential short-term reversal setup.
Current Level: 6,235, holding above the 6,217 support zone.
Key Support Levels:
6,217 (immediate support; key defense zone for bulls).
6,171 (38.2% retracement, secondary support if deeper pullback occurs).
Resistance Levels:
6,272 (23.6% retracement and initial resistance).
6,360 (upper resistance zone and retest of recent breakdown).
6,429/6,436 (recent high and target if bullish momentum resumes).
Projection: A rebound from current levels could push US500 back toward 6,360–6,430 if support holds.
Fundamental Analysis
Bias: Neutral-to-bullish as macro drivers favor a recovery from pullback.
Key Fundamentals:
Fed Policy: Weak US jobs (+73K) and downward revisions have solidified rate cut expectations (~75% probability in September), boosting equity sentiment.
Inflation: Market awaits US CPI; softer data would further support equities.
Tariffs: While Trump’s tariffs create a medium-term risk for earnings, immediate Fed easing bets outweigh these concerns.
Risk Sentiment: Global risk remains supported by lower yields and optimism about Fed easing.
Risks:
Hot US CPI could reverse cut expectations, pressuring equities.
Geopolitical risks or tariff escalation could trigger renewed selling.
Key Events:
US CPI and PPI.
Fed speeches and rate expectations.
Earnings reports from key US companies.
Leader/Lagger Dynamics
US500 is a leader, driving global risk sentiment and influencing risk-sensitive assets like AUD/USD, NZD/USD, and JPY crosses.
Summary: Bias and Watchpoints
US500 is neutral-to-bullish, stabilizing at key support (6,217) after a sharp correction. Fed cut expectations and risk-on sentiment support the upside scenario, targeting 6,360–6,430 if US CPI aligns with softer inflation. However, a hot CPI print could invalidate this rebound and trigger another leg lower.

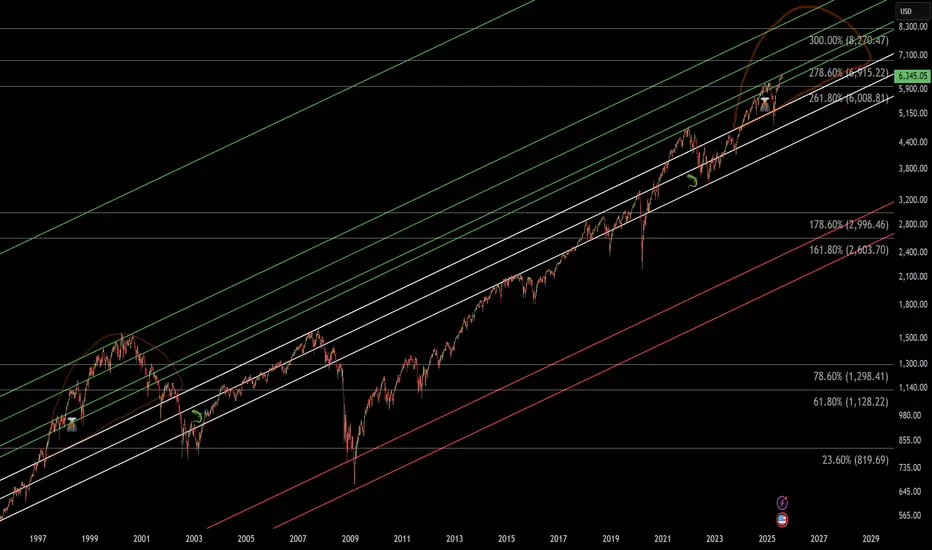
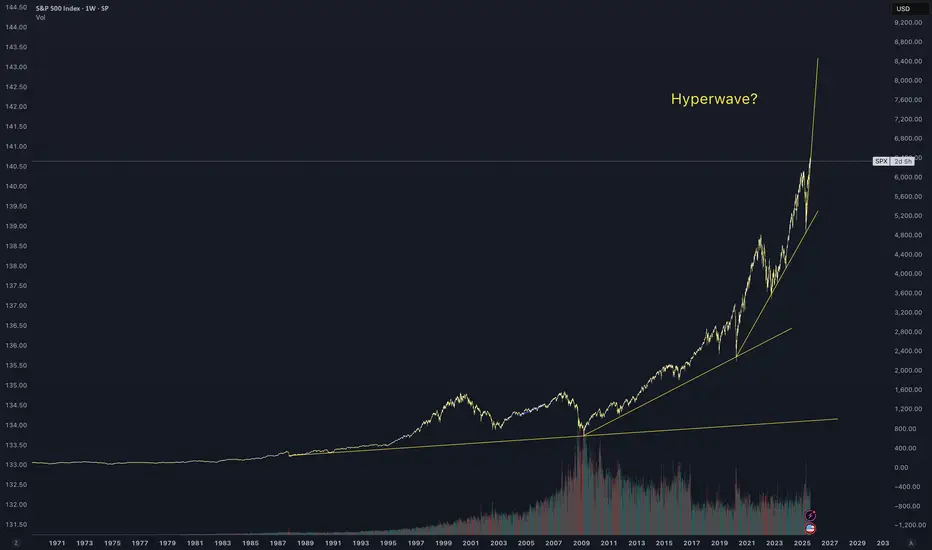
US500 one last leg upI do not want to sound 100% like David Hunter, but I recon max upside in this cycle is approaching and will be somewhere between 7000$ to 7400$, from there a correction of at least 25% is very likely

SPX500 - what's next?Further to my previous idea on SPX.
SPX respected the Resistance at FR 161.8 at 6400.
Price went down and reverted form SMA200 (4H)
Now price has completed the Perfect Gartley Pattern and reached point D.
If (against fundamentals) price reverts down from there and breaks down through SMA50 (4h), I will consider it as Bearish Validation and I will expect correction movement, which cen go down to ca 6000.
Just my humble opinion

S&P bullish continuation supported at 6340Tariff Turmoil and Geopolitical Shifts – Implications for S&P 500 Trading
Donald Trump's sweeping new tariffs officially took effect, hitting nearly all U.S. trading partners. Switzerland, facing the steepest rates among developed nations, may retaliate by cancelling a major fighter jet purchase, signaling potential defense-sector implications.
Key developments:
Semiconductor imports to face 100% tariffs, unless production is moved onshore – a bullish signal for domestic chipmakers (e.g., Intel, GlobalFoundries) but negative for firms reliant on overseas fabs.
Additional tariffs floated on China over purchases of Russian oil, echoing similar penalties on India – suggesting growing fragmentation in global trade.
Market impact:
S&P 500 sectors likely affected:
Tech (Semis): Tariff pressure may weigh on multinationals like Nvidia or AMD short term, but benefit domestic fabs and U.S.-based supply chains.
Industrials/Defense: Swiss retaliation could ripple through defense contractors if deals are halted.
Energy/Commodities: Any China-Russia oil tensions could lead to energy volatility, affecting names like ExxonMobil or ConocoPhillips.
Meanwhile, China’s exports unexpectedly rose, softening the blow from the U.S. tariff crackdown. Chinese equity gains could calm broader EM sentiment, helping mitigate global risk-off contagion.
Finally, Trump signaled potential peace talks with Putin and Zelenskiy, with the Kremlin confirming a Putin meeting soon. A diplomatic breakthrough could ease geopolitical risk, supporting investor sentiment and equities globally.
Bottom Line for S&P 500:
Expect sector rotation as traders digest tariff fallout. Watch for:
Strength in domestically focused tech and defense stocks
Caution around globally exposed industrials and semis
Short-term volatility tied to trade rhetoric and geopolitical headlines
Key Support and Resistance Levels
Resistance Level 1: 6437
Resistance Level 2: 6480
Resistance Level 3: 6520
Support Level 1: 6340
Support Level 2: 6295
Support Level 3: 6256
This communication is for informational purposes only and should not be viewed as any form of recommendation as to a particular course of action or as investment advice. It is not intended as an offer or solicitation for the purchase or sale of any financial instrument or as an official confirmation of any transaction. Opinions, estimates and assumptions expressed herein are made as of the date of this communication and are subject to change without notice. This communication has been prepared based upon information, including market prices, data and other information, believed to be reliable; however, Trade Nation does not warrant its completeness or accuracy. All market prices and market data contained in or attached to this communication are indicative and subject to change without notice.

S&P 500 Futures Hold Ground After Tariffs Take EffectS&P 500 Futures Rise After New Tariffs Kick In
President Trump's sweeping tariffs officially took effect just after midnight, escalating trade tensions with dozens of countries. While negotiations are ongoing behind the scenes to secure exemptions and reduce tariff rates, market reactions are already underway.
Technical Outlook
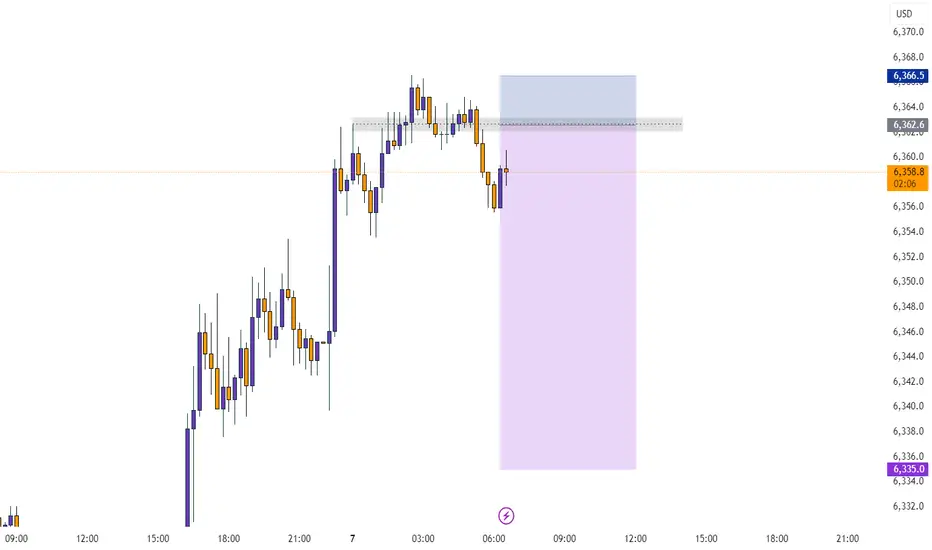
S&P 500 Futures continue to show bullish momentum as long as price trades above 6289, with the potential to retest the All-Time High (ATH).
To confirm a move toward 6453, price must close above 6437 on the 1H chart.
🔻 However, if the price stabilizes below 6389, a correction toward 6365 becomes more likely.
Key Levels:
🔹 Resistance: 6424 – 6453
🔹 Support: 6365 – 6341

SHORT ON SPX/USDSpy has created a Double top followed by a CHOC and retest to the downside.
Their is plenty sell side liquidity to be collected as I expect a major drop on spy.
Looking to catch 300-400 points on SPY.

SPY Pull back into another earnings week?An engulfing weekly candle is no joke. Sellers are in control.
There is a strong possibility of a pull back and with bias being short, I am looking for a strong LH on the 1/2HR TF to form at 6330 as 50% or 6370- 6375 near the weekly POC.
Confluences for Pull back scenario
- Price bounced off 38.2% fib from 5930 to ATH
- Price found support at 200 ema on 4HR
- 1 HR MACD is building up bullish signal
Have a great week all!

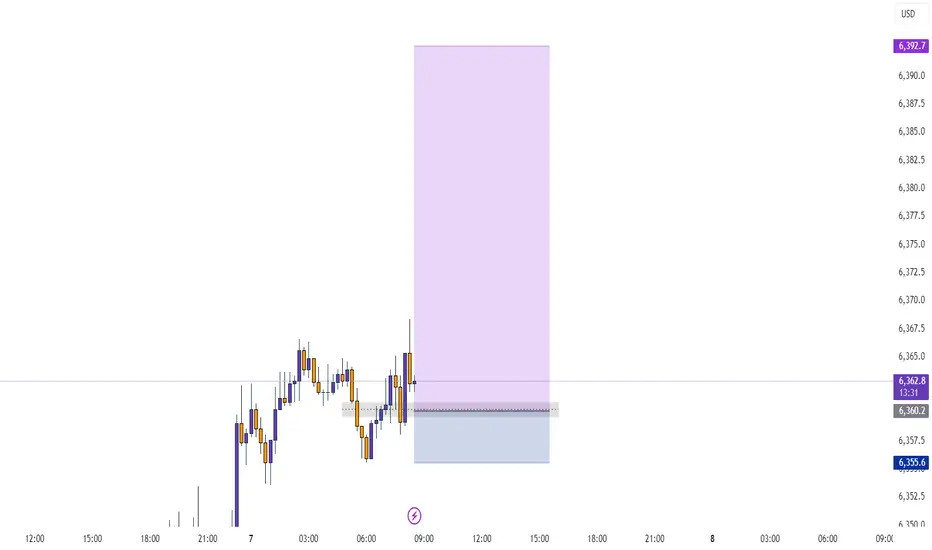
Decision pointThe weakness of the trend is clearly visible, but we need to see how it reacts to the channel’s midline. If buying pressure increases, the price could reach 6400. Otherwise, a correction down to around 6330 is likely.
SPY - Final InningTo understand where you're headed you must understand where you came from
Marketwide history in the making
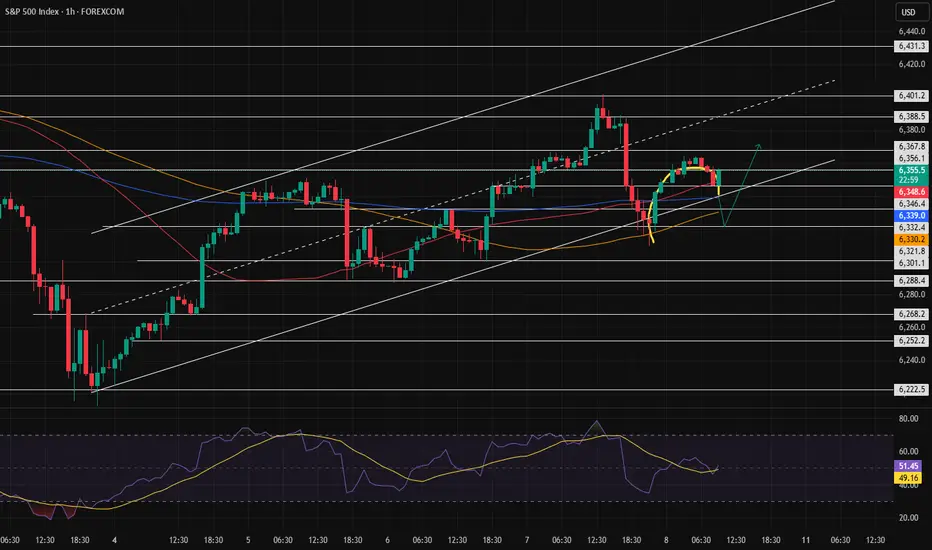
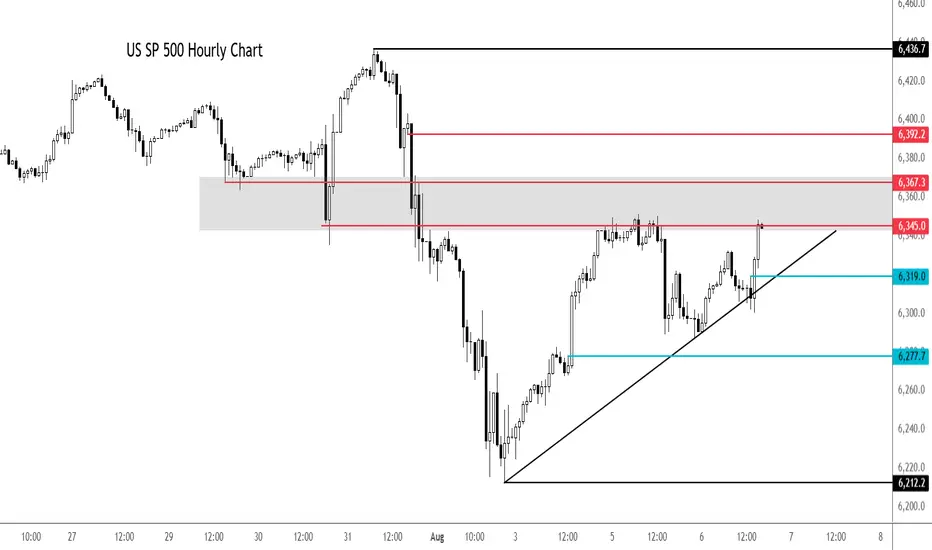
S&P 500 extends rally despite macro concernsThe 5% Apple rally aside, it is all about rate cut bets vs. strong earnings. So far, the latter has helped to keep US markets supported near all-time highs. But if macro concerns increase further, investors' perception about future earnings growth will weaken. And with that, we could see some cracks in expensive stocks.
Looking at the hourly chart of the SPX500, the US benchmark was testing a potential resistance zone in the shaded region between 6345 to 6367, an area which was previously support. Above this zone, 6392 is the next level of potential resistance and then the all-time high of 6436 comes into focus next.
earlier, the index bounced after a failed breakdown below the trend line shown on the chart. Another potential test of the trendline could see the index break lower. Short-term support is seen around 6319 then 6277.
By Fawad Razaqzada, market analyst with FOREX.com
US500 Market Insight US500 Market Insight
The US500 continues to demonstrate resilience amid a complex macroeconomic backdrop, trading around 6,388 at mid-session today. This represents a modest 0.40% recovery from the previous close of 6,299, signaling improving investor sentiment despite ongoing market headwinds.
Fundamental Outlook: Market Resilience Amid Volatility
After a stretch of choppy trading sessions driven by mixed U.S. economic data and escalating tariff concerns, the index has regained its footing above the psychologically important 6,300 support level. This bounce reflects investor confidence in the broader market’s fundamentals, particularly in the face of global policy uncertainties.
Strong Corporate Earnings as a Key Driver
Earnings season has delivered notable upside surprises, particularly in the technology, consumer discretionary, and financial sectors. Positive forward guidance and robust profit margins have underpinned the index’s strength, helping offset negative sentiment from trade related headlines and slowing global demand in select sectors.
Dovish Federal Reserve Expectations
Markets are increasingly pricing in a more accommodative stance from the Federal Reserve, even as policymakers continue to stress a data dependent approach. With inflation surprising on the upside and NFP data coming out softer, this is reinforcing expectations for possible rate cuts later in 2025. This has eased pressure on equities and boosted appetite for risk assets.
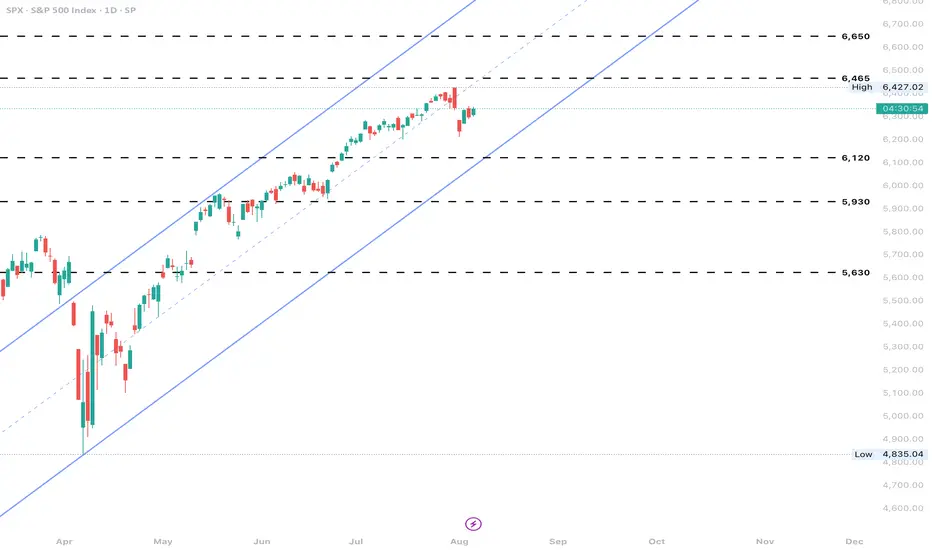
Technical Outlook: Bullish Continuation
From a technical perspective, the US500 remains in a well defined long-term uptrend. Maintaining price action above 6,300 strengthens the case for further gains, with 6,400–6,500 seen as the next potential resistance zone. Keep watching for consolidation above 6,300 to confirm breakout momentum.
Key Risks and Market Sensitivities
Despite the positive bias, risks remain. The index remains highly sensitive to global trade developments, particularly US-China and US-EU tariff disputes. In addition, any shift in Fed tone or unexpected inflation data could trigger renewed volatility.
Conclusion
The US500’s current recovery reflects a careful balance of strong earnings, improving rate outlook, and technical support. While bullish sentiment persists, the path forward will likely remain data driven and headline sensitive, requiring traders to remain nimble. A sustained break above 6,400 could open the door to new highs later this quarter, but near-term volatility should not be discounted.
Analysis by Terence Hove, Senior Financial Markets Strategist at Exness
SPX BUY SPOT 8/61h had a unicorn setup I seen forming yesterday. Today I got on just after 7:30 am and saw price inside POI/IPA. All it did was WICK that gap, not fill it. I went against the 4h and 1h candles both being bearish because price reacted to the OPEN of the FVG. This makes it risky because we could still fill and sweep below that wick. Just had a little FOMO this morning once the reaction happened. No major news until tomorrow. I love the sweet spot where price is. Perfect HL area on 1 hour even tho we can sweep lower again, we shall see!

SPX500 in Focus – Breakout Needed Above 6346SPX500 – Technical Overview
The price is currently showing bearish momentum as long as it remains below 6341 and 6323, with a downside target at 6283.
🔻 As long as the price trades below 6341, the bearish bias remains intact.
🔼 For the trend to shift bullish, we need a confirmed 1H close above 6346, which could open the path toward 6365 and higher.
🔹 Resistance: 6341, 6365, 6389
🔹 Support: 6298, 6283, 6247

Potential bearish drop?S&P500 is rising towards the pivot, which is a pullback resistance that aligns with the 61.8% Fibonacci retracement and could drop to the 1st support.
Pivot: 6,362.20
1st Support: 6,214.78
1st Resistance: 6,436.72
Risk Warning:
Trading Forex and CFDs carries a high level of risk to your capital and you should only trade with money you can afford to lose. Trading Forex and CFDs may not be suitable for all investors, so please ensure that you fully understand the risks involved and seek independent advice if necessary.
Disclaimer:
The above opinions given constitute general market commentary, and do not constitute the opinion or advice of IC Markets or any form of personal or investment advice.
Any opinions, news, research, analyses, prices, other information, or links to third-party sites contained on this website are provided on an "as-is" basis, are intended only to be informative, is not an advice nor a recommendation, nor research, or a record of our trading prices, or an offer of, or solicitation for a transaction in any financial instrument and thus should not be treated as such. The information provided does not involve any specific investment objectives, financial situation and needs of any specific person who may receive it. Please be aware, that past performance is not a reliable indicator of future performance and/or results. Past Performance or Forward-looking scenarios based upon the reasonable beliefs of the third-party provider are not a guarantee of future performance. Actual results may differ materially from those anticipated in forward-looking or past performance statements. IC Markets makes no representation or warranty and assumes no liability as to the accuracy or completeness of the information provided, nor any loss arising from any investment based on a recommendation, forecast or any information supplied by any third-party.
