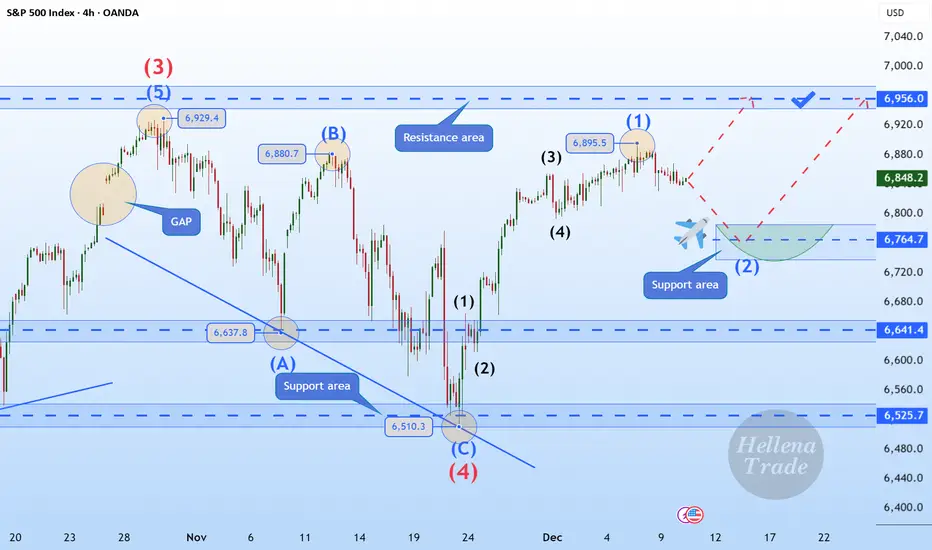
Hellena | SPX500 (4H): LONG to the area of 6956.Hello, colleagues!
I previously published a forecast for an upward movement, and I believe it is time to update the plan slightly. The direction of movement remains the same, but wave “1” has lengthened, which means that the correction in wave “2” may occur slightly higher than previously.
I expec
About S&P 500 Index
Standard & Poor’s 500 is an American stock market index consisting of 500 large companies having common stock listed on the NYSE or NASDAQ and their market capitalizations. It captures approximately 80% coverage of available market capitalization. Because it includes both growth stocks and value stocks it is one of the most followed equity indices and is considered to be one of the best representations of the U.S. stock market and a trend indicator for the U.S. economy. S&P introduced its first index in 1923 and its present day form on March 4,1957. It was developed and continues to maintained by S&P Dow Jones Indices, a joint venture majority owned by McGraw Hill Financial.
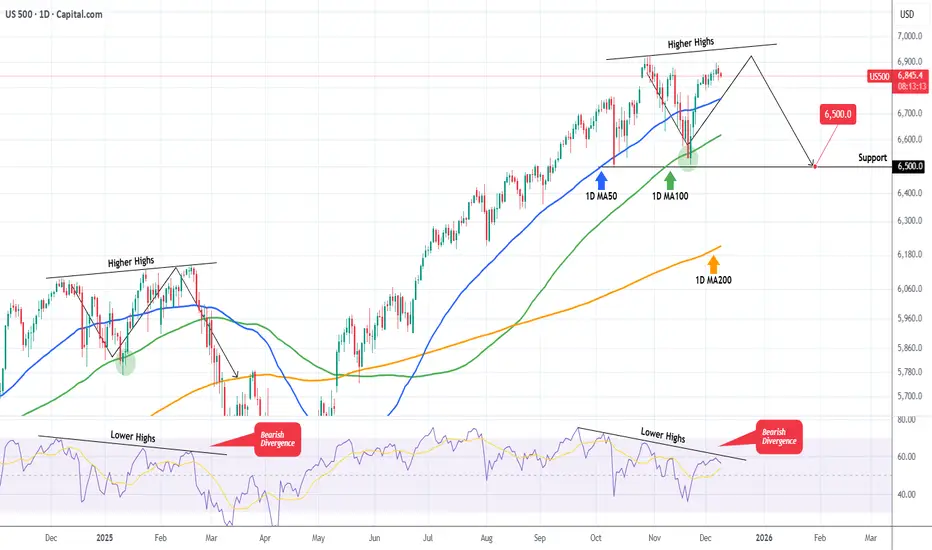
S&P500 The Bearish Divergence that may spoil the party.S&P500 (SPX) is extending a strong rally following the rebound on its 1D MA100 (green trend-line) almost 3 weeks ago. As we pointed out in a previous analysis, the price action of the past 2 months has been identical to the pattern after November 19 2024.
We are currently on the same 1D MA100 rebou
S&P500 Points Toward 7,500—But the Path Won’t Be a Straight LineS&P500 remains structurally bullish on the higher timeframes, and the broader geometry continues to point toward the 7,500 area as a long-term magnet.
However, the market never moves in a straight line — corrective phases, pullbacks, and rotations are a natural part of the path toward higher levels.

S&P 500 Breakdown Alert — Rising Wedge Reversal in Play!Today I want to share an S&P 500 index( SP:SPX ) analysis, as this index plays a major role in guiding correlated markets—especially crypto, and particularly Bitcoin( BINANCE:BTCUSDT ).
The S&P 500 index entered the Potential Reversal Zone(PRZ) and resistance zone($6,902_$6,875), where it began to

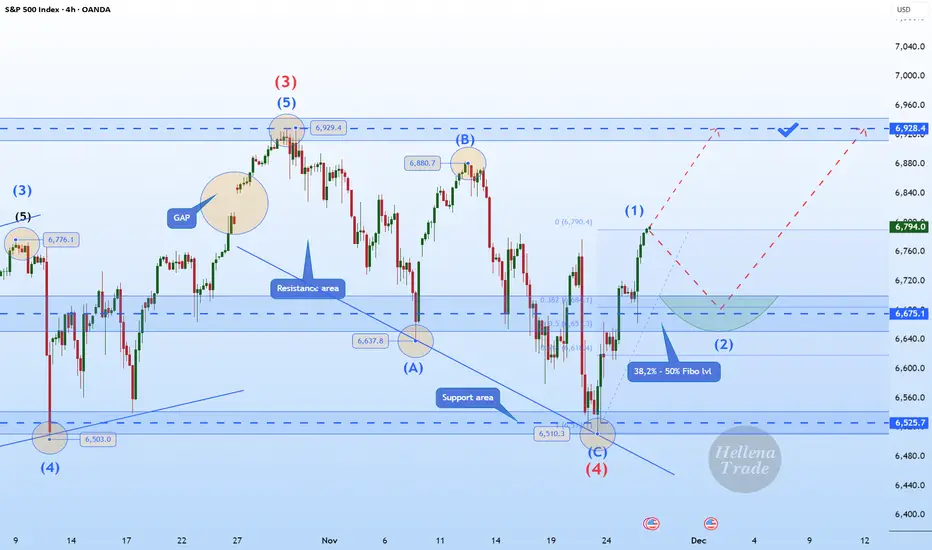
Hellena | SPX500 (4H): LONG to MAX of wave "3" of 6928.Colleagues, we continue the previous scenario of upward movement in the impulse “12345”.
I expect a small correction in the middle order wave “2” approximately to the area of 38.2%-50% Fibonacci levels (6675).
Then I expect a continuation of the upward movement to the maximum of the wave "3" of the
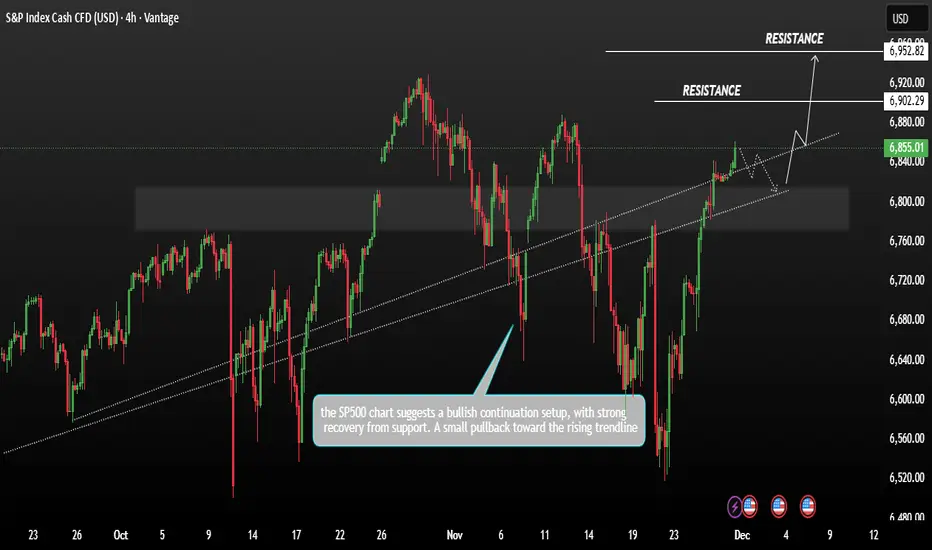
SP500 Consolidation bullish momentumSP500 showing price action between late September and early December the SP is trading around 6,855 after a strong upward move recent candles show bullish momentum pushing above a previously broken trendline.
The S&P 500 rose on Friday, pushing it close to its record high. A strong November rally,
S&P 500: Last Bullish Push
On the medium-term horizon OANDA:SPX500USD AMEX:SPY CME_MINI:ES1! still looks like a clean impulse:
Wave 3 shows a classic extension
Wave 2 is a sharp zigzag
Wave 4 has the structure of a flat – a running flat on S&P, while Nasdaq 100 forms something closer to an EFL
Connecting waves 1–3 an

SPX500 | Bulls Target 6957 as Breadth Improves Beyond AISPX500 – Technical Overview
The S&P 500 has reached a new record high, notably without support from AI-related stocks.
Despite underwhelming earnings from Oracle and Broadcom, the broader market continued to rally—an encouraging sign that sector leadership may be broadening rather than relying sole

Support under 6800 likely holdsI don't think the market is acting bearish enough for a further move down under 6750 right now. We are most likely in a trading range for a while. Oil testing it's lows. BTC looks bearish. Gold looks bullish.

SPX Is going up...time to buySPX 500 is in a clear upwards channel and has broken the last bit of resistance (white trendline line shown) - this is a clear confirmation that the next target will be the next resistance zone to the upside shown above (this is a great buy trade opportunity) - buy the SPX 500 now

See all ideas
Displays a symbol's price movements over previous years to identify recurring trends.
Frequently Asked Questions
S&P 500 Index reached its highest quote on Oct 30, 2025 — 6,921.9 USD. See more data on the S&P 500 Index chart.
The lowest ever quote of S&P 500 Index is 665.6 USD. It was reached on Mar 6, 2009. See more data on the S&P 500 Index chart.
S&P 500 Index is just a number that lets you track performance of the instruments comprising the index, so you can't invest in it directly. But you can buy S&P 500 Index futures or funds or invest in its components.