SPX to Money Supply WARNING!If the charts aren’t showing bubble setups, I’m not going to invent them. I post what the data shows. So please don’t shoot the messenger when I say GTFO & STFO.
And just to keep the facts straight:
Brokerage, stock, and crypto accounts are not part of M2.
Why does M2 matter?
It’s the actual spendable money in the economy.
When M2 grows faster than real output (as it did in 2021), price pressure builds.
The economy runs on liquidity.
Retail, goods, services all of it requires money you can actually spend, not paper gains in a trading account.
When the S&P 500 disconnects massively from M2 — like during the dot-com bubble — revenue and profit growth can’t keep pace. Valuations expand purely on speculation, not on real, organic fundamentals. That’s how multiples stretch and bubbles form.
The problem? Most retail traders have no idea this is happening. They’re trading with their hair on fire, following cute social-media stories dressed up as “analysis,” using strategies that have never been tested in real markets.
And that’s exactly how bubbles are fed:
big players sell into retail euphoria, and retail ends up holding the bag of schitt!
Buy when stocks are cheap, not at all-time highs in euphoria land.
"Price is what you payt, VALUE is what you get!"
THANK YOU for getting me to 5,000 followers! 🙏🔥
Let’s keep climbing.
If you enjoy the work:
👉 Drop a solid comment
Let’s push it to 6,000 and keep building a community grounded in truth, not hype.
Trade ideas

S&P 500 4H: Trendline SHATTERED! Bullish Revival or Bear Trap? Following the formation of a Higher High (HH) ↗️, the market entered a correction and later established a Higher Low (HL) ↗️, confirming the continuation of the bullish structure on the 4-hour timeframe.
Subsequently, price entered a consolidation phase below a descending trendline, and early signs of a breakout (Trendline Break) 📈 are now visible.
Currently, price is in the After Break phase following the trendline breakout. However, a structured and confirmed pullback to establish a definitive HL has not yet been observed — marked on the chart as HL?.
🔑 Key Chart Areas
Resistance Zone (Ceiling Range) 🧱
The upper chart range where a Fake Breakout could occur.
Entry into this zone without strong breakout momentum may be a market trap (fakeout), potentially pushing price back into the range.
Marked as a No Trade Zone 🚫 — avoid entering trades until price decisively breaks this area with strong volume & a solid closing candle.
Major Support Zone 🛡
Key support is identified around 6768.
A confirmed break below this zone, followed by a pullback to it, would activate a bearish scenario, shifting the market into an After Break (bearish) phase.
In this case, a decline toward the previous low (marked at the bottom of the chart) is likely.
📈 Bullish Scenario
For the uptrend to continue:
Price must exit the resistance zone with a strong breakout candle closing above it.
The broken resistance should then hold as support (Flip).
Following this, an advance toward higher targets is expected, reactivating the medium-term bullish structure.
📉 Bearish Scenario
If support at 6768 breaks:
The market will enter a new bearish structure.
A pullback toward the broken support is likely, followed by a resumption of the decline.
The next target would be the major low zone at the bottom of the chart.
What’s your take on the next move? 📝 Share your thoughts below! 👇
Disclaimer ⚠️: Financial markets are highly volatile. Always educate yourself, learn, and study the market before entering any buy or sell positions.

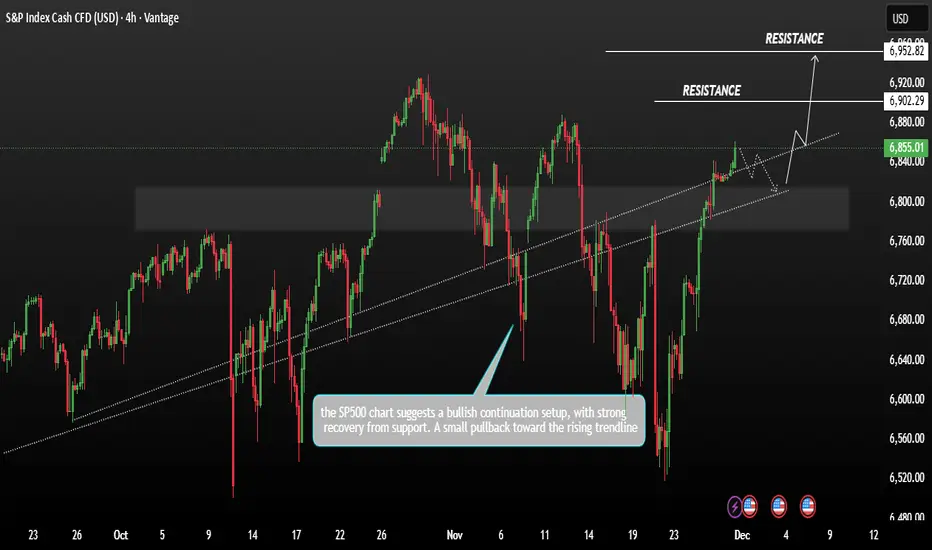
SP500 Consolidation bullish momentumSP500 showing price action between late September and early December the SP is trading around 6,855 after a strong upward move recent candles show bullish momentum pushing above a previously broken trendline.
The S&P 500 rose on Friday, pushing it close to its record high. A strong November rally, fuelled by investor optimism over potential Federal Reserve interest-rate cuts, has continued to lift stocks.
Technically, if the price maintains its bullish zone within the current range, we could expect further upward movement. The next major resistance zone is projected at 6902–6952.
You may find more details in the chart,
Trade wisely best of luck buddies.
Ps; Support with like and comments for better analysis thanks for supporting.
FRIDAY SELL SIDE LIQUIDITY CLEARANCE!Sell side liquidity has been building since the beginning of this week, Monday, 1st December. My expectation is that the market shall end the week, firstly by moving higher, a Judas Swing, to sweep buy side liquidity at the Daily Level. Then reverse sharply and descend to take out the entire week's liquidity on the downside built up from Monday.
This would be such a beautiful execution. It makes so much sense to me for price to move this way. If not, hey, I am always happy to learn from any flawed analysis I make!
Good luck tomorrow!

Moving dayThe market made a high in futures at about 9am, so to confirm it in cash would be most probable. Either way I think this market is about to drop. Gold can go higher still to test it's highs. Oil looks bearish still. BTC may be done correcting. Natural Gas looks like a short still.

SPX500: Bullish Push to 6927?As the previous analysis worked exactly as predicted, FX:SPX500 is eyeing a bullish breakout on the 4-hour chart , with price rebounding from a key support zone near recent lows , converging with potential entry area that could ignite upside momentum if buyers defend against dips. This setup suggests a continuation opportunity amid the ongoing uptrend, targeting higher resistance levels with favorable risk-reward.🔥
Entry between 6700–6720 for a long position. Targets at 6880 (first), 6927 (second). Set a stop loss at a close below 6643 to limit exposure, yielding a risk-reward ratio of approximately 1:2 to first target and up to 1:2.5 overall. Monitor for confirmation via a bullish candle close above entry with rising volume, leveraging the index's resilience near ATH.🌟
Fundamentally , the S&P 500 is pushing toward new highs in November 2025, driven by bets on Fed rate cuts and strong global demand, though underlying issues like market concentration (top 10 companies over 40% of the index) and recent weekly dips (~2%) highlight volatility. Positive factors include liquidity, consumer strength, and earnings growth, with forecasts eyeing upside to 7000 amid election stability and AI investments. 💡
📝 Trade Setup
🎯 Entry (Long):
6700 – 6720
🎯 Targets:
• TP1: 6880
• TP2: 6927
❌ Stop Loss:
• Any 4H candle close below 6643
⚖️ Risk-to-Reward:
• ~1:2 to the first target
• Up to 1:2.5 if full target is hit
👇 Share your thoughts below! 👇

S&P vs CryptoThe S&P is completing its cycle, and after that it is expected to correct to the specified levels, followed by a correction in Bitcoin as well.
btc
BAT is correcting toward the specified levels after completing its flag pattern
Most other coins are also mimicking Bitcoin’s behavior
link

S&P500 Idea FOMCBias until Dec FOMC:
We will be looking to continue to ride the Fed rate cuts odds increased on the markets as that is still holding most weight at the moment and will most likely continue to do so until the FOMC decision on 11 December.
The markets have been primarily pricing in the rate cut expectations 30 days well before the actual FOMC decision, there during the actual Rate decision release, we barely get any impact and we get markets repositioning for any future guidance to come. Basically a case of ‘Buy the rumour and Sell the news’’ play.
- Because at the moment, we have been seeing rate cut probabilities increasing to 85% which has been holding most weight for Gold upside and giving the greedy intuitions a reason to further buy up risk assets.
However,
- This doesn't mean that Dec is a guaranteed rate cut, and during the December FOMC, the fed may either cut rates by 25bps or Hold rates, and if there future guidance remarks are hawkish since inflation is still elevated - then we can see Profit taking on risk assets. Therefor expect to see Gold bears, DXY bulls, BTC Bears, Stock bears.
So until the actual December FOMC, If December Rate cut probabilities are still elevated (80%+), then, we can still expect Buyers in control on Risk assets, so:
- DXY - Downside.
- GOLD - Upside , potentially retest upto previous ATH’s $4380’s. Then Profit taking post FOMC.
- US Stocks - Upside on SPX to make New ATH’s and bearish wave if Dec FOMC hawkish.
- BTC - Upside to 100k, prev supply zone before Correction bearish phase.
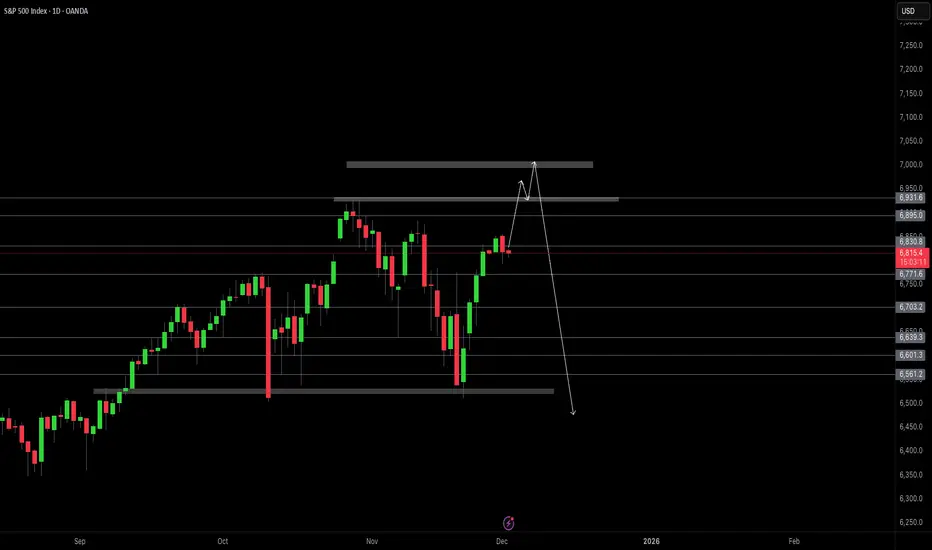
S&P500 Points Toward 7,500—But the Path Won’t Be a Straight LineS&P500 remains structurally bullish on the higher timeframes, and the broader geometry continues to point toward the 7,500 area as a long-term magnet.
However, the market never moves in a straight line — corrective phases, pullbacks, and rotations are a natural part of the path toward higher levels.
For now, the bullish structure is intact, momentum is aligned, and the macro trend still supports a continuation to the upside.
I’ll update the intermediate reaction zones and key levels in the next chart.

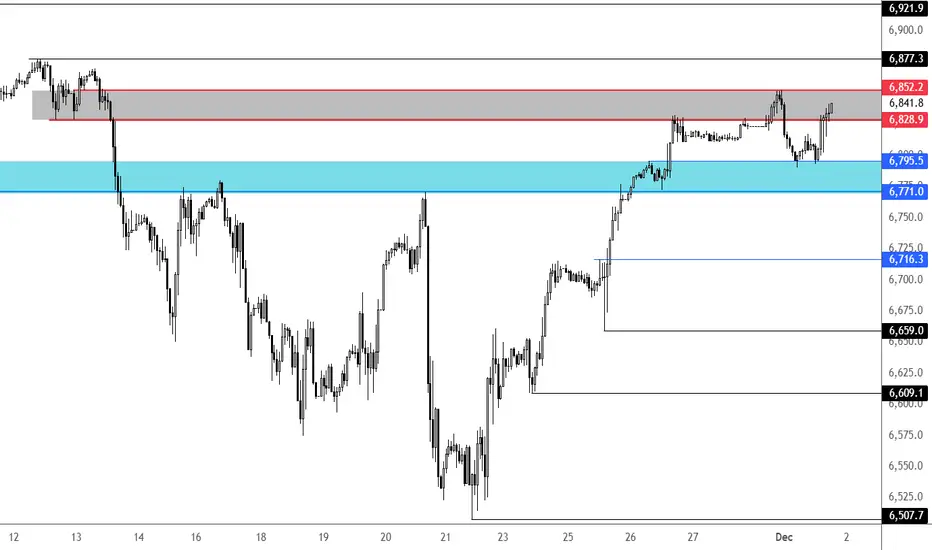
S&P 500 key levels to watchUS indices have managed to bounce nicely off their overnight lows, despite concerns about the yen-funded carry trade unwind and crypto selling. The S&P has now entered a key inflection point again, near 6840-52 area; let's see whether the bulls will be able to reclaim this zone and kick on from there, or whether the selling resumes. Shaded blue area is the key support zone to watch between 6771-6795; bearish if we go below there.
Fawad Razaqzada, market analyst with FOREX.com
S&P500 Next stop.. 6925The S&P500 index (SPX) is about to complete the Right Shoulder of the Inverse Head and Shoulders (IH&S) pattern that took it from the bottom of the 1D MA100 (green trend-line) contact to having recovered the 0.786 Fibonacci level of the whole correction.
The next technical Target is of course the 6925 All Time High (ATH). Since however we are about to form a 4H MA50/100 Bullish Cross, a technical pull-back is expected as both previous such crosses since August 13, resulted into a short-term Top.
If the IH&S completes its technical expansion, then after this correction, a test of the 2.0 Fibonacci extension at 7200 is possible.
---
** Please LIKE 👍, FOLLOW ✅, SHARE 🙌 and COMMENT ✍ if you enjoy this idea! Also share your ideas and charts in the comments section below! This is best way to keep it relevant, support us, keep the content here free and allow the idea to reach as many people as possible. **
---
💸💸💸💸💸💸
👇 👇 👇 👇 👇 👇

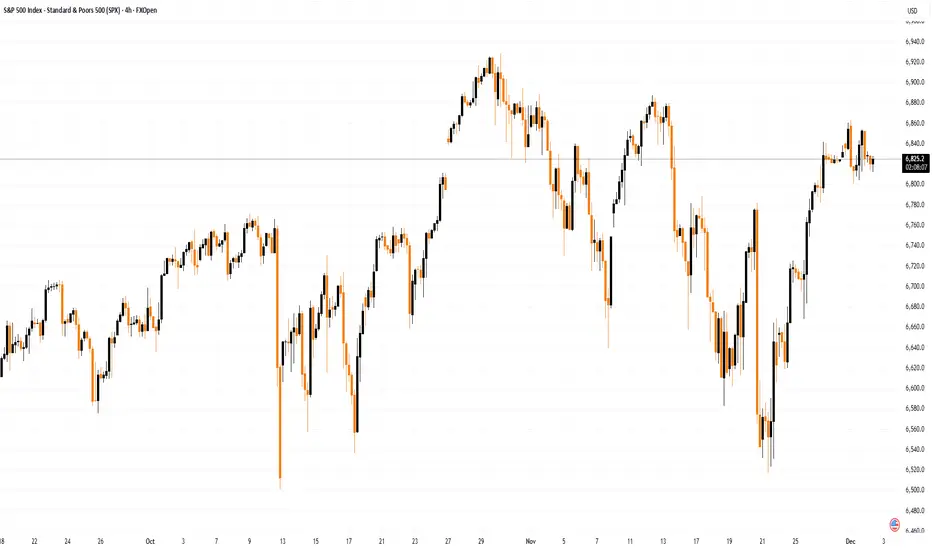
S&P 500 Index: Early December Chart AnalysisS&P 500 Index: Early December Chart Analysis
December is traditionally a favourable month for the S&P 500 :
→ Since the 1950s, December has ended higher in over 70% of years.
→ Average monthly gain is around +1.0%.
Will the index rise in 2025? Much depends on the Federal Reserve meeting on 10 December, as well as other factors, including geopolitical developments. Interest is also piqued by an upcoming statement from Trump at the White House (today, 22:00 GMT+3), though the topic remains undisclosed.
Technical Analysis of the S&P 500 Chart
Demand-side perspective:
→ The rebound from November’s low was aggressive, rising roughly +5% in 10 days.
→ Price climbed above the blue trendline that has acted as support since summer.
→ The recent dip (marked by the red trajectory) could be a temporary correction, forming a Bull Flag pattern.
Supply-side perspective:
→ The red trajectory has not yet been breached.
→ Recent price movements show a strong bearish Head and Shoulders pattern, along with signs of a Quasimodo formation, emerging around the attempt to break the upper boundary.
In the short term, the former resistance at 6785 may now act as support. Overall, the S&P 500 is likely to adopt a wait-and-see stance, adjusting as economic news, delayed by the government shutdown, is released.
This article represents the opinion of the Companies operating under the FXOpen brand only. It is not to be construed as an offer, solicitation, or recommendation with respect to products and services provided by the Companies operating under the FXOpen brand, nor is it to be considered financial advice.
Bulls Hang Tough - US Data and Holiday Trading Make or BreakThanksgiving week delivered a nice rally to help November finish higher than October
It's now December and we have a myriad of US News hitting the headlines before Christmas and New Year's bring us into 2026
ADP Non-Farm
US PMI
US Core PCE
Non-Farm
CPI / PPI
FOMC (December Rate Cut Likely)
Price action is truly key. November ended with a nice stable rally with broad market pumps encouraging an equal weight comeback trade for now (nearly 60% of S&P stocks > 50 period moving average, and 60% of S&P stocks > 200 period moving average)
If the markets avoid a major slip or disruption to end the year, animal spirits may remain optimistic enough to keep the party going in 2026 and continue to climb the wall of worry as sentiment remains pessimistic
US Market Key Levels
1) Oct 10 and Nov 20 candle lows
2) 200 period moving average
3) February 2025 all-time highs area
Sector rotation is pretty clear. Broader market rotation is pretty clear, but overall the markets need to continue to show stable and steady earnings growth and trends and keep the AI narrative glowing with a positive outlook

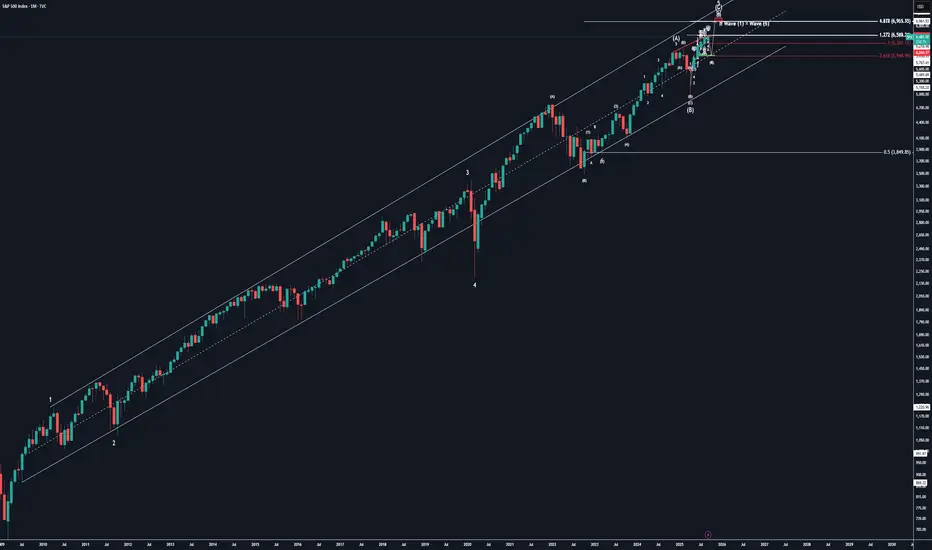
SPX 1M Since 2009 SimplifiedWe are currently in wave 5 of this supercycle which we anticipate completion of @ $6,960-$6,965
$SPX Break Above Trendline, ATH ComingSPX came down earlier this Asian session, hit my algo bias zone low at 6794 and is now back to trendline resistance. Breaking above and holding above the trendline will bring us to new ATH and 6980.

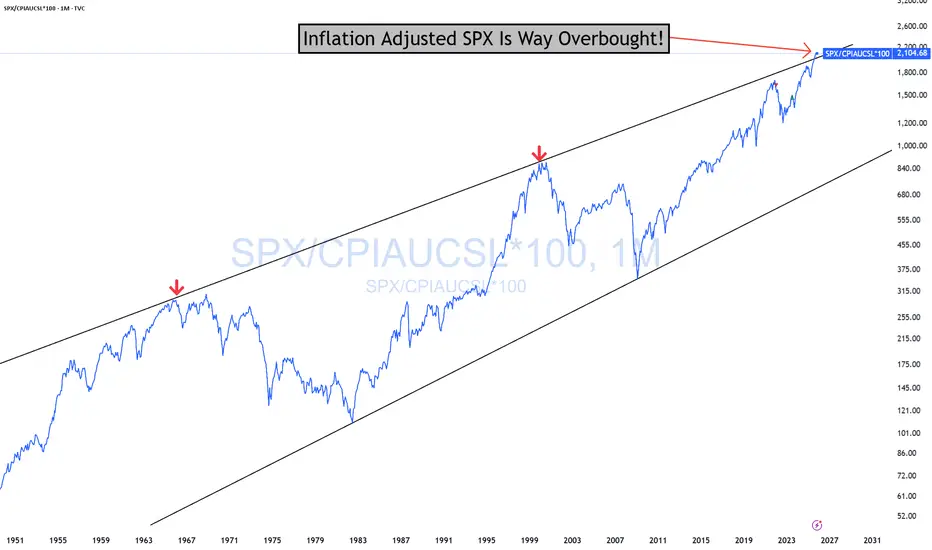
SPX Overbought In Real Terms WARNING!SPX Overbought In Real Terms (Inflation-adjusted) Stripping away inflation shows you the "real" value of SPX.
This is not something you will likely see again in your lifetime. We have only been this overbought twice before since 1947! Both times, what followed was a bear market. You are far more likely to see the price hit the bottom of the channel in your lifetime.
As is always the case, no one will want to touch stocks then. Rest assured, I, for one, will be buying up a storm then.
You have all been WARNED!
GTFO and STFO!
Risk Management is paramount!
THANK YOU for getting me to 5,000 followers! 🙏🔥
Let’s keep climbing.
If you enjoy the work:
👉 Boost
👉 Follow
👉 Drop a solid comment
Let’s push it to 6,000 and keep building a community grounded in truth, not hype.
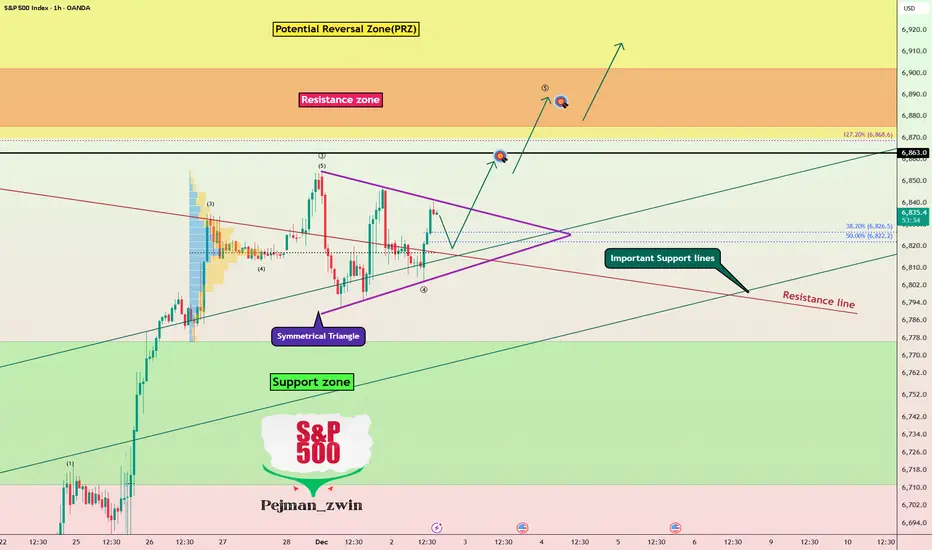
S&P 500 index Bull Run Continues — Symmetrical Triangle BreakoutThe S&P 500 index( SP:SPX ) has shown solid bullish momentum over the last 7 trading days, gaining more than +5% during this period.
The S&P 500 has once again moved back above Important Support lines, and it now appears to be breaking through a resistance line as well.
From a classical technical analysis perspective, the S&P 500 seems to be moving inside a symmetrical triangle pattern.
From an Elliott Wave standpoint, the S&P 500 looks to be completing Wave 4. A confirmed breakout above the upper line of the symmetrical triangle could validate the end of Wave 4.
I expect the S&P 500 to continue its upward movement and extend toward the Potential Reversal Zone(PRZ) and the Resistance zone ($6,902_$6,875).
What’s your view on the S&P 500 index and the broader U.S. stock market?
First Target: $6,859
Second Target: $6,887
Stop Los(SL): $6,774(Worst)
💡 Please respect each other's opinions and express agreement or disagreement politely.
📌S&P 500 Index Analyze (SPX500USD), 1-hour time frame.
🛑 Always set a Stop Loss(SL) for every position you open.
✅ This is just my idea; I’d love to see your thoughts too!
🔥 If you find it helpful, please BOOST this post and share it with your friends.
SPX - H4 - SELL SETUP - Supply Retest confirmedSPX has entered bear market territory last month and I expect a continuation to the downtrend from here onward. Based on many different macro indicators such as credit default swaps on big tech, macro regimes, sentiment and technical analysis. I see SPX falling off the clip from this precise supply zone

SPX: Investors bet on December's cutDuring Thanksgiving week, markets were in a positive, holiday mood, bringing US equities to higher grounds. The S&P 500 had a five-day positive streak, moving from 6.530 up to 6.850 points on Friday. The mood among investors has shifted again back toward a more risk-on stance, as the market is now about 80% confident that the Fed will cut interest rates at December FOMC meeting. Many stocks included in the index are now trading at new all time highest levels, some of which are General Motors, Hilton Worldwide, Walmart stores.
Tech companies also gained during the previous week, as confidence in AI was restored supported by some promising macro developments. Meta was one of the biggest winners, surging around 9% for the week. Microsoft was traded higher by more than 4%, however, Nvidia continues to lag in gains. Company shares continued to decline, losing around 2% on a weekly basis and highlighting uneven sentiment among the tech sector.
The week ahead brings PCE data for September. This indicator is the Fed's favourite inflation gauge, in which sense, Friday might bring some higher volatility. Nervousness will be increased, considering that these data will be taken into account by FOMC members when voting for a rate cut. On the opposite side, starting with the week ahead, we are entering into the last trading month of the year, when investors are seeking positive sentiment to book yearly profits.

SPX500 – OUTLOOK | Price Action SetupSPX500 – Technical Outlook
Ares Management is drawing attention ahead of the S&P 500’s upcoming rebalancing announcement. Index additions often generate buying pressure as passive funds adjust their holdings, and the broader market sentiment today will be influenced by the ADP employment data.
Technical Analysis
SPX500 continues to show bullish strength while trading above 6844.
As long as price holds above this pivot level, the index is expected to push toward 6888, and a breakout above this zone could extend the move toward 6918.
However, a 1H close below 6844 would signal a bearish correction, targeting 6814 initially, followed by 6771 if downside momentum increases.
Key Levels
Pivot Line: 6844
Support: 6815 · 6771
Resistance: 6888 · 6918

SPX500: Break Above 6815 Could Accelerate GainsOANDA:SPX500USD |Overview
U.S. futures pointed lower on Monday as investors turned cautious following a soft, holiday-thinned trading week.
Despite Wall Street posting its strongest weekly performance since June, the Nasdaq ended November with its first monthly decline since March, as concerns grew over overstretched AI and tech valuations.
Markets are now awaiting remarks from Fed Chair Powell, along with early holiday-spending data, private payrolls, and this week’s key PCE inflation report, which may guide expectations ahead of next week’s policy meeting.
Technical Outlook
SPX500 maintains a bullish momentum while trading above 6771, although a correction from 6815 back toward 6771 is possible before attempting another upward move.
Bullish Scenario:
As long as price holds above 6771, the bullish trend remains intact.
A 4H close above 6815 will confirm continuation toward 6844 and 6888, with potential extension to 6918.
Bearish Scenario:
A 1H close below 6771 will signal the start of a bearish move toward 6713, and possibly 6670.
Pivot Line: 6815
Support: 6771 · 6713 · 6670
Resistance: 6844 · 6888 · 6918

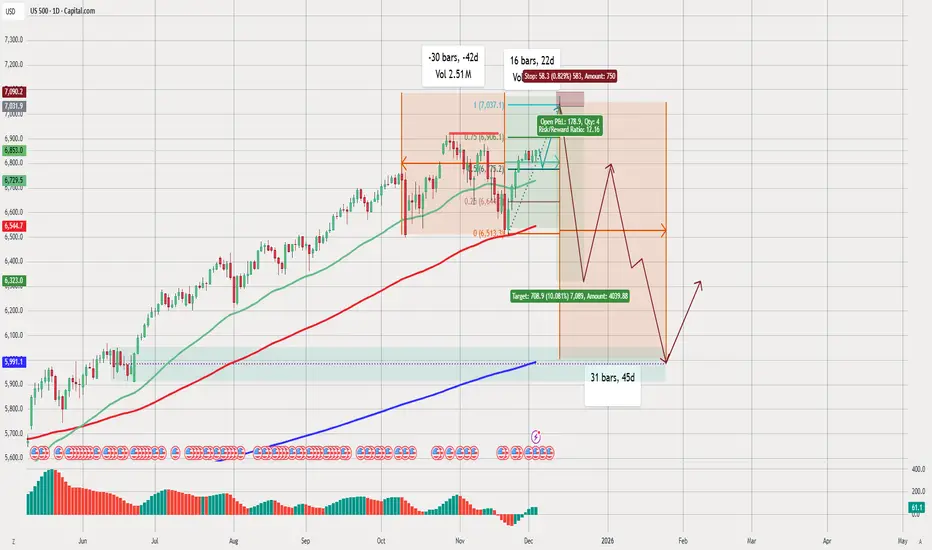
US500 DAILY BUY/SELLTechnical Analysis of the Chart (US500 – Daily Timeframe)
1. Overall Trend
The US500 (S&P 500) is in a strong long-term uptrend, as shown by:
Price trading above the 50-day (green), 100-day (red), and 200-day (blue) moving averages.
Higher highs and higher lows throughout most of the year.
2. Current Market Structure
Sideways / Consolidation Phase
The chart highlights a consolidation box where the price has been moving sideways.
Multiple wicks and uneven peaks indicate market indecision.
The drawn Fibonacci retracement suggests the market has been reacting around the 0.382 and 0.618 levels, which are typical reversal zones.
3. Short-Term Bearish Setup
The highlighted red zone (trade setup) suggests:
A potential short position with:
Entry near recent highs.
Stop-loss above resistance.
Target significantly lower (near the 0.618 – 0.65 Fibonacci region).
The RR (Risk/Reward) ratio is shown as 12:16, which indicates the idea of a large move downward.
Bearish Projection
The brown/red line drawn forward shows:
Expected drop in price.
A possible relief bounce.
Followed by a deeper fall reaching the lower support area.
This move is expected within ~31 bars (45 days).
4. Key Support Levels
Main support zone highlighted at approximately 5991 – 6230.
The 200-day moving average (blue) is far below current levels, meaning:
The market could decline significantly while still staying in a long-term uptrend.
5. Volume & Momentum Indicators
The volume bars show decreasing momentum, which often precedes a reversal.
The histogram at the bottom suggests:
Weakening bullish momentum.
Possible bearish momentum building.
6. Forecast Path (Illustrated in the Chart)
The drawing suggests:
Short-term:
Sharp decline from current resistance.
Mid-term:
A corrective bounce upward.
Another leg down forming a deeper low.
Long-term:
Strong recovery upwards after bottoming.
This is a classic A-B-C corrective pattern.
7. Overall Interpretation
The chart shows the idea that the market may be topping after a strong uptrend.
A correction of around 6–10% could occur before the next major rally.
The setup drawn is speculative but follows common technical structures:
Resistance rejection
Fibonacci retracement
Corrective wave pattern
S&P 500 Daily Chart Analysis For Week of Dec 5, 2025Technical Analysis and Outlook:
In the recent weekly trading session, the S&P 500 Index recorded significant gains, achieving our primary target at the Key Resistance level of 6,895. Presently, this market position indicates potential downward movement, with the primary target set at Mean Support at 6,816, and the possibility of further decline to Mean Support at 6,755.
Nevertheless, it is essential to acknowledge that, in light of the current market dynamics, there exists a considerable probability of a repeat retracement from the Key Resistance at 6,895, accompanied by a robust bounce from Mean Support at 6,816.
