S&P 500 Daily Chart Analysis For Week of August 29, 2025Technical Analysis and Outlook:
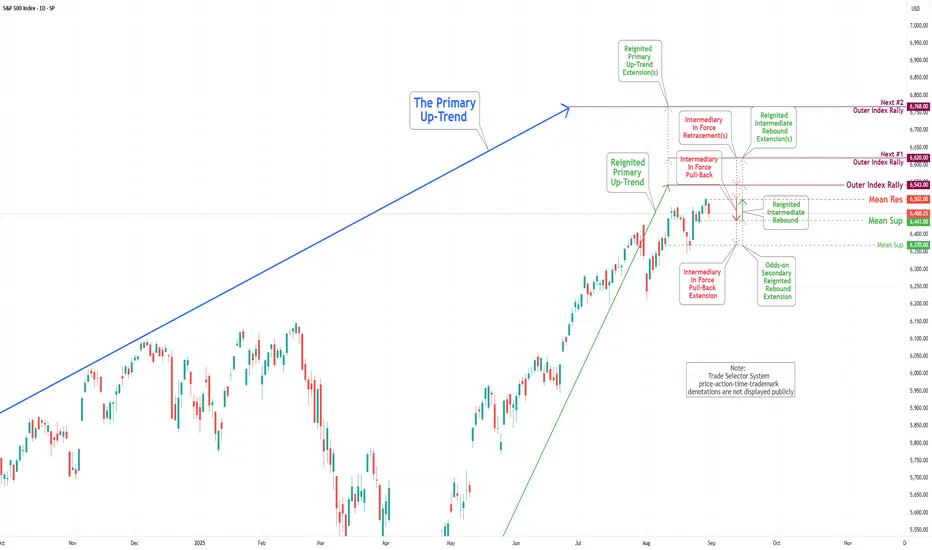
During the trading activities of the previous week, the S&P 500 Index demonstrated significant downward price movements before indicating a recovery. It reestablished its upward trend by retesting the Mean Resistance level of 6470 and trading above this benchmark. Following this, the Index exhibited a strong pivot, leading to the establishment of a new Mean Resistance at 6502.
Currently, the objective is to reach our Mean Support target, set at 6441. It is crucial to acknowledge that once this Mean Support level is achieved, there exists a substantial likelihood of a robust rebound aimed at the long-term target, the Outer Index Rally at 6543, facilitated by the Mean Resistance of 6502. Conversely, there is a potential scenario involving a significant pullback to the Mean Support level of 6370, which an odds-on secondary rebound would follow.
SPX500 trade ideas
Green Energy & Carbon Credit TradingIntroduction
The 21st century has been defined by two monumental shifts: the urgent need to combat climate change and the technological transformation of how we produce, distribute, and consume energy. At the center of these developments lies green energy, a term that embodies renewable, sustainable, and low-carbon energy systems. Alongside it, carbon credit trading has emerged as one of the most innovative market-based solutions for mitigating greenhouse gas (GHG) emissions.
Together, green energy and carbon credit trading form a powerful duo: while renewable energy reduces direct emissions, carbon credit markets provide financial incentives and frameworks for industries and countries to reduce or offset their carbon footprints. Understanding both requires exploring the dynamics of global energy systems, environmental policies, financial markets, and international cooperation.
Part I: Green Energy
1. Defining Green Energy
Green energy refers to power derived from renewable, natural sources that are not only sustainable but also generate minimal or no greenhouse gas emissions during operation. Common forms include:
Solar Power – harnessing sunlight through photovoltaic panels or concentrated solar thermal plants.
Wind Energy – converting wind’s kinetic energy into electricity via turbines.
Hydropower – generating electricity using water flow in rivers or dams.
Biomass & Bioenergy – energy from organic material such as crop residues, wood, or algae.
Geothermal Energy – tapping the Earth’s internal heat for heating or power generation.
Ocean Energy – wave and tidal systems converting marine energy into power.
Green energy distinguishes itself from fossil fuels (coal, oil, natural gas) by being replenishable and having a substantially lower carbon footprint.
2. Drivers of Green Energy Adoption
Several forces are driving the adoption of green energy worldwide:
Climate Change Awareness – Rising global temperatures, sea-level rise, and extreme weather events demand urgent emission reduction.
Energy Security – Countries aim to reduce dependence on imported fossil fuels.
Technological Advances – Falling costs of solar panels, wind turbines, and batteries have made renewables cost-competitive.
Policy Support – Governments incentivize renewables through subsidies, tax credits, and renewable portfolio standards.
Corporate Commitments – Multinationals pledge to shift toward 100% renewable energy (RE100 initiative).
Consumer Demand – Citizens increasingly prefer sustainable energy and products.
3. Global Green Energy Landscape
(a) Europe
The European Union (EU) has been at the forefront, with policies such as the European Green Deal aiming for carbon neutrality by 2050. Countries like Germany (Energiewende), Denmark (wind leader), and Spain (solar power) dominate renewable penetration.
(b) United States
The U.S. has seen a major green energy boom, led by solar and wind, despite political swings. States like California and Texas lead, and the Inflation Reduction Act (IRA, 2022) provides historic renewable energy subsidies.
(c) China
China is the world’s largest investor and producer of solar panels, wind turbines, and EV batteries. Its ambitious goal is to achieve carbon neutrality by 2060.
(d) India
India aims for 500 GW of renewable capacity by 2030, with strong growth in solar and wind, supported by policies like the National Solar Mission.
(e) Rest of the World
Africa shows potential in solar, the Middle East is diversifying from oil into renewables, and Latin America (Brazil, Chile) is expanding hydropower and solar.
4. Challenges in Green Energy
Intermittency – Solar and wind are weather-dependent, requiring backup systems or storage.
Storage – Battery technology is improving but still expensive at scale.
Grid Infrastructure – Old grids need modernization to handle variable renewable energy.
Investment & Financing – Upfront capital costs can be high, requiring supportive financing models.
Land Use & Environmental Concerns – Large solar or wind projects may affect ecosystems.
Policy Uncertainty – Inconsistent policies discourage long-term investment.
Part II: Carbon Credit Trading
1. Concept of Carbon Credits
A carbon credit represents the right to emit one metric ton of carbon dioxide equivalent (CO₂e). These credits are part of market-based mechanisms to reduce greenhouse gas emissions.
There are two key approaches:
Cap-and-Trade Systems (Compliance Markets)
Governments cap total emissions and issue allowances. Companies must hold enough allowances to cover their emissions, but they can trade if they emit less or more.
Voluntary Carbon Markets (VCMs)
Corporations and individuals purchase carbon offsets voluntarily to neutralize their emissions, often funding renewable energy, reforestation, or clean technology projects.
2. Origins of Carbon Credit Trading
The concept was popularized under the Kyoto Protocol (1997), which introduced three flexible mechanisms:
Clean Development Mechanism (CDM) – Developed countries invest in emission reduction projects in developing nations.
Joint Implementation (JI) – Projects between developed countries.
Emissions Trading – Countries with surplus allowances can sell to others.
Later, the Paris Agreement (2015) established a more global framework with Article 6, which enables international cooperation through carbon markets.
3. How Carbon Trading Works
Example:
A cement factory emits 1 million tons CO₂ annually.
Government sets a cap of 800,000 tons.
The factory must reduce emissions or buy 200,000 credits from another company that reduced emissions below its allowance.
This system incentivizes efficiency and low-carbon investment while rewarding overachievers.
4. Compliance Markets vs Voluntary Markets
Feature Compliance Market Voluntary Market
Basis Regulation (laws, caps) Voluntary CSR, sustainability goals
Participants Governments, industries Corporations, NGOs, individuals
Examples EU ETS, California Cap-and-Trade, RGGI Gold Standard, Verra (VCS), Climate Action Reserve
Size Larger, more liquid Smaller but growing rapidly
Objective Meet legal emission targets Achieve carbon neutrality & branding
5. Carbon Credit Standards & Certification
For credibility, carbon credits must meet strict criteria:
Additionality – Reductions wouldn’t have happened without the project.
Permanence – Reductions are long-term (e.g., forests not cut down later).
Verification – Independent third-party audit of projects.
Leakage Prevention – Emission reduction in one area shouldn’t cause increases elsewhere.
Prominent standards include:
Verra’s Verified Carbon Standard (VCS)
Gold Standard (WWF-supported)
Climate Action Reserve
American Carbon Registry (ACR)
6. Criticism & Challenges of Carbon Trading
Greenwashing – Companies may buy cheap offsets instead of real emission cuts.
Double Counting – Same credit claimed by two entities.
Project Integrity – Some projects (like forest offsets) face permanence risks.
Price Volatility – Carbon credit prices vary widely, affecting planning.
Equity Issues – Developing countries may face exploitation if credits are undervalued.
Part III: Intersection of Green Energy & Carbon Credits
Green energy projects often generate carbon credits by displacing fossil fuel energy. For example:
A solar farm replacing coal power saves emissions, generating credits.
A biogas project using agricultural waste reduces methane emissions, creating tradable credits.
Thus, green energy is both a direct decarbonization strategy and a carbon credit revenue generator.
Many corporations purchase renewable energy certificates (RECs) or carbon offsets from green projects to meet net-zero pledges.
Part IV: Global Case Studies
1. European Union Emissions Trading System (EU ETS)
World’s largest compliance carbon market.
Covers ~10,000 installations in energy, industry, aviation.
Credits traded across EU countries, providing billions in green investment.
2. California Cap-and-Trade Program (USA)
Launched in 2013.
Includes industries, fuel distributors, and electricity providers.
Linked with Quebec’s carbon market.
3. China’s National ETS
Started in 2021, initially covering power plants.
Expected to expand to cement, steel, and aviation.
Will be the world’s largest market by emissions coverage.
4. India’s Green Energy & Carbon Trading Push
Renewable energy projects (solar, wind) generate millions of CERs under CDM.
India plans a national carbon trading scheme aligned with its 2070 net-zero goal.
Part V: Economic & Financial Dimensions
Carbon Pricing as Economic Signal
Carbon credits put a price on pollution, internalizing environmental costs. This incentivizes cleaner technologies.
Investment in Green Projects
Carbon revenues make renewable energy and reforestation projects financially viable, especially in developing countries.
Emerging Financial Instruments
Green Bonds
Carbon ETFs
Carbon futures and options on exchanges like ICE and CME
Corporate Net-Zero Strategies
Companies like Microsoft, Google, and Shell rely on both green energy and carbon credits to achieve carbon neutrality.
Part VI: Future Outlook
Growth of Voluntary Carbon Markets
Expected to grow from ~$2 billion (2022) to over $50 billion by 2030.
Digital Carbon Trading
Blockchain and tokenization are enhancing transparency and traceability of credits.
Integration with ESG Investing
Carbon performance will be a key metric in investment decisions.
Global Cooperation
More linkages between national carbon markets (e.g., EU, China, North America).
Corporate Accountability
Greater demand for high-quality credits and real emission reductions rather than symbolic offsets.
Conclusion
Green energy and carbon credit trading represent two sides of the same coin in the global climate action narrative. Green energy reduces emissions at the source by replacing fossil fuels, while carbon markets provide flexible, market-driven tools to finance emission reductions and incentivize global cooperation.
However, both face challenges—technological, economic, and ethical—that must be addressed. Transparency, integrity, and equitable benefit-sharing will be essential to ensure that these systems truly help achieve the goals of the Paris Agreement.
The future will likely see tighter integration between renewable energy expansion, carbon pricing mechanisms, and sustainable finance, creating a global ecosystem where climate responsibility and economic opportunity go hand in hand.

DivergenceLike I have said in the previous idea, this divergence looks very similar to the divergence we saw in June. It can be broken on some extremely positive news, but now some correction will likely take place. The previous one ended with a tiny undercut of previous low and a positive 4h (2h) divergence. Maybe this time we will see a small correction with 6420 low undercut or maybe it will go lower (who knows). I'm shorting it. Will increase the short position if it goes higher first and will get out if I see atleast 1h positive divergence.

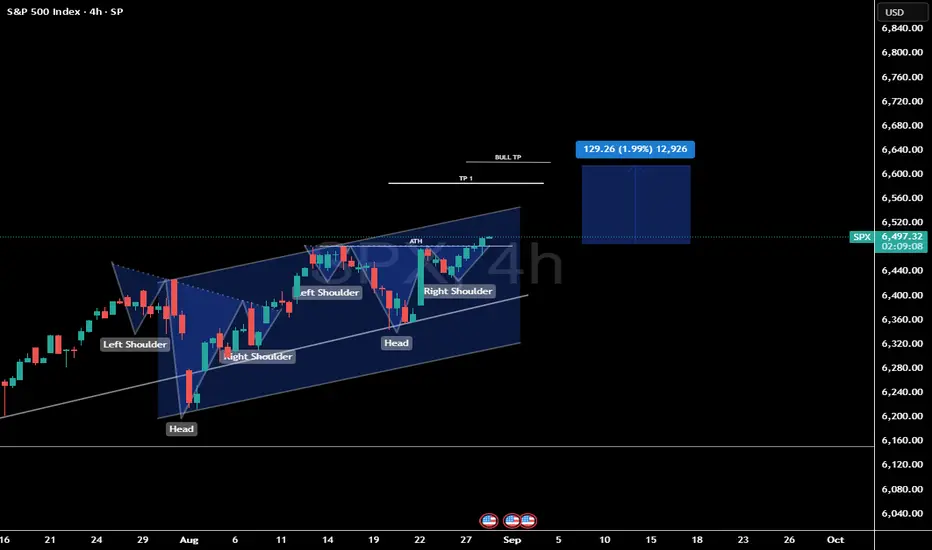
SNP500 ShortThis is against the H4 trend; however there is very good resistance at this level, as it is the all-time high and contesting the previous week's high.
There is a pattern on M15 to show a potential reversal zone.
Multiple tops on M15 to H1 with divergence and showing the trends flattening out.
This is against the trend so look to get out at M15 oversold

Quick Recap - SPX Day TradeSharing some insight to help with getting you to better understand the moves i'm doing.

Hellena | SPX500 (4H): LONG to resistance area of 6596 .Dear colleagues, I haven't made a forecast for the SNP500 in a long time and was waiting for a correction, but it seems that a major correction is not yet close, and at the moment the price continues to be in an upward five-wave movement.
Therefore, I believe that we should expect to reach the 6596 area, which will mark the end of the medium-term wave “3.”
The corrections are not very deep at the moment, but the price may reach the 6317 area before continuing its upward movement.
Manage your capital correctly and competently! Only enter trades based on reliable patterns!

S&P500 INDEX (US500): To the New Highs?!
US500 is going to break a resistance based on a current all-time high.
A daily candle close above the underlined structure will provide a confirmation.
A bullish continuation will be expected at least to 6520 then.
❤️Please, support my work with like, thank you!❤️
I am part of Trade Nation's Influencer program and receive a monthly fee for using their TradingView charts in my analysis.

sp500 prepares for a retracement fibonacci speaks clearly, we are ready for a bearish leg, which could bounce into the clear support, and which coincides with fibonacci 38.2, to continue its run, up to the illustrated area, made with the fibonacci reversal.

SPX is in a clear breakout trend! SP:SPX has triggered 2 larger bullish patterns.
Both patterns result in higher price.
Despite the weakness in NVDA the markets have shrugged off the decline.
We are trading into new all time highs so price discovery mode is in a effect.
When you have no resistance pivots or volume to trade against at new all time highs you really have to be careful if you're shorting the market.
Volume trends. extension moves, ATR, deviations should all be included in your analysis to define upside target zones.
We continue to remain net long the markets with key shorts in place.
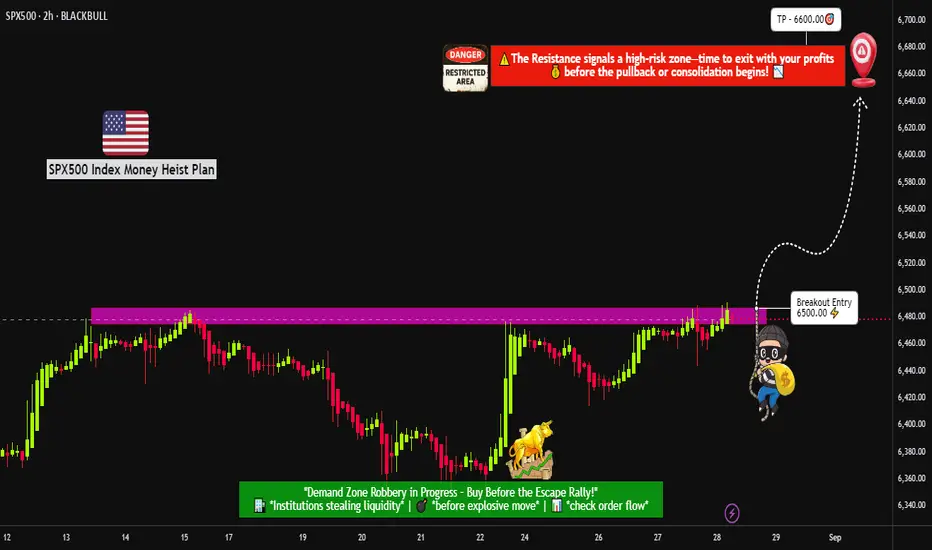
"US500 BREAKOUT – TIME TO LOAD LIMIT ORDERS FOR THE PUMP?"🔥🦹♂️ "SPX500 BANK HEIST – LAYERED BULL RAID IN PROGRESS!" 💰📈
(Thief Trader’s Multi-Limit Order Bullish Ambush – No Weak Hands Allowed)
📍 ASSET: US500 / SPX500 (S&P 500 INDEX)
🎯 HEIST PLAN: BULLISH BREAKOUT 6500.00
💣 ENTRY: ANY PRICE LEVEL (Thieves use Layered Limit Orders – adapt like a pro!)
🔫 SAMPLE LAYERS: (Scale in like a boss!)
BUY LIMIT LAYER 1: 6475.00
BUY LIMIT LAYER 2: 6460.00
BUY LIMIT LAYER 3: 6440.00
(Add more layers if needed – flexibility is key!)
🛑 STOP LOSS: 6400.00 (Thief’s Emergency Exit – adjust based on your risk!)
🎯 TARGET: 6600.00 (First profit zone – trail or take gains!)
🦹♂️ THIEF TRADER’S MASTER PLAN:
"We don’t ask for permission – we take profits."
🔹 ENTRY TACTICS:
Use multiple limit orders (LAYERED STRATEGY) – like planting timed explosives at key levels.
No panic entries – thieves strike with precision, not emotion.
DCA if needed – but keep bullets for the real move.
🔹 STOP LOSS RULES:
6400 = Danger Zone – if price breaks, abort mission & regroup.
SL too tight? You’ll get stopped out by market noise. SL too wide? You’ll bleed. Find balance.
🔹 TAKE PROFIT STRATEGY:
First TP @ 6600 – secure partial profits.
Let runners ride with trailing stop – or full exit if momentum fades.
🚨 THIEF’S GOLDEN RULES:
✅ Only LONG – no revenge shorts, no greed traps.
✅ Trade in SILENCE – avoid high-impact news (CPI, NFP, Fed).
✅ Risk management = Survival – don’t blow your account on one play.
✅ BOOST & SHARE – if this plan helps, spread the word!
📢 FINAL WARNING:
"This is not financial advice – it’s a thief’s blueprint.
Plan your escape before entry. Market heists require discipline."
💬 COMMENT "ROBBING SPX" if you’re in!
🔥 LIKE & BOOST if you ride with the Thief Trader crew!
🦹♂️ THIEF TRADER OUT.
💸 STEAL SMART. GET RICH. REPEAT.
S&P500 Nvidia’s guidance has tempered risk appetiteNvidia’s earnings dampened sentiment overnight, with shares down -3% in after-hours trading after a strong Q2 sales beat was overshadowed by softer guidance and concerns over a potential US plan to tax China AI chip sales. The disappointment weighed on futures, with NASDAQ 100 down -0.29% vs. -0.12% for S&P 500.
That said, prior to the results, the S&P 500 (+0.24%) closed at another record high, supported by strength in energy (+1.15%) on firmer oil prices and tech (+0.48%). Small-caps also outperformed, with the Russell 2000 (+0.64%) at an 8-month high, now just 3% below its November 2021 peak.
Takeaway for S&P traders: Nvidia’s guidance has tempered risk appetite, but sector rotation into energy and small-caps continues to support breadth, helping the index hold record levels despite tech headwinds.
Key Support and Resistance Levels
Resistance Level 1: 6516
Resistance Level 2: 6542
Resistance Level 3: 6564
Support Level 1: 6416
Support Level 2: 6400
Support Level 3: 6381
This communication is for informational purposes only and should not be viewed as any form of recommendation as to a particular course of action or as investment advice. It is not intended as an offer or solicitation for the purchase or sale of any financial instrument or as an official confirmation of any transaction. Opinions, estimates and assumptions expressed herein are made as of the date of this communication and are subject to change without notice. This communication has been prepared based upon information, including market prices, data and other information, believed to be reliable; however, Trade Nation does not warrant its completeness or accuracy. All market prices and market data contained in or attached to this communication are indicative and subject to change without notice.

SP500 4H Trading Outlook for Major Currency Pairs and Indices, Especially Gold and Silver, in the Upcoming Week
In this series of analyses, we have reviewed short-term trading perspectives and market outlooks.
As can be seen, each analysis highlights a key support or resistance area near the current price of the asset. The market’s reaction to or break of these levels will determine the subsequent price trend up to the next specified levels.
Important Note: The purpose of these trading outlooks is to identify key price levels and potential market reactions, and the analyses provided should not be considered as trading signals.

SEPTEMBER, the worst month for the S&P 500?What trend for the S&P 500 index this September 2025? A highly anticipated September as the fundamental back-to-school issues are crucial for the year-end trend.
September is the worst month for the S&P 500 index in terms of seasonality, and investors fear a drop in the US stock market this September while fundamental challenges are not lacking (the FED on Wednesday, September 17) and the S&P 500 is as expensive as it was at the end of 2021 in terms of valuation. Is this bearish consensus a trap?
On the topic of the S&P 500 valuation, I invite you to reread the analysis we published on July 30 by clicking on the image below.
1. Is September really the worst month in terms of performance for the S&P 500 index?
YES! Yes, September is indeed the worst month in the history of the S&P 500 index in terms of average performance. The average performance of September is negative, and no other month of the year shows a negative performance for the S&P 500.
However, be very cautious with this type of statistics, as it is only an average, and still, 47% of the September months in S&P 500 history have recorded a positive performance.
The data source below is indicated at the bottom right of the table.
2. The final performance of September 2025 will be dictated by fundamentals, in particular the Fed’s monetary policy decision on Wednesday, September 17.
The Fed has not lowered the federal funds rate since the end of 2024, and the US stock market now needs an accommodative monetary shift to preserve its long-term bullish trend. In one of my articles last week, I examined the 3 possible scenarios for the federal funds rate by the end of the year as well as the stock market impact for equities, bonds, the US dollar, and Bitcoin.
The table below summarizes the 3 possible cases and the potential market impact; you can access all details by clicking on it.
It is Powell’s Fed monetary choice on Wednesday, September 17 that will determine the final September performance for the S&P 500 index. The next two figures likely to influence the Fed’s decision are the PCE inflation on Friday, August 29 and the NFP report on Friday, September 5.
DISCLAIMER:
This content is intended for individuals who are familiar with financial markets and instruments and is for information purposes only. The presented idea (including market commentary, market data and observations) is not a work product of any research department of Swissquote or its affiliates. This material is intended to highlight market action and does not constitute investment, legal or tax advice. If you are a retail investor or lack experience in trading complex financial products, it is advisable to seek professional advice from licensed advisor before making any financial decisions.
This content is not intended to manipulate the market or encourage any specific financial behavior.
Swissquote makes no representation or warranty as to the quality, completeness, accuracy, comprehensiveness or non-infringement of such content. The views expressed are those of the consultant and are provided for educational purposes only. Any information provided relating to a product or market should not be construed as recommending an investment strategy or transaction. Past performance is not a guarantee of future results.
Swissquote and its employees and representatives shall in no event be held liable for any damages or losses arising directly or indirectly from decisions made on the basis of this content.
The use of any third-party brands or trademarks is for information only and does not imply endorsement by Swissquote, or that the trademark owner has authorised Swissquote to promote its products or services.
Swissquote is the marketing brand for the activities of Swissquote Bank Ltd (Switzerland) regulated by FINMA, Swissquote Capital Markets Limited regulated by CySEC (Cyprus), Swissquote Bank Europe SA (Luxembourg) regulated by the CSSF, Swissquote Ltd (UK) regulated by the FCA, Swissquote Financial Services (Malta) Ltd regulated by the Malta Financial Services Authority, Swissquote MEA Ltd. (UAE) regulated by the Dubai Financial Services Authority, Swissquote Pte Ltd (Singapore) regulated by the Monetary Authority of Singapore, Swissquote Asia Limited (Hong Kong) licensed by the Hong Kong Securities and Futures Commission (SFC) and Swissquote South Africa (Pty) Ltd supervised by the FSCA.
Products and services of Swissquote are only intended for those permitted to receive them under local law.
All investments carry a degree of risk. The risk of loss in trading or holding financial instruments can be substantial. The value of financial instruments, including but not limited to stocks, bonds, cryptocurrencies, and other assets, can fluctuate both upwards and downwards. There is a significant risk of financial loss when buying, selling, holding, staking, or investing in these instruments. SQBE makes no recommendations regarding any specific investment, transaction, or the use of any particular investment strategy.
CFDs are complex instruments and come with a high risk of losing money rapidly due to leverage. The vast majority of retail client accounts suffer capital losses when trading in CFDs. You should consider whether you understand how CFDs work and whether you can afford to take the high risk of losing your money.
Digital Assets are unregulated in most countries and consumer protection rules may not apply. As highly volatile speculative investments, Digital Assets are not suitable for investors without a high-risk tolerance. Make sure you understand each Digital Asset before you trade.
Cryptocurrencies are not considered legal tender in some jurisdictions and are subject to regulatory uncertainties.
The use of Internet-based systems can involve high risks, including, but not limited to, fraud, cyber-attacks, network and communication failures, as well as identity theft and phishing attacks related to crypto-assets.

SPX shortSame like 2000 the concentration in AI related companies is 5 times as of russell 2000 combined companies.
Technical - Divergence in breadth and momentum
Fundamental - Expecting 3 rate cuts this year, when not delivered will start panic selling.
Chart pattern - Weekly doji

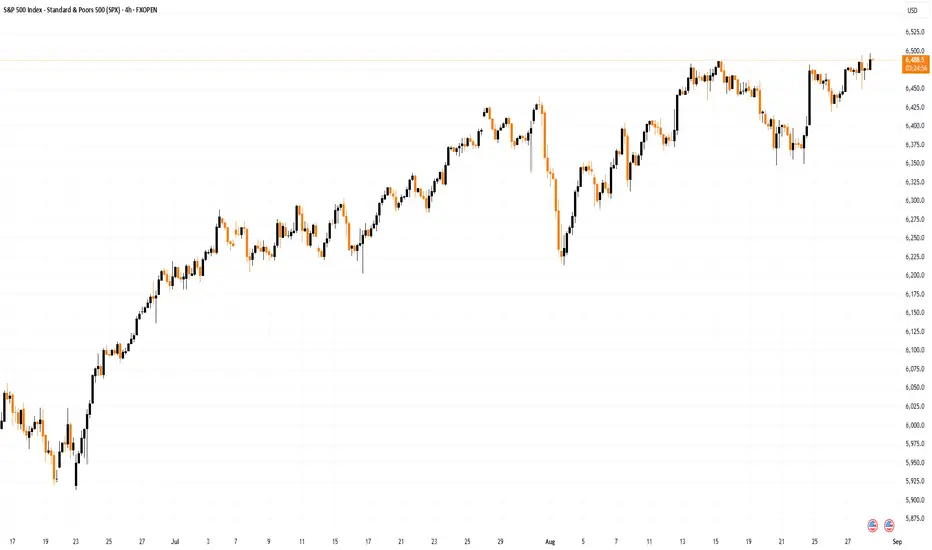
S&P 500 Index Reaches Another All-Time HighS&P 500 Index Reaches Another All-Time High
On 13 August, we wrote about the S&P 500 reaching an all-time high following the release of the CPI report. At that time, we suggested that the price might move towards the upper boundary of the ascending channel (highlighted in blue on the chart).
Since then:
→ the price has set a new record, forming peak 0 near the upper boundary of the channel;
→ it then fell back towards the lower boundary, where block A was formed;
→ and subsequently rose again to a fresh all-time high (F), coming close to the 6500 level.
The resilience of the blue channel underlines the prevailing bullish sentiment, which is supported by expectations of a Fed rate cut in September – an event seen as positive for the economy and potentially boosting corporate earnings. This optimism is so far outweighing the fact that Nvidia’s shares slipped slightly yesterday after the company’s earnings release (despite results exceeding investor expectations).
But is the outlook entirely cloudless?
S&P 500 Chart Technical Analysis
Looking at the 4-hour chart of the S&P 500, there are grounds to make slight adjustments to the slope and width of the ascending channel to better reflect the latest data.
At first glance, the picture appears bullish:
→ long lower shadows around block A point to strong buying interest;
→ downward pullbacks (B→C following impulse A→B, and D→E following impulse C→D) halted near the classic 50% Fibonacci retracement;
→ higher lows in late August give reason to consider the formation of a cup and handle pattern.
However, the bears also have their counterarguments:
→ the 6,500 level could act as psychological resistance (with the risk of a false bullish breakout);
→ the upper boundary of the channel may provide resistance;
→ the marked extremes resemble a bearish rising wedge pattern.
Progress in establishing new highs is becoming weaker each time – it seems that the S&P 500 bull market is running out of steam. This raises concerns about a correction – and with September’s long-standing reputation as the most unfavourable month for markets, a noticeable pullback could happen.
This article represents the opinion of the Companies operating under the FXOpen brand only. It is not to be construed as an offer, solicitation, or recommendation with respect to products and services provided by the Companies operating under the FXOpen brand, nor is it to be considered financial advice.
SPX500 Hits 6,495 Before Pullback, Key Pivot at 6,468SPX500 Futures – Overview
The S&P 500 continues to record new highs, peaking at 6,495 before pulling back for a correction.
Price action has since settled above 6,485 on the 4H candle — the previous high — and is now correcting back toward this level, preparing for a potential new upward move.
🔹 Technical Outlook
Holding above 6,485 will support bullish continuation toward 6,512 → 6,528 new ATH.
⚠️ A break below 6,485 and a confirmed 1H close under 6,468 (pivot) would signal a new decline toward 6,425 support.
Key Levels
Pivot: 6,468
Resistance: 6,512 – 6,528
Support: 6,485 – 6,468 – 6,438 – 6,425
✅ Summary:
SPX500 remains in a bullish structure after reaching new highs. Watch 6,485 as the key decision level — holding above favors continuation higher, while a drop below 6,468 could trigger a deeper correction.

S&P500 at Resistance: Nvidia Earnings Could Decide the Next Move📊 US500 (S&P 500) has rallied recently 📈, but it’s still struggling to break through the current highs 🔼🧱.
💡 I believe the next move could hinge heavily on Nvidia’s earnings report tomorrow 🖥️💵.
👉 If the report is positive, watch for a break and retest above the current range to position long 🚀.
👉 If the report is negative, we could see the broader stock market sell off 📉.
⚠️ This is for educational purposes only and not financial advice 📚🔒

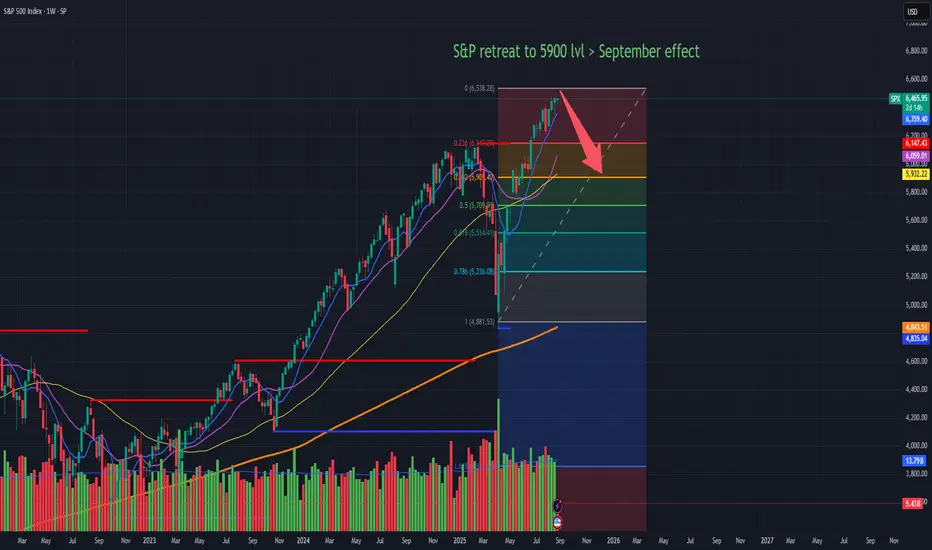
Why Stocks Often Drop in September — And Why Algos Make It WorseSeptember has historically been a challenging month for stocks, especially indexes like the S&P 500. While several human behavioral factors contribute, algorithmic trading significantly amplifies this effect. I am expecting S&P to retreat to 5900 lvls and stocks to drop heavily alreadt end of this week.
Algos Are Programmed to React to Seasonal Patterns:
Many trading algorithms are trained on historical market data that include the “September Effect”—the well-known tendency for stocks to dip during this month. As a result, these algorithms trigger sell signals simultaneously as September approaches, cascading into accelerated selling pressure.
Profit Taking at Summer’s End:
Institutional investors and traders often take profits at the end of August after strong summer gains, reducing exposure before expected volatility. This human behavior feeds into the algo models, reinforcing selling trends.
Order Splitting and Speed Amplify Moves:
Algorithms slice large orders into smaller ones to minimize market impact, but when many algos do this in sync, it leads to sharp intraday swings. High-frequency trading can exacerbate rapid price drops as sell orders pile up quickly.
Hedging and Risk Controls Kick In:
As prices fall, algos are programmed to cut risk by selling to limit losses. These automated sell-offs can create feedback loops, pushing prices down faster than human emotions alone would.
Volatility Spurs More Selling:
Increased price swings prompt further algorithmic adjustments and human caution—creating a self-reinforcing cycle of volatility and declines.
Bottom Line: With profit-taking wrapping up August and algo-driven selling ramping up, the S&P 500 is likely to begin a retreat of at least 5% soon, echoing historical September patterns. For disciplined investors, this period is an opportunity to consider taking profits or reducing risk before broader market weakness potentially sets in.

Bulls and Bears zone for 08-26-2025It seems that traders were taking profit yesterday after Friday's huge move up.
Level to watch: 6452 --- 6454

SPX SHORT IDEALower high ! 6500 failed to sustain for a third time now. Showing some signs of resistance on another climb. 21 day EMA sits just below that bottom trend, where price has been overextended for a while now. Good short set up for a higher low print right there !
Good luck y’all.

SPX ShortElite Analysis
DISCRETIONARY TRADE
Targeting lower liquidity pools
Price is rejecting off structural liquidity

Caution picking your short we will go deep down Caution picking your short we will go deep down Use apple as a indicator. It has a monthly gap at 124 and smaller gaps on lower time frames. Will update on the go
