Peak Tech Earnings Wrapped Up: Here Are the Winners and LosersWe're past that time when we all get glued to the dual-monitor setup and watch the titans of tech parade their financials.
Last week was the Super Bowl of earnings season, with Meta NASDAQ:META , Microsoft NASDAQ:MSFT , Alphabet NASDAQ:GOOGL , Apple NASDAQ:AAPL , and Amazon NASDAQ:AMZN all reporting in the span of just a couple of days.
The result? A mixed bag of profits, promises, and expenses, all revolving around the familiar AI growth story. Some soared. Others sank. And everyone was reminded that in Big Tech , growth costs money — a lot of it.
Let’s unwrap what happened in the most influential week of the earnings calendar .
🥴 Meta: The Spending Spree Continues
Meta NASDAQ:META suffered the most bruising showing. On paper, revenue looked great — $51.2 billion, up 26% year over year and above estimates. But earnings per share? A brutal $1.05, far below the expected $6.72, after a nearly $16 billion one-time charge tied to President Trump’s “Big Beautiful Bill.”
Without that charge, net income would’ve jumped to $18.6 billion. Instead, the headline number showed $2.7 billion — not exactly inspiring. But the real story wasn’t the miss. It was the spending.
Meta now plans to splurge $71 billion this year, up from $69 billion, mainly on AI data centers and a hiring binge in its research division. The stock dropped 11% on Thursday.
🧠 Alphabet: Ads Strong, Cloud on Fire
If Meta NASDAQ:META stumbled, Alphabet NASDAQ:GOOGL strutted. The Google parent beat on everything : earnings per share at $2.87 vs. $2.26 expected and revenue hitting a record $102.3 billion, up 16% year on year.
The company took a $3.5 billion fine from the European Commission — but even with that, margins looked healthy. Excluding the fine, the operating margin would’ve hit 33.9%. Not bad for a firm still making 85% of its money from ads.
The real fireworks were in Google Cloud, where sales rose 34% and profit margins improved to 24% from 17% last year. Alphabet stock jumped 2.5% Thursday.
🧩 Microsoft: Cloudy with a Chance of Heavy Capex
Microsoft NASDAQ:MSFT delivered classic consistency — and then some. The company reported earnings per share of $4.13, beating estimates, on $77.7 billion in revenue. Azure, the star of the show, grew 40%, topping expectations.
Yet shares dipped 3% the day after as investors fixated on capital spending. Microsoft shelled out $34.9 billion last quarter and warned that capex growth in 2026 will exceed 2025.
🍏 Apple: New Phone Who Dis?
Apple NASDAQ:AAPL is back, everyone. The company posted record revenue of $102.5 billion , slightly above expectations, and hinted that the holiday quarter will be even juicier.
CFO Kevan Parekh said sales could rise 10–12%, led by a “double-digit” surge in iPhone 17 upgrades. After years of lukewarm demand, Apple’s upgrade cycle looks hot again.
One blemish: China sales dipped, underscoring the company’s ongoing battle in its second-largest market. But services revenue — now over $100 billion annually — continues to shine as Apple quietly transforms into a subscription empire disguised as a hardware company.
The stock erased a 3% Friday gain to dip into the red.
🚀 Amazon: AI, Efficiency, and a Holiday Boom
Then there was Amazon NASDAQ:AMZN , the comeback kid of this earnings season. The e-commerce giant’s revenue soared 13% to $180 billion , and profit surged 39% to $21.2 billion. Solid.
Amazon Web Services grew 20%, its fastest clip since 2022, as AI demand turned into real money. CEO Andy Jassy said data center expansion will remain a top priority heading into 2025.
The company managed to sprinkle in some “efficiency” — laying off 14,000 employees, a move expected to cost $1.8 billion now but save plenty later.
Amazon’s stock shot up 10% in pre-market Friday, and held on to the increase, proving that just a select few companies can pivot from layoffs to record profits with such finesse.
🧾 The Takeaway
So, what did we learn from Peak Tech Week?
America’s highflyers are spending big to secure their AI future. The underlying theme is that AI costs a fortune, but not investing in it could cost even more.
In short — the future is bright, the bills are bigger, and the market’s message is clear: keep growing, but try not to spook traders while you do it. The earnings show continues with AMD NASDAQ:AMD and Palantir NASDAQ:PLTD reporting this week.
Off to you : Are you looking to scoop up some NASDAQ:META or sell some NASDAQ:AMZN ? Share your thoughts in the comments!
Trade ideas

Backtesting 101: How to Turn an Idea Into a Tested StrategyEvery trader has thought it:
“If I’d just followed that setup every time, I’d be up big.”
That’s where backtesting steps in, it separates luck from logic.
It’s how you find out whether your strategy has a real edge, or just worked in hindsight.
Most traders skip it, not because it’s useless, but because it forces them to face the truth.
But if you can handle that truth, backtesting will make you a far more confident trader.
What Backtesting Really Is
Backtesting means applying your trading rules to historical data to see how your system would have performed.
It’s not about predicting the future, it’s about proving whether your idea works in different market conditions.
When done properly, it gives you three key insights:
Profitability: does your edge actually exist?
Risk: how deep are the drawdowns, and can you handle them?
Consistency: does it work across bull, bear, and sideways markets?
A solid backtest gives you confidence, not because it guarantees profit, but because it exposes weakness before the market does.
The Most Common Mistakes
Curve-fitting: tweaking rules until the past looks perfect.
Ignoring fees and slippage: small costs that quietly erase profits.
Testing too little data: short periods create false confidence.
Focusing on one market: edges must survive different conditions.
If your backtest looks too clean, it’s probably lying to you.
Why It Matters
Backtesting builds trust in your system and discipline in yourself.
When you know your data, you stop second-guessing every trade.
Losing trades stop feeling like failure, because you understand they’re part of a proven edge.
Even bots rely on backtesting. Without it, automation is just random execution.
With it, every trade follows structure, not emotion.
All of these points make a difference between a winning or losing strategy.
From Idea to System
Every strategy starts as a hypothesis.
Backtesting turns that hypothesis into data.
Data turns into structure.
Structure turns into consistency.
That’s the real path to professional trading - logic first, emotion second.

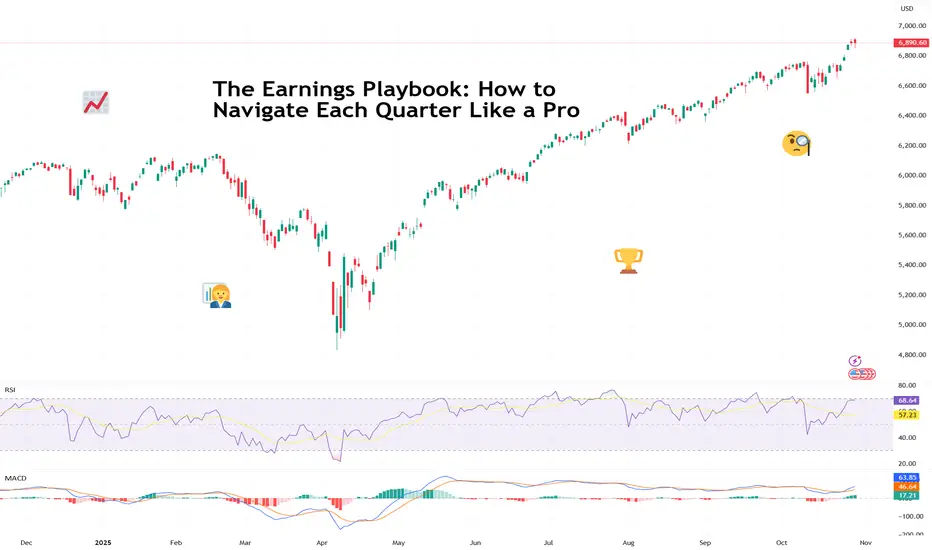
The Earnings Playbook: How to Navigate Each Quarter Like a ProTraders are in the heat of the earnings season and euphoria is sweeping every corner of the market.
The charts twitch, traders stop talking about the Fed for five minutes ( not this week, though ), and online forums turn into a parade of watch-me-trade sessions.
It’s that glorious stretch when companies pop open the books and reveal what’s really been happening behind the scenes.
For professional investors, it’s data heaven. For retail traders, it’s emotional cardio. Stocks can rise 20% on a single upbeat forecast — or plummet before your coffee cools. The trick isn’t just to survive it. It’s to navigate it like a pro.
💼 Know the Seasons (and the Mood Swings)
Earnings season comes four times a year — January, April, July, and October — and each has its own flavor.
Q1 (April): That’s the hangover quarter. Holiday sales meet new-year cost cuts. Traders recalibrate expectations and reality collides with ambition.
Q2 (July): The mid-year checkup. CEOs brag about “momentum,” analysts start sharpening their red pencils. Markets get twitchy.
Q3 (October): The credibility test. Guidance revisions and cautious tones dominate. If the year’s been good, this is where the victory laps start.
Q4 (January): The scoreboard reveal. Everyone tallies their annual wins and losses, and traders begin to bet on who carries the next year’s momentum.
Each cycle has a similar rhythm: hype, reaction, digestion, and speculation. Think of it like a four-act play.
📊 Mind the Gap
One thing to keep in mind whenever you find yourself in the earnings bonanza: the actual numbers matter less than the narrative. ( Looking at you, Oracle NYSE:ORCL )
A company can beat on revenue, miss on profit, and still rally — if the CEO sells a compelling story about the next quarter. Conversely, it can post record earnings and tank because analysts wanted even more.
The pros know to look beyond the headline EPS. They dig into guidance, margins, and segment performance. Is revenue growing because of genuine demand, or just creative accounting? Are margins improving, or did the company quietly cut R&D?
Markets don’t price what’s happened — they price what’s next. That’s especially true for growth stocks like t echnology companies .
🎯 Don’t Chase the Knee-Jerk
Every earnings season has its share of instant overreactions — the “up 10% at open, down 8% by lunch” kind of chaos. That’s when seasoned traders sit back and let volatility do the heavy lifting.
Smart money avoids buying into the frenzy or shorting into despair. Instead, they wait for the second move — when dust settles, algorithms calm down, and humans return to their desks.
🧠 Build Your Own Playbook
To trade earnings season like a pro, you need a plan. Here’s how the veterans prep:
Start early. Check the earnings calendar and mark high-impact names in your portfolio or watchlist.
Study the setup. Look at how the stock’s performed heading into earnings. A big pre-report rally can mean expectations are too high.
Focus on guidance. Earnings beats are old news — future commentary moves markets.
Use position sizing. Never bet the farm on one report. Even the best setups can go sideways.
Don’t forget the macro. Rate cuts, inflation prints, or a stray tweet from the US President can overshadow the best earnings beat.
🕹️ The Big Picture: Earnings as Market GPS
Earnings season is the market’s health check because it tells you which sectors are thriving, which are limping, and how CEOs feel about the future (watch the language: “headwinds” and “volatility” are polite ways of saying buckle up).
Taken together, earnings trends shape the broader narrative — from interest rate expectations to sector rotations. In other words, earnings season is where short-term trading meets long-term investing.
Now go and prepare for the next batch of earnings — Big Tech is on deck this week with Apple NASDAQ:AAPL and Amazon NASDAQ:AMZN reporting today.
Off to you : What’s your strategy this earnings season? Buying the hype or waiting to buy the dip? Share your thoughts in the comments!
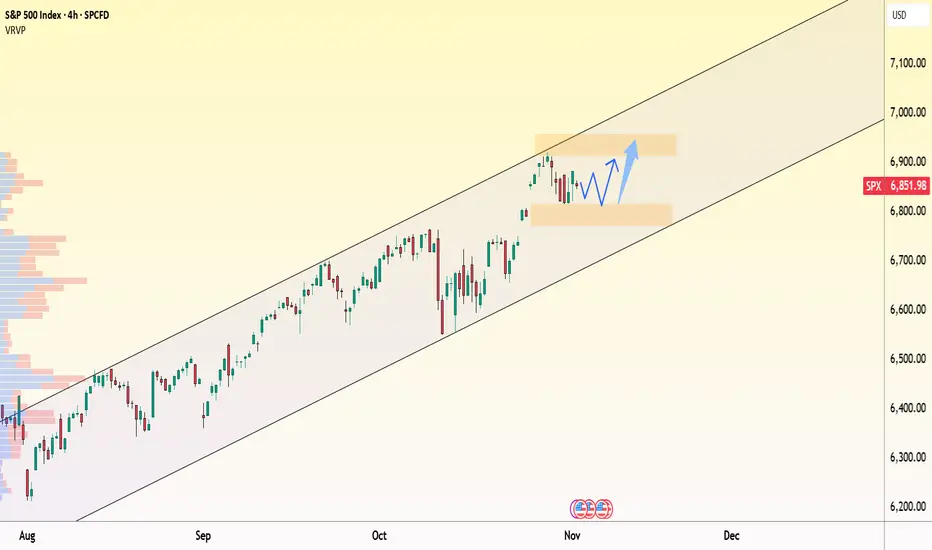
SPX:uptrend remains intact – consolidating for the next breakoutOn the 4-hour chart, the S&P 500 (SPX) continues to move firmly within its ascending channel , with the current range around 6,850–6,900 representing a healthy pause after a strong rally. The nearest support sits at 6,800, where buyers previously stepped in, while short-term resistance remains near 6,900.
From a news perspective, the rally is still being driven by tech and AI sectors , especially after the Amazon–OpenAI partnership deal , which reignited positive sentiment across the market. However, investors remain cautious ahead of upcoming U.S. ADP employment and ISM PMI data , which could influence the Fed’s next rate-cut decision.
Overall, the technical structure still supports an upward bias: SPX is consolidating between 6,800–6,900 before potentially breaking toward the 7,000-point zone , aligning with the upper boundary of the trend channel.
As long as the 6,800 support holds, the market retains room for another bullish leg in the sessions ahead, backed by renewed capital inflows into leading sectors.
S&P500 Possibly the last buy signal before Bull Cycle ends.The S&P500 index (SPX) has been trading within a 5-month Channel Up and is currently about to complete its latest Bearish Leg. All such pull-back sequences have reached at least the 4H MA200 (orange trend-line) before rebounding and kick-starting the next Bullish Leg, with the 1D MA50 (red trend-line) providing the ultimate Support of this pattern.
As a result, especially since the 4H RSI also hit the 30.00 oversold barrier, we expect the index to initiate the new Bullish Leg and aim for a Higher High near the 2.5 Fibonacci extension. Our Target is 7150.
-------------------------------------------------------------------------------
** Please LIKE 👍, FOLLOW ✅, SHARE 🙌 and COMMENT ✍ if you enjoy this idea! Also share your ideas and charts in the comments section below! This is best way to keep it relevant, support us, keep the content here free and allow the idea to reach as many people as possible. **
-------------------------------------------------------------------------------
💸💸💸💸💸💸
👇 👇 👇 👇 👇 👇

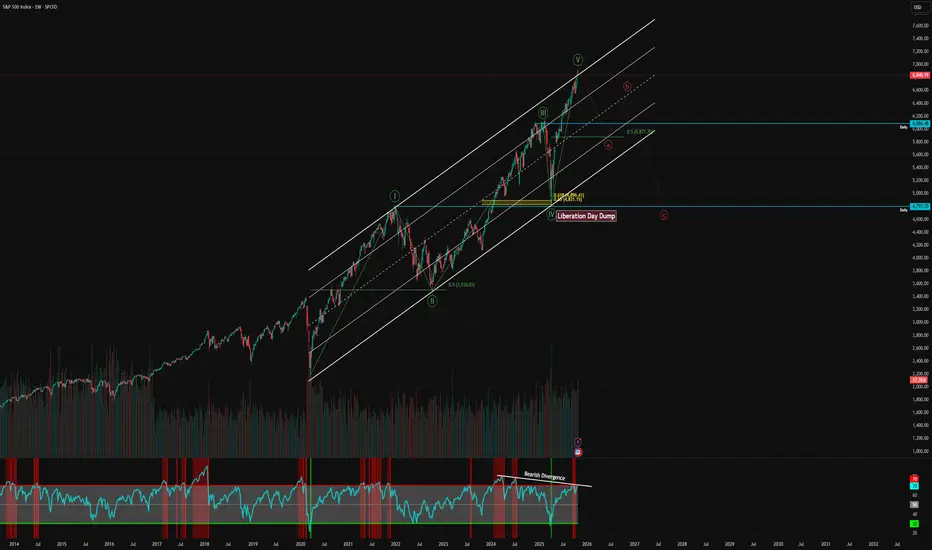
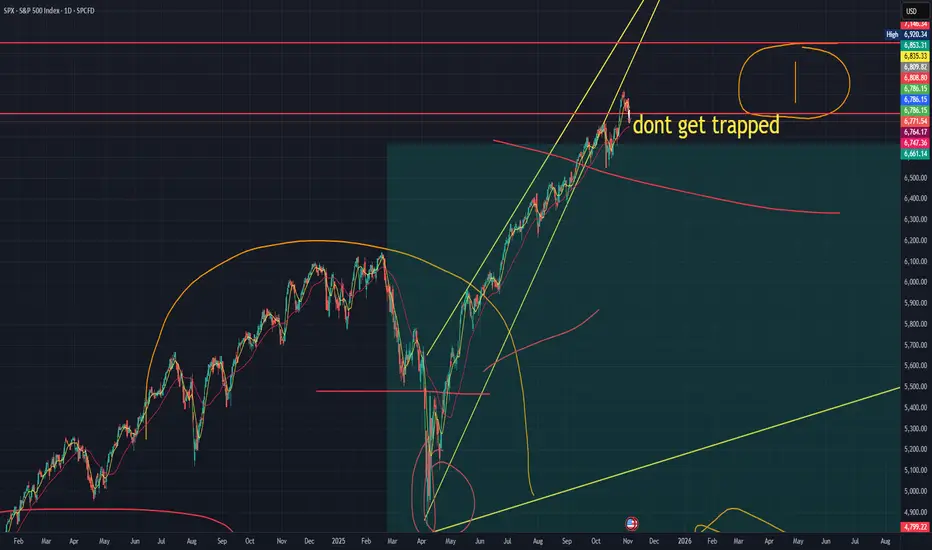
Topping Signal?To me this looks like Wave 5 of the Elliott Wave supercycle in the stock market. We had a monster rally since the liberation day dump, now we are coming up against some strong resistance.
Should we be concerned? So far I have taken a lot of chips of the table. I am still very much long, we don't fight the tape, but if you haven't already started booking profits; have a good hard think about how much higher we could go from here.
The government shutdown will start to filter through the earnings reports next earnings season, especially if it persists over a month. Consumer stocks are showing weakness, whilst the AI trade continue to go vertical, but it will not go on forever - something will eventually give.
SPY/SPX Bear Market, liquidity speedbumps, and key levels SP:SPX AMEX:SPY
The current setup mirrors the prior rally from trough to peak, projecting a speculative 20% bear market range.
From here, I’m watching for a push into 6100–6200 that’s where strong resistance should form. If we reject that zone, it likely marks the start of a deeper unwind.
A quick overshoot toward 6000 wouldn’t surprise me and could trigger a dead cat bounce, but unless buyers regain control above 6200, the bounce should fade.
At 20% we'll be around $5550, where we’d likely find structural support. However a market shock around there could allow it to drop to $5200 if something happens while we're in that zone.
I don't think we'll go lower than $5000 moving forward
Agenda 89 --- the path to spy's next major topso I been rambling about agenda 89 and spy cycles for like ages. I also more or less blew my account up not listening to my own advice and my own levels. key thing here is market follows cycles. and no I am not willing to share the prior cycles. this here is for me more than anyone else.
I am not good with numbers so I had chatgpt do the calculations for me and the rationale made sense given my basic college math level knowledge. In fact the cycles that gpt calculated appeared to follow the same cycle rules that I used to detect the historical cycles. I have only 3 historical cycles detected. in recent times. reason being that since 2008 Aladdin took over the market and things changed. there is a certain year where it all did shift but for simplicity only data after 2008 matters because after that Aladdin by blackrock the mega algorithm managed all the trillions that move the market daily. it literally trades with itself. it's too huge to fail so I will not fight it. the cycles have also been shrinking in expansion per say. the next top is likley the last or second to last before some major black swans start happening. At least that's what aladdin has priced in. he knows more about you than yourself and
other notes is that the tops follow wycoff style, the expanded and got more volatile as they progressed and I plan to follow the same pattern in my projections. my projections are half lazy in terms of the tops/bottoms. it can really follow any wycoff. but of note, when all was noted and combined chatgpt described it as a wycoff schematic #1. even though when I typed the pattern that i saw in i labeled it as musical notes. I did not paint very well on chart because things in real life do not follow the textbook 1-1, point is, whipsaw and that's your range there more or less. I am not sure how to past an image here so just google it.
the rules and this is for me to not blow my account up anymore:
1- no timing the market, it dipped? good it can dip lower before tuning up. so expect the trades to be long. were looking at 13 dips before the top in febuary.
2- the numbers can be off slightly. I'm no picasso, can;t time or paint the market. levels evolve and change with time. the range wont change though.
3- the true top is likley a tuesday or a wednesday since historically it was those days so extra bias for them
4- no greed
5- yes this will chop until next year mid febuary - do not blow up. RANGE BOUND.
I'm expecting possibilities of up to 720-730 for the top on spy since that would be two full cycles in geometry which would make sense assuming the prior 3 were 90 degrees each. hence a strong belief of mine that this may be the last market cycle aladdin is pricing in before doomsday events. Aladdin probably knows when WW3 will start before the guys launching the nukes know it will start and has been pricing it in since it took over the markets. that thing is a monster beyond comprehension.

S&P 500 at Critical Support – Last Line of Defense?Since the S&P 500 index( SP:SPX ) is one of the key indicators in the financial markets, and it’s been highly correlated with parallel markets recently, it's always a good idea to keep an eye on its analysis.
Now, for example, Bitcoin ( BINANCE:BTCUSDT ) started to decline as the S&P 500 index dropped, and right now the S&P 500 index is at a pretty critical Support zone($6,774_$6,689) and Support lines. It's essentially moving right around its last line of hope.
From an Elliott Wave theory perspective, in this current zone, the S&P 500 index could be completing the Triple Three Correction(WXYXZ)=main wave 4.
Looking ahead, we might expect the S&P 500 index to climb up toward its Resistance zone($6,894_$6,859). And given the current positioning, the risk-to-reward ratio looks quite favorable—as long as you keep a reasonable stop loss in place and practice good risk management.
Note: if these Support lines break downward, we could see further declines in the S&P 500 index and in those correlated markets as well. So it's definitely something to monitor closely.
Please respect each other's ideas and express them politely if you agree or disagree.
S&P 500 Index Analyze (SPX500USD), 1-hour time frame.
Be sure to follow the updated ideas.
Do not forget to put a Stop loss for your positions (For every position you want to open).
Please follow your strategy and updates; this is just my Idea, and I will gladly see your ideas in this post.
Please do not forget the ✅' like '✅ button 🙏😊 & Share it with your friends; thanks, and Trade safe.

S&P 500 Bulls Back in Control – New All-Time High Ahead?As I expected in my previous idea , the S&P 500 index( SP:SPX ) pulled back from its Resistance lines and hit its target.
Right now, the S&P 500 index is in the process of breaking through a Resistance zone($6,894_$6,859). Just a few hours ago, it successfully broke above the upper line of a descending channel , which is a positive sign for a renewed upward move .
From an Elliott Wave perspective, it seems that the S&P 500 index has completed its main wave four, and after breaking this Resistance zone($6,894_$6,859) , we can anticipate the start of a main wave 5 .
I expect that once the S&P 500 index breaks through this Resistance zone($6,894_$6,859) , it will likely climb at least up to the next Resistance lines and the Potential Reversal Zone (PRZ) .
Note: The cryptocurrency market, and especially Bitcoin( BINANCE:BTCUSDT ), has been highly correlated with the S&P 500 index these weeks.
Please respect each other's ideas and express them politely if you agree or disagree.
S&P 500 Index Analyze (SPX500USD), 1-hour time frame.
Be sure to follow the updated ideas.
Do not forget to put a Stop loss for your positions (For every position you want to open).
Please follow your strategy and updates; this is just my Idea, and I will gladly see your ideas in this post.
Please do not forget the ✅' like '✅ button 🙏😊 & Share it with your friends; thanks, and Trade safe.

Larger Drop Incoming?The move up since the liberation day dump has been epic. I called the low on the markets at the time. I was long AppLovin, AMD, Reddit, Arm, Alab, REMX, amongst many other names that far outperformed the market. I warned you about the imminent dump before it happened, and then took positions on the long side as the market capitulated and we hit the golden ratio.
Now it's time to zoom out and remind you that this will not grind up forever. My interpretation of the chart is the move is nearing the end, the risk of strong downside move (7-12% drop) is increasing significantly and greed will catch many people out.
The inverse head and shoulders pattern is almost complete, we are grinding up in this channel and will start to come up against the resistance over these coming days/weeks. I had an upside target of 7000-7250 and we are almost there. The dips are getting brought up, so bulls may have more time to make gains but I am not convinced that the gains are worth the risk at this stage.
I will start taking some chips off the table here. Not financial advice, do what's best for you.

S&P 500 at Make-or-Break Level – Bulls’ Last Chance!As I expected in the previous idea , the S&P 500 index ( SP:SPX ) has reached its target.
Given that the S&P 500 index has a strong correlation with other financial markets, especially Bitcoin ( BINANCE:BTCUSDT )—sometimes even tracking them candle-by-candle—it's a good idea to pay extra attention to the S&P 500 index these days.
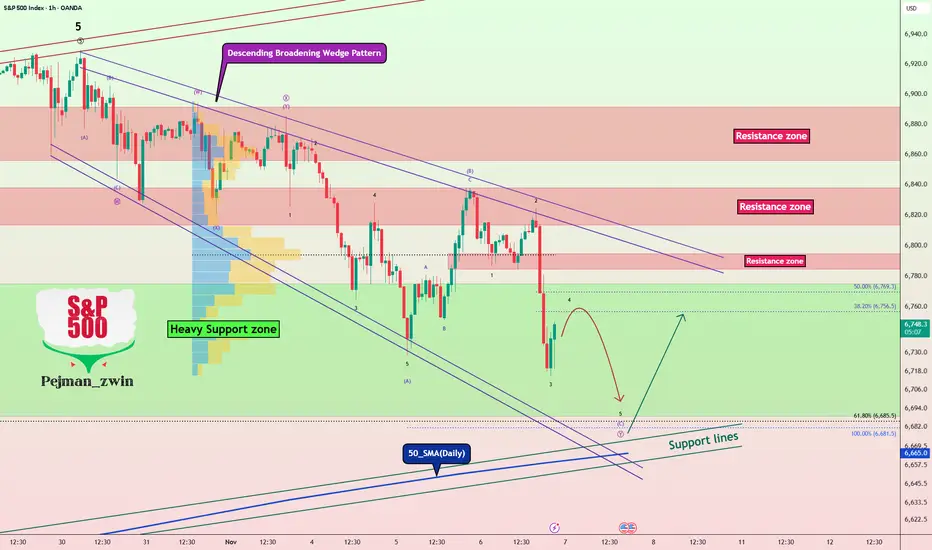
Currently, the S&P 500 index is moving in a Heavy Support zone($6,775_$6,689) , although it entered this zone with a lot of downside momentum.
From a classic technical analysis perspective, there's still a chance that the descending broadening wedge pattern will hold. As long as this pattern isn't invalidated, we can still hope for at least a short-term bullish move.
From an Elliott Wave perspective , it seems like the S&P 500 index is completing the microwave 4 of the microwave C of the main wave Y within the descending broadening wedge.
I expect that after the next small dip, the S&P 500 index will start rising again from near the lower boundary of the wedge, the 50_SMA(Daily) , and Support lines .
Note: If the S&P 500 index falls below about $6,650, we should expect further downside. So let's keep an eye on that level.
Please respect each other's ideas and express them politely if you agree or disagree.
S&P 500 Index Analyze (SPX500USD), 1-hour time frame.
Be sure to follow the updated ideas.
Do not forget to put a Stop loss for your positions (For every position you want to open).
Please follow your strategy and updates; this is just my Idea, and I will gladly see your ideas in this post.
Please do not forget the ✅' like '✅ button 🙏😊 & Share it with your friends; thanks, and Trade safe.
SP500 Consolidated Bullish range because rebounded stronglyThe SP 500 is currently consolidating within a bullish range after price action recently tested key support levels and rebounded strongly. This suggests that buyers are defending the lower boundary of the range, maintaining the broader bullish momentum.
On Wednesday, U.S. equities gained, led by a rebound in technology-related shares. Additionally, U.S. private payrolls data came in stronger than expected, signalling continued labour market resilience and supporting investor sentiment. Meanwhile, the U.S. dollar extended its gains from last week, reflecting confidence in the U.S. economy.
If bullish momentum continues and the current support holds, we could see further upside potential, with the SP 500 possibly targeting the 6,900–6,980 range in the near term.
You may find more details in the chart.
Trade wisely best of Luck buddies.
Ps; Support with like and comments for better analysis Thanks for Supporting.

S&P to inflect at the Fib extension about now? Will the SP500 inflect at the fib extension of 1.618 of the prior dip down?
This is an important price level to watch to see if the index is bullish or bearish
My view is that its going to be a bearish outcome, however the market is being a bit naughty at the moment and it may push you over this price level to take out liquidity first before heading lower.
There are very few bears left out there - will they come out of hibernation right about now?

NQ / Future'sToday’s price action was a clear example of structural breakdown. The clues started forming about a week ago and began to solidify by Monday morning, with confirmation coming early Tuesday. It’s simple — once you understand market structure, you can avoid bad entries and emotional trades. I alerted everyone ahead of time not to go long and outlined the most likely scenario, which played out exactly as expected. You had clue's from bitcoin, you had clue's from SPX. Everybody becomes suprised when the market rips and or drops but you have the answers in front of you 24/7, literally.
Hellena | SPX500 (4H): LONG to resistance area of 7000.Colleagues, I believe that the upward movement is not over yet and at the moment the formation of wave “3” is taking place, but the chart shows a gap that should be closed.
Therefore, I believe that the price can go into correction of the small wave “4” to the area of 6823, but the priority is still the upward movement, as I believe to the resistance area of 7000.
Fundamental context
U.S. business activity strengthened in October: the S&P Global PMI rose to 54.8, indicating expansion in both manufacturing and services sectors.
However, uncertainty persists — business sentiment and export performance have weakened, while the partial government shutdown limits data visibility.
At the same time, the Federal Reserve is expected to continue rate cuts as the economy shows signs of slowing.
Manage your capital correctly and competently! Only enter trades based on reliable patterns!


I'm just marking support and resistance day 3 learning trading Just started, don't wait to really get my first 100 dollars. Just excited to really learn and start trading.

S&P will decline to 6350 from 6840 in the next 2-5 daysS&P will decline to 6350 from 6840 in the next 2-5 days

Brace for Impact (I hope I am wrong)This market is reminiscent of the action before the 2020 crash. Above is now and below is 2020 covid crash. The charts are self explanatory so not much for me to say.
This is not a financial advice but for entertainment only. Please do your research!

Update at 4pmAlthough the trade did not go my way today, I still expect a further move down. I'm incorrect if they get over the high from today. Gold also looks ready to test it's lows. Oil still consolidating above it's 18ma. BTC looks like a pullback is also coming, a further low is expected still.

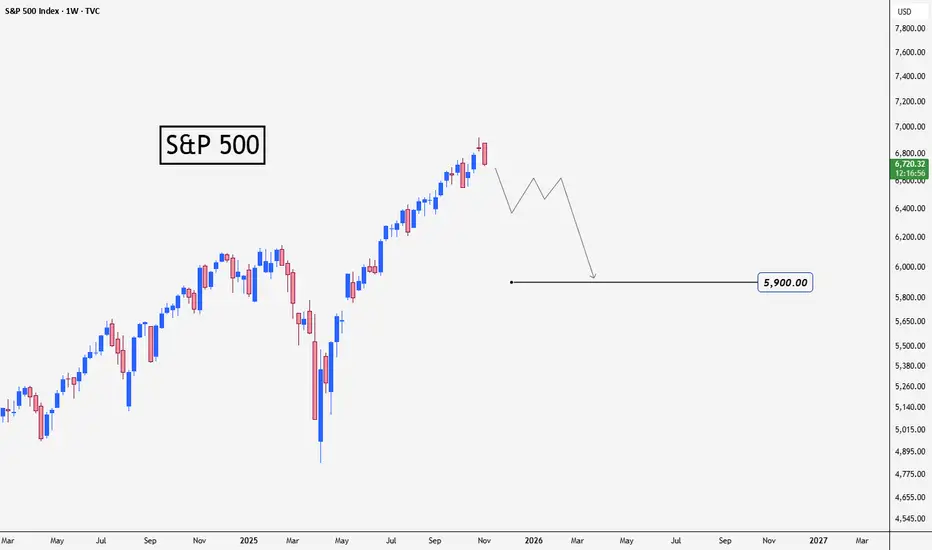
S&P 500 Predict the next waveHello everyone, I hope you are all well.
I wanted to share my prediction for the next wave of the S&P 500 index. It's as shown in the chart
The chart is on the weekly timeframe. I expect the decline to last for a period of time that could reach 6 months or more
This is not investment advice; please take full responsibility for your buying and selling decisions.
Warning: Be careful not to use this idea with leverage, as you could lose all your money
Bull Run Stumbles: S&P 500 Heads Toward a Potential Correction After a rough day on Wall Street, the S&P 500 dropped about 1.2%, pulling U.S. markets lower. But there’s more behind this fall than just profit-taking.
What’s Really Happening?
Warning Signs from Wall Street
Two top banking leaders raised caution. Morgan Stanley’s Ted Pick expects a 10–15% correction, calling it a “healthy normalization.”
Goldman Sachs’ David Solomon warned that tech stocks are showing bubble-like behavior, with prices running much faster than earnings.
AI Boom Driving Market Concentration
The AI craze and tech optimism have made a few mega-cap companies dominate the market. In fact, just 10 big tech firms now make up nearly 40% of the S&P 500’s total value, making the market more fragile.
Fed Confusion Adds to Uncertainty
The Federal Reserve is sending mixed signals — some officials talk about possible rate cuts by December, while others say rates should stay high because the economy is still strong.
Adding to the mess, a partial U.S. government shutdown has delayed key data, leaving investors and the Fed guessing about what’s really happening in the economy.
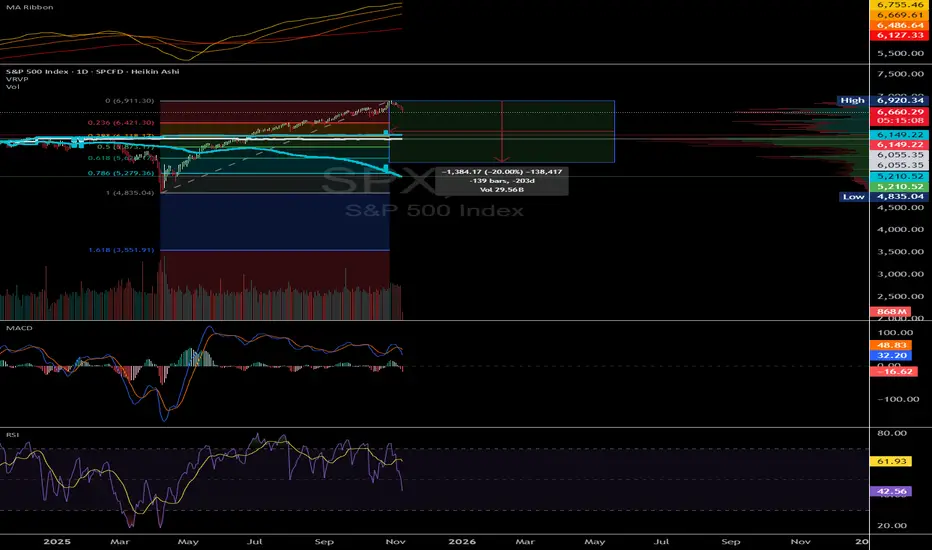
What the Chart Reveals
From a technical standpoint, the U.S. market’s rally has been nothing short of extraordinary. Since the April bottom near 4,835, the index has soared nearly 42%, touching a recent peak around 6,920 — and even gained about 12–13% before the latest (April 2025) pullback began.
But now, the momentum seems to be fading. The chart is flashing early warning signals — RSI divergence suggests that while prices made new highs, the underlying strength (momentum) did not. That often hints at a potential trend reversal.
If this weakness deepens, the index could correct swiftly by around 10%, targeting the 6,200–6,100 zone. And if the “healthy normalization” predicted by Morgan Stanley’s Ted Pick (a 15% drop) plays out, the index might slide further to around 5,700 — a level that would reset valuations to more reasonable territory after the sharp run-up.
Valuation Check
Let’s set aside all the opinions and headlines for a moment and focus on the key valuation metrics that truly help us understand the real picture of the U.S. market.
The Price-to-Earnings (P/E) Ratio — The Market’s Mood Meter
P/E Ratio = Current Market Price/Earnings Per Share (EPS)
So, Current Market Price = P/E Ratio*EPS
Currently, the S&P 500’s P/E ratio stands at 30.8x, with an EPS of $222.5.
When you multiply the two — 30.8 × 222.5 = roughly $6,800 — it perfectly aligns with the index’s recent market level.
Now, to find out what the fair value of the market should be, let’s use the 5-year median P/E ratio, which is around 25.4x.
Fair Market Price = 25.4*222.5 = 6,650.
This aligns perfectly with the technical chart levels, suggesting that a 15% correction would be a healthy pullback to help cool down the overheated U.S. market.
The Buffett Indicator — Market Cap vs. GDP
One of Warren Buffett’s favorite valuation tools compares the total U.S. stock market capitalization to the country’s GDP — essentially measuring how large the market has grown relative to the real economy.
At present, this ratio stands at around 224%, far above the long-term fair value range of 100–120%. Even when compared to its 5-year median level of 192%, the market still appears significantly overvalued.
To return to its median level, the ratio would need to drop by roughly:
100 = 16.6%
That’s roughly a 15–16% correction, which again perfectly aligns with both the technical chart signals and Ted Pick’s projection of a healthy market normalization.
The Bottom Line
The U.S. market’s extraordinary rally has been built on a mix of AI optimism, liquidity hopes, and investor euphoria, but the fundamentals are starting to whisper caution.
Both valuation metrics and technical signals point to the same conclusion — the market is stretched, and a 10–15% correction wouldn’t be a disaster; it would be a return to balance.
History shows that every overheated bull run needs a pause — not to end the story, but to give it a stronger foundation.
So if the coming months bring some red on the screen, smart investors will see it not as fear, but as the market taking a deep breath before its next big move.
