The Culmination of the 2025 Bull Market: AI Mania Tipping PointThe Culmination of the 2025 Bull Market: AI Mania Tipping Point
A. Geometry of the 2-Week Chart
On the 2-Week chart, price has reached the upper boundary of the 1:20 parallel channel —
the same structural angle that has defined the entire post-2020 bull cycle.
This angle rises at 20 points per 2-

SP500 short-term consolidation renewed bullish strength.SP500 has rebounded strongly from the recent demand zone near 6,630–6,650, showing a clear shift in momentum toward the upside. Price has broken out of the short-term consolidation, indicating renewed bullish strength.
Technically Price previously traded inside an ascending channel but recently dip

SPX - Hours Of Work To Buy 1 ShareHours of work needed to buy just one share of the S&P 500 just hit a new all-time high: 187 hours.
That’s:
150% more work than 2007
60% more than pre-COVID (2019)
10% more than “Liberation Day”
As I tell my kids:
Don’t look at the price tag.
Look at how many hours of your life — your

Sell US500 – Clear Signs of Bearish Smart-Money Flow1. Bearish structure confirmed
The previous bullish Order Block has been completely broken with a sharp displacement and high volume.
When an OB fails this decisively, it signals a clear shift in market structure from bullish to bearish as buyers lose control.
2. New Bearish Order Block formed at

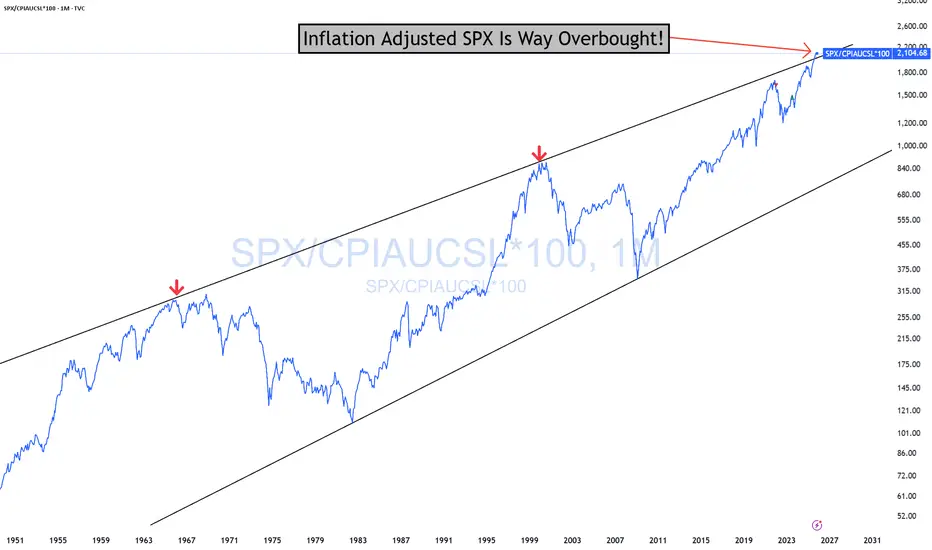
SPX Overbought In Real Terms WARNING!SPX Overbought In Real Terms (Inflation-adjusted) Stripping away inflation shows you the "real" value of SPX.
This is not something you will likely see again in your lifetime. We have only been this overbought twice before since 1947! Both times, what followed was a bear market. You are far more l
S&P500 crashes! Due relief rally or further pain?Nvidia delivered impressive earnings, but the stock reversed and closed nearly 3% lower, triggering heavy selling across tech and risk assets as odds for a December rate cut have collapsed to just 34%, with policy uncertainty amplified by the cancelled October NFP report. Despite a strong market and

S&P 500 Roadmap: Correction Rally Ending—Another Drop Is ComingAs I expected in the previous idea , the S&P 500 index( SP:SPX ) moved toward the broken Support lines and completed its pullback, reaching its targets.
Given that the S&P 500 index nowadays shows a significant correlation with the cryptocurrency market and Bitcoin( BINANCE:BTCUSDT ), it’s wise to

Watch the banksKRE (regional banks) is looking like it's setting up a potential C wave down. If so, there's something wrong in that sector and it will drag the market down with it, especially IWM.
AAPL probably a false breakout here and I expect a large move down.

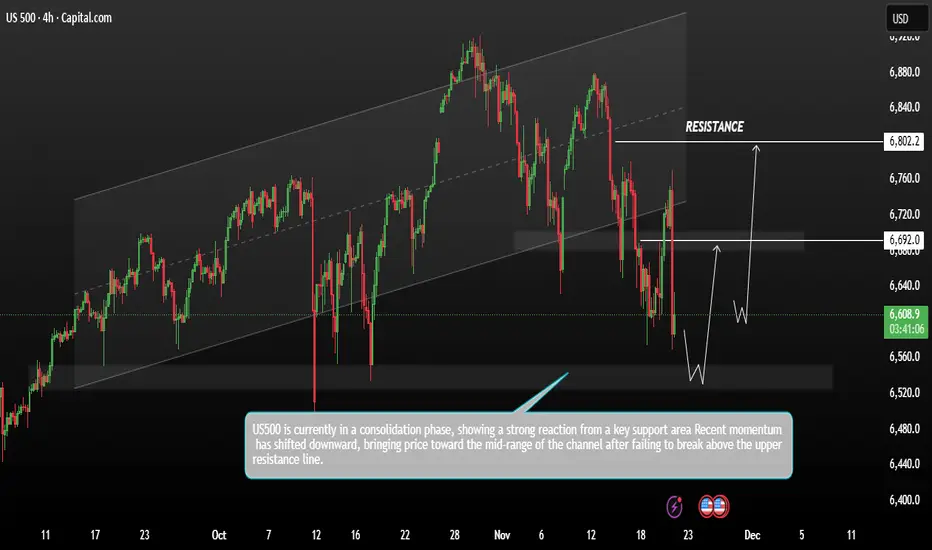
US500 Price Showing Bullish forming a reversal patternUS500 price action moving within a broad ascending channel, with multiple touches on both the upper and lower trend boundaries. Recent momentum has shifted downward, bringing price toward the mid-range of the channel after failing to break above the upper resistance line.
A key support zone sits ar
Hellena | SPX500 (4H): LONG to resistance area of 6775.Dear colleagues, according to the last forecast the price is at the support level, but as it turned out, the correction in wave “4” is a bit more complicated than I thought.
Wave “4” consists of three waves “ABC” and should be over soon. The upward movement is still in priority, but I will target t

See all ideas
Displays a symbol's price movements over previous years to identify recurring trends.
Frequently Asked Questions
S&P 500 Index - Standard & Poors 500 (SPX) reached its highest quote on Oct 30, 2025 — 6,928.7 USD. See more data on the S&P 500 Index - Standard & Poors 500 (SPX) chart.
The lowest ever quote of S&P 500 Index - Standard & Poors 500 (SPX) is 1,384.9 USD. It was reached on Nov 28, 2012. See more data on the S&P 500 Index - Standard & Poors 500 (SPX) chart.
S&P 500 Index - Standard & Poors 500 (SPX) is just a number that lets you track performance of the instruments comprising the index, so you can't invest in it directly. But you can buy S&P 500 Index - Standard & Poors 500 (SPX) futures or funds or invest in its components.